| Previous Month | Next Month |
Temperatures through the month of May were 1 to 3 degrees below normal.
Precipitation through the month of May was around 1 to 2 inches above normal.
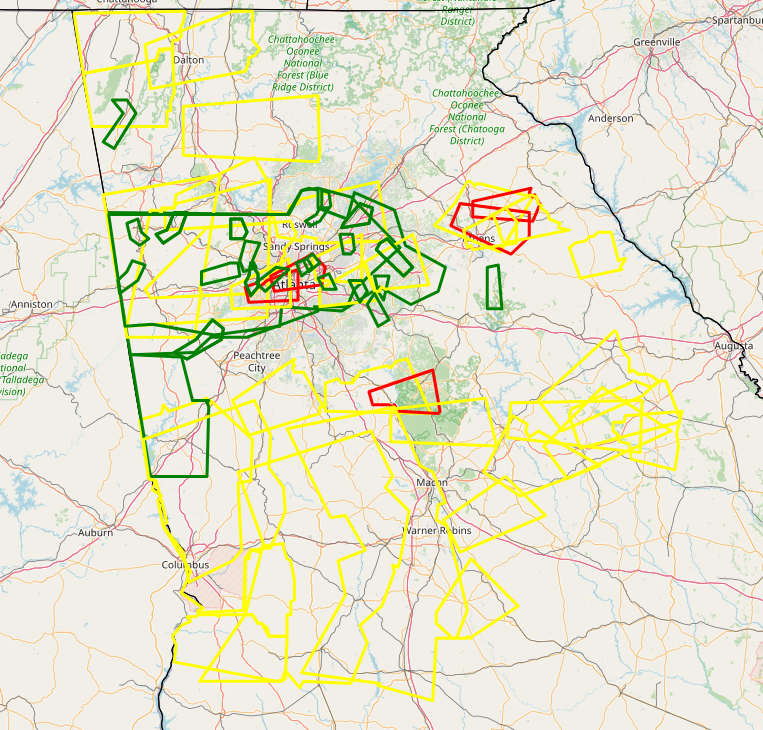
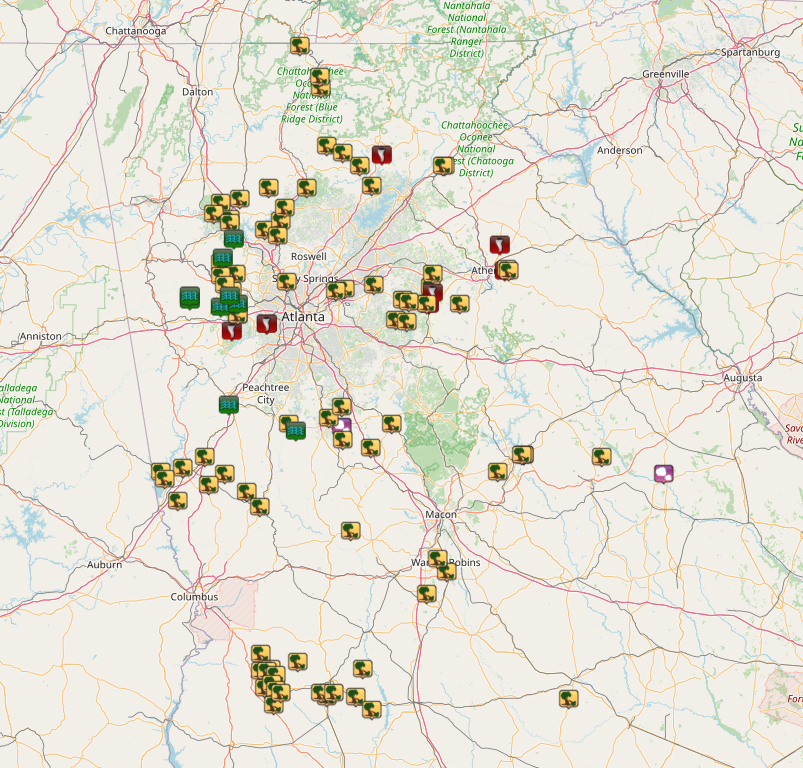
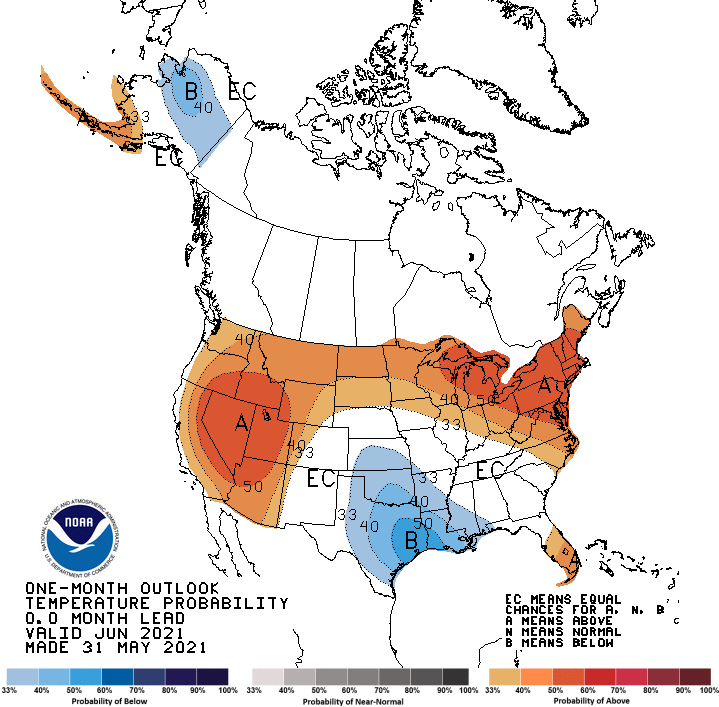
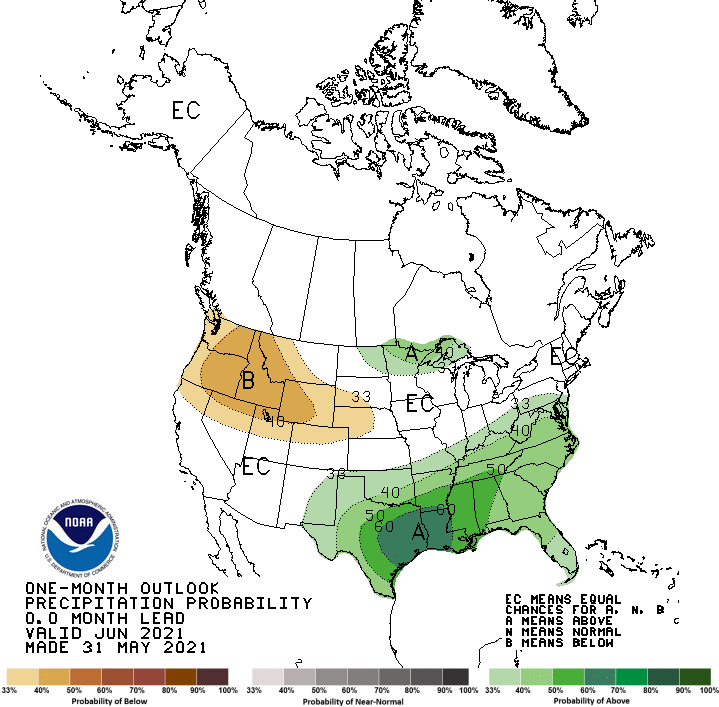
No daily records were broken for the month of May Total Precipitation (inches) May 3-4: Early Monday, May 3rd, 2021, strong to severe thunderstorms developed across North and Central GA, prompting the Storm Prediction Center to issue Tornado Watch 127. Additional rounds of severe thunderstorms, resulting in Severe Thunderstorm Watch 145, impacted West and North GA the following day (May 4th). Numerous reports of storm/wind damage were noted across the area, in addition to 6 total tornadoes (5 on Monday, May 3rd). Details on the tornadoes from NWS ground surveys that were done in collaboration with county Emergency Management, can be found on the Event Review Page. Warnings Issued Storm Reports Based on the Climate Prediction Center's outlook for June, Georgia has an Equal Chance for above, below or near normal temperatures. For precipitation, far northwest Georgia has a 50% to 60% chance of above normal precipitation while the rest of Georgia has a 40% to 50% chance of above normal precipitation.
Overview
Climate Graphs
Records
Events
June Outlook
Below are the overview stats for May 2021 for our 10 climate sites.
May 2021 Climate Averages
Climate Site
May Temp (°F)
Average Temp
Departure From Normal
69.9
70.8
-0.9
69.7
71.2
-1.5
71.0
74.1
-3.1
70.4
72.9
-2.5
67.2
68.3
-1.1
67.2
69.4
-2.2
67.8
69.8
-2.0
67.5
68.7
-1.2
67.7
70.4
-2.7
68.3
69.5
-1.2
May 2021 Temperature Climate Statistics
Climate Site
Maximum Temperature
Max T Date
Minimum Temperature
Min T Date
Athens
95
5/24, 5/25
45
5/8, 5/13
Atlanta
91
5/24, 5/25
48
5/13
Columbus
93
5/25
46
5/8
Macon
95
5/25, 5/26
42
5/8
Cartersville
90
5/25
45
5/8, 5/14
Dekalb Peachtree Arpt
92
5/24
44
5/8, 5/13
Fulton Co Arpt
91
5/25
45
5/8, 5/13
Gainesville
90
5/24, 5/25
46
5/13
Peachtree City
91
5/25
43
5/8
Rome
93
5/24, 5/25
44
5/14
May 2021 Precipitation Climate Statistics
Climate Site
Normal Precipitation
Departure
From Normal
4.05
3.28
+0.77
5.15
3.56
+1.59
3.76
3.24
+0.52
1.84
2.65
-0.81
5.94
3.67
+2.27
7.44
3.83
+3.61
6.04
3.64
+2.40
5.74
4.01
+1.73
3.68
3.12
+0.56
3.79
3.78
+0.01
May 2021 Precipitation Climate Statistics
Climate Site
Maximum Daily Precip.
Max P Date
Athens
1.70
5/3
Atlanta
1.91
5/3
Columbus
1.66
5/3
Macon
0.74
5/28
Cartersville
2.18
5/4
Dekalb Peachtree Arpt
3.44
5/3
Fulton Co Arpt
2.52
5/3
Gainesville
1.88
5/4
Peachtree City
1.68
5/4
Rome
2.00
5/4
Click the links below to explore the temperature and precipitation data across North and Central Georgia for the month of May.
Temperature Maps
Precipitation Maps
Temperature Graphs
Precipitation Graphs
Temperature and precipitation records at our 4 main climate sites are located below.
May 2021 Climate Records
No Records were broken during the month of May
Larger events that occurred across north and central Georgia this past May can be found here.


The June climate outlook is below.
June Outlook

