North and Central Georgia
July 2019 Climate Summary
| Previous Month | Next Month |
For July, the majority of locations were 0 to 2 degrees warmer than normal and 0 to 3 inches drier than normal.
|
July Monthly Top 10 Rankings |
|---|
|
Athens |
|
5th Driest July on Record |
| Atlanta |
|
9th Warmest July on Record |
| Columbus |
|
None |
| Macon |
| None |
*Complete rankings in tables below
Temp. Extremes (ºF) for July
|
Site |
Warmest Temp. |
Coldest Temp. |
|
Athens |
99 (7/16) |
63 (7/25,7/26) |
|
Atlanta |
95 (7/2,7/4) |
67 (7/25) |
|
Columbus |
98 (7/2) |
67 (7/25) |
|
Macon |
100 (7/16,7/18) |
60 (7/25)* |
|
Cartersville |
96 (7/2)* |
58 (7/25)* |
|
DeKalb Peachtree Arpt |
95 (7/2) |
62 (7/25)* |
|
Fulton Co. Arpt |
95 (7/2,7/4,7/5,7/16*) |
60 (7/25)* |
|
Gainesville |
94 (7/2) |
64(7/26)* |
|
Peachtree City |
96 (7/4)* |
61 (7/25) |
|
Rome |
100 (7/8) |
60 (7/25)* |
* Set record for day
July Avg. Temperature (°F) and Rankings
* Click on site name below to view a graph with additional data
|
Site |
Avg. Temp. and Current Ranking |
Normal |
Dep. from Normal |
Record |
|
82.0 (18th Warmest) |
80.6 |
+1.4 |
85.2 (1993) |
|
|
82.2 (9th Warmest) |
80.2 |
+2.0 |
85.3 (1993) |
|
|
83.3 (30th Warmest) |
82.5 |
+0.8 |
85.8 (1993) |
|
|
82.9 (23rd Warmest) |
81.8 |
+1.1 |
86.5 (1986) |
|
|
79.9 |
78.3 |
+1.6 |
|
|
|
80.2 |
79.8 |
+0.4 |
|
|
|
81.1 |
79.8 |
+1.3 |
|
|
|
80.0 |
78.8 |
+1.2 |
|
|
|
81.5 |
79.3 |
+2.1 |
|
|
|
81.8 |
79.4 |
+2.4 |
|
Precip. Extremes (in) for July
|
Site |
Highest Daily Amount |
|
Athens |
0.56 (7/19) |
|
Atlanta |
0.97 (7/19) |
|
Columbus |
2.00 (7/19) |
|
Macon |
1.21 (7/19) |
|
Cartersville |
1.56 (7/19)* |
|
DeKalb Peachtree Arpt |
0.86 (7/20) |
|
Fulton Co. Arpt |
0.78 (7/29) |
|
Gainesville |
1.13 (7/7) |
|
Peachtree City |
0.91 (7/5)* |
|
Rome |
3.26 (7/20)* |
* Set record for day
July 2019 Precipitation Totals (in) and Rankings
* Click on site name below to view a graph with additional data
|
Site |
Total Precip. and Current Ranking |
Normal |
Dep. from Normal |
Record |
|
1.37 (5th Driest) |
4.47 |
-3.10 |
0.93 (1947) |
|
|
2.06 (13th Driest) |
5.27 |
-3.21 |
0.56 (1881) |
|
|
3.92 (42th Driest) |
4.76 |
-0.84 |
0.96 (2016) |
|
|
3.40 (39th Driest) |
4.95 |
-1.55 |
0.37 (1986) |
|
|
4.44 |
4.66 |
-0.22 |
|
|
|
3.14 |
5.02 |
-1.88 |
|
|
|
2.17 |
5.06 |
-2.89 |
|
|
|
3.07 |
4.51 |
-1.44 |
|
|
|
2.08 |
5.26 |
-3.18 |
|
|
|
4.20 |
4.32 |
-0.12 |
|
Records Set this July
Athens:
​​Atlanta:
Columbus:
Macon:
August Outlook
Based on the Climate Prediction Center’s August outlook, much of north and central Georgia has a 33 to 40% chance of above normal temperatures. For precipitation, all of north and central Georgia has equal chances of above, below, or normal precipitation.
 |
 |
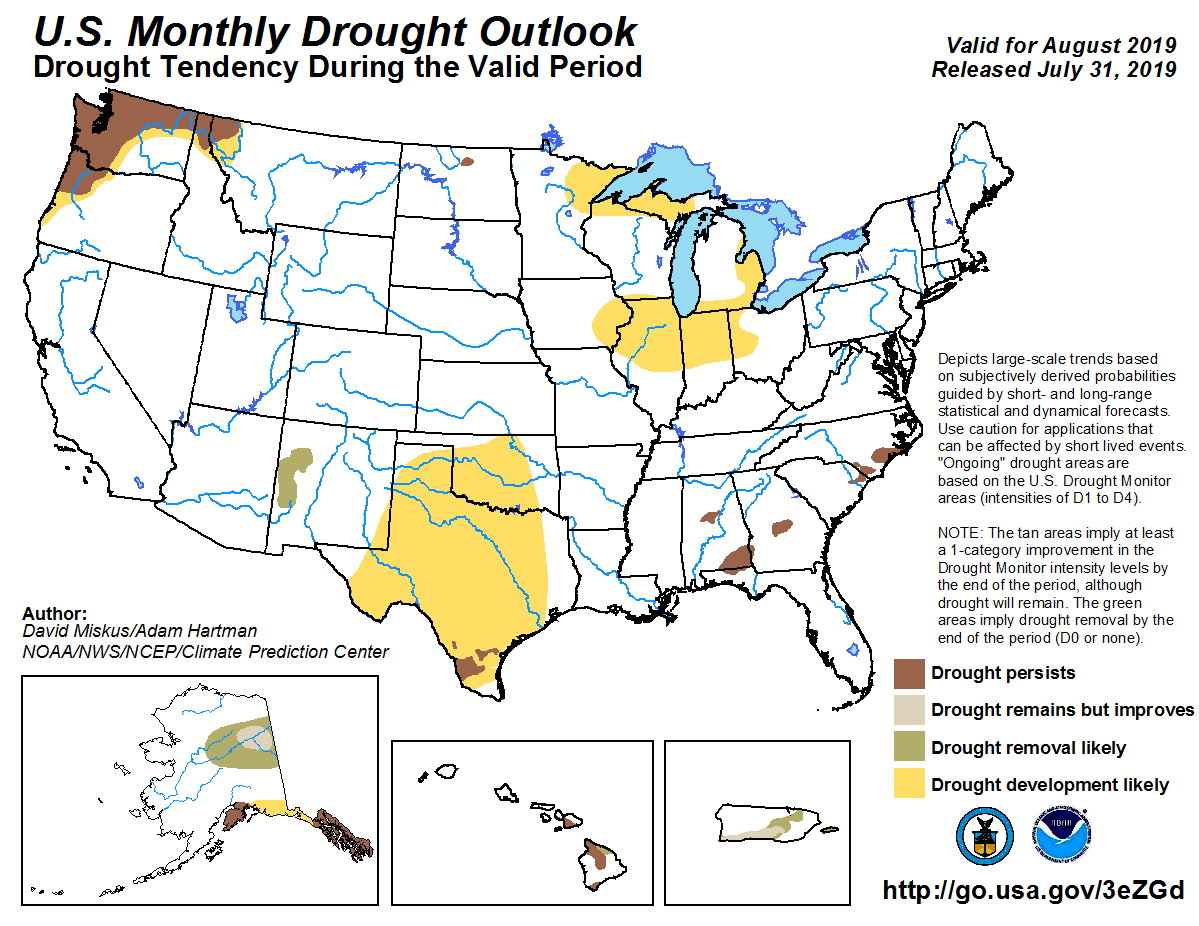
August Drought Outlook
Based on the U.S. Monthly Drought Outlook for June, a small area of drought is expected to persist in portions of central Georgia.
Data prepared by the Atlanta Forecast Office.

