| Previous Month | Next Month |
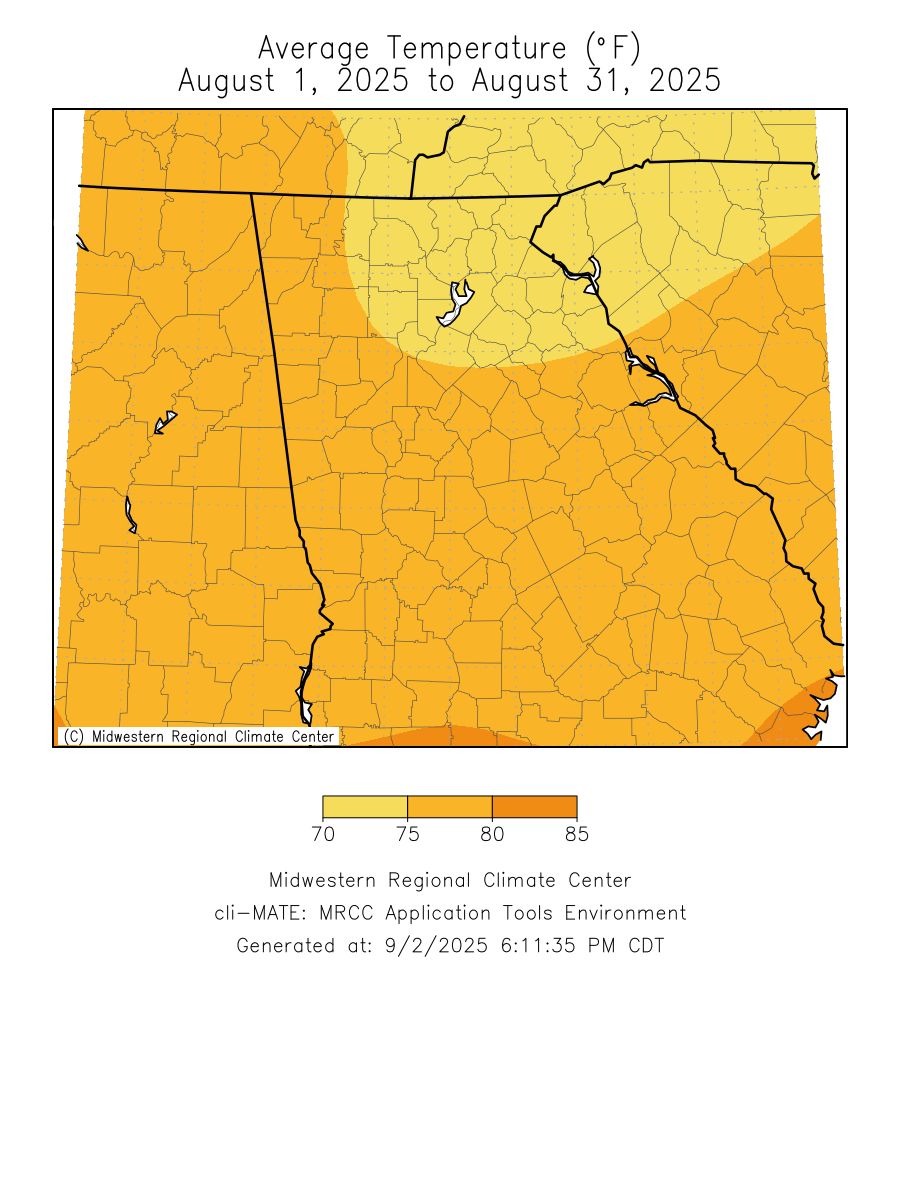
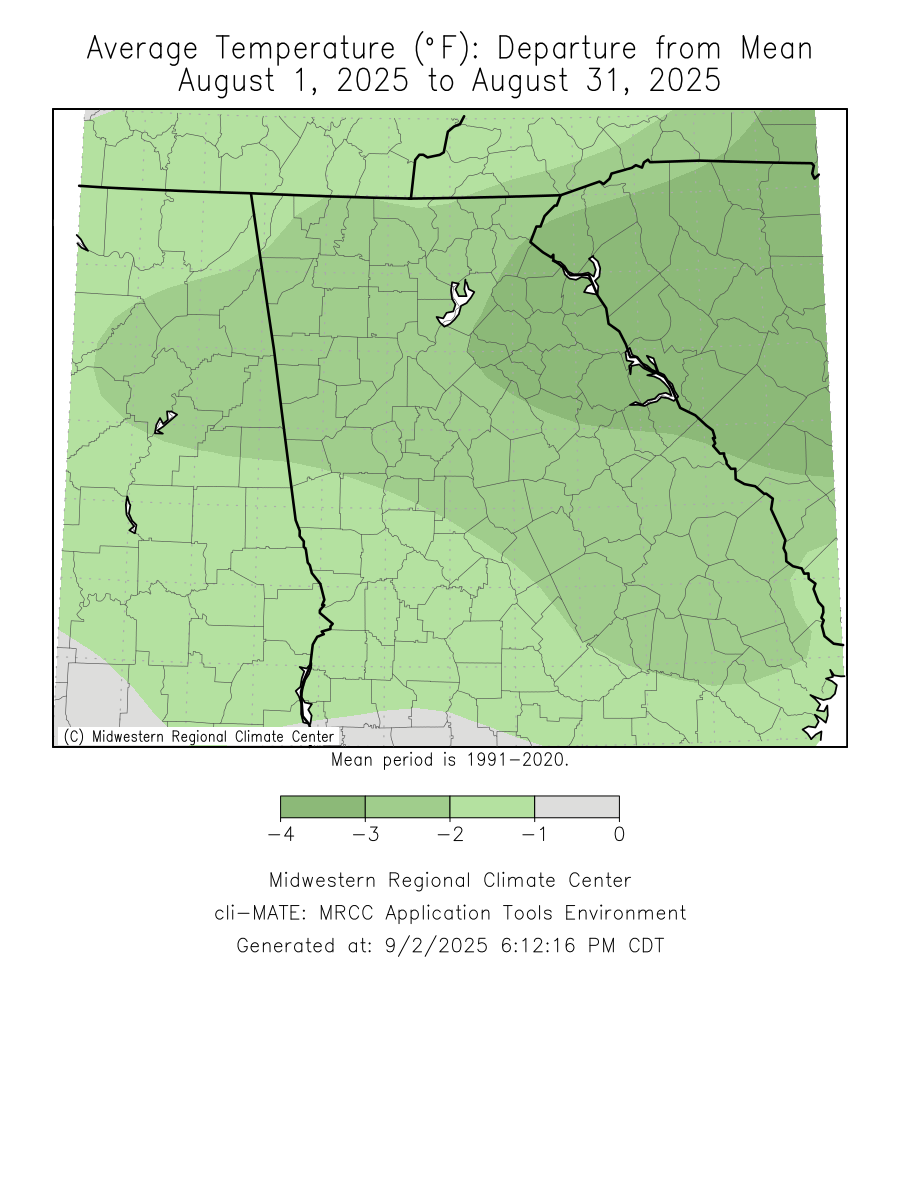
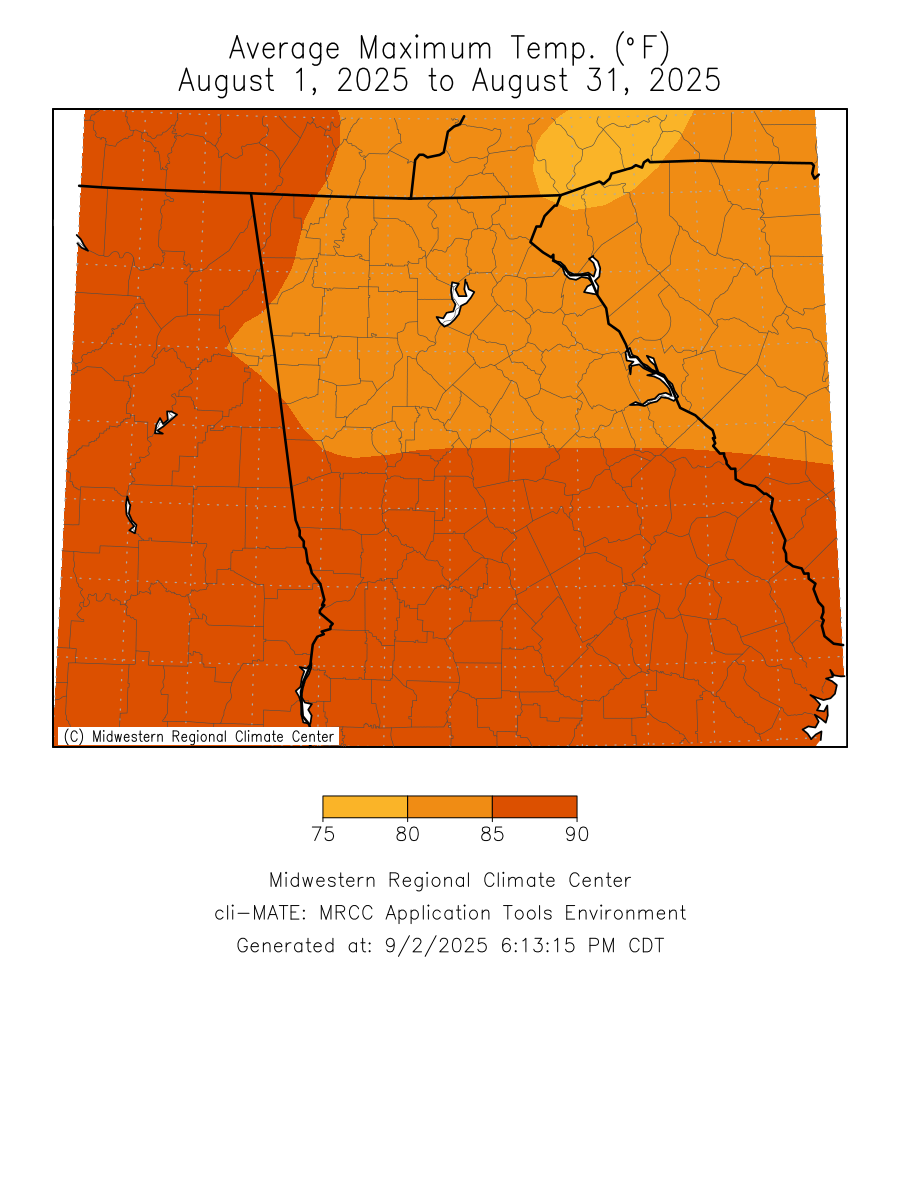
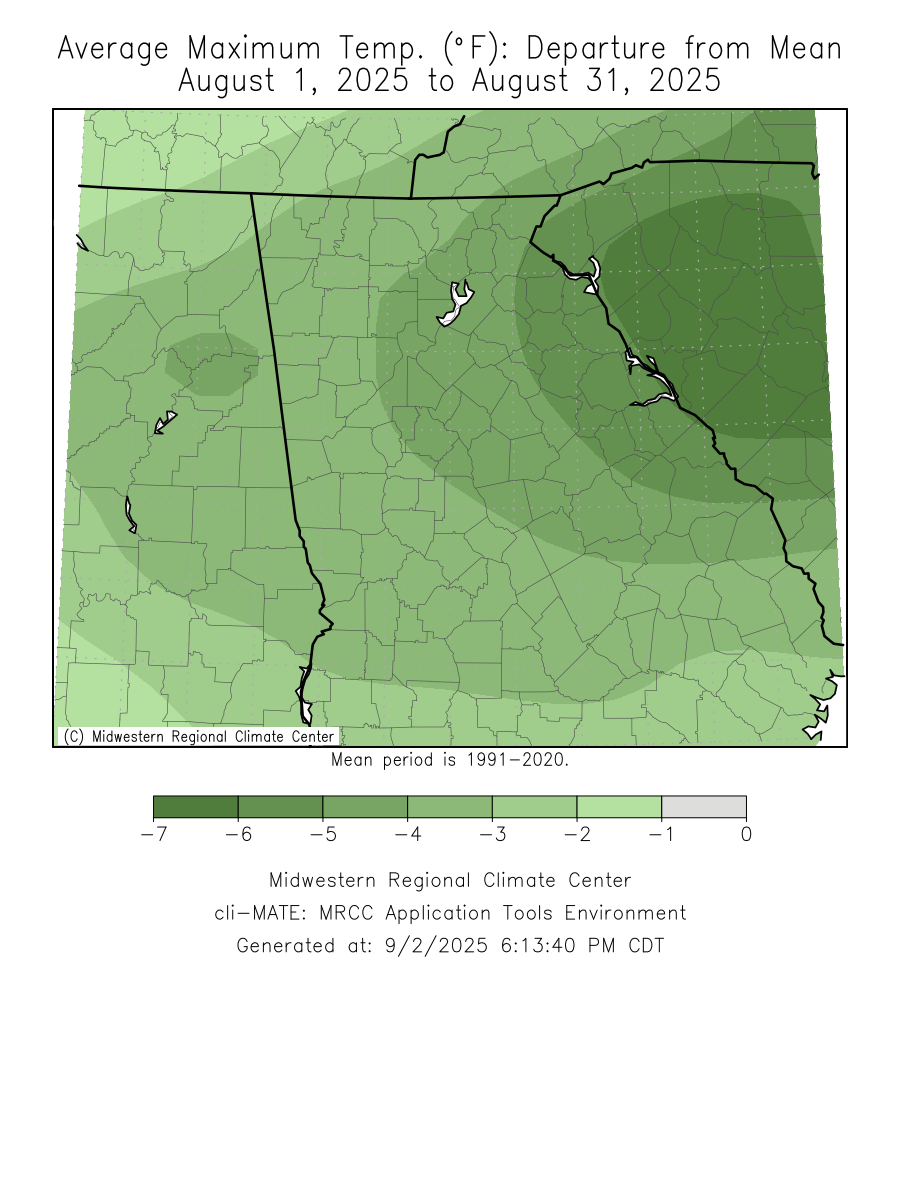
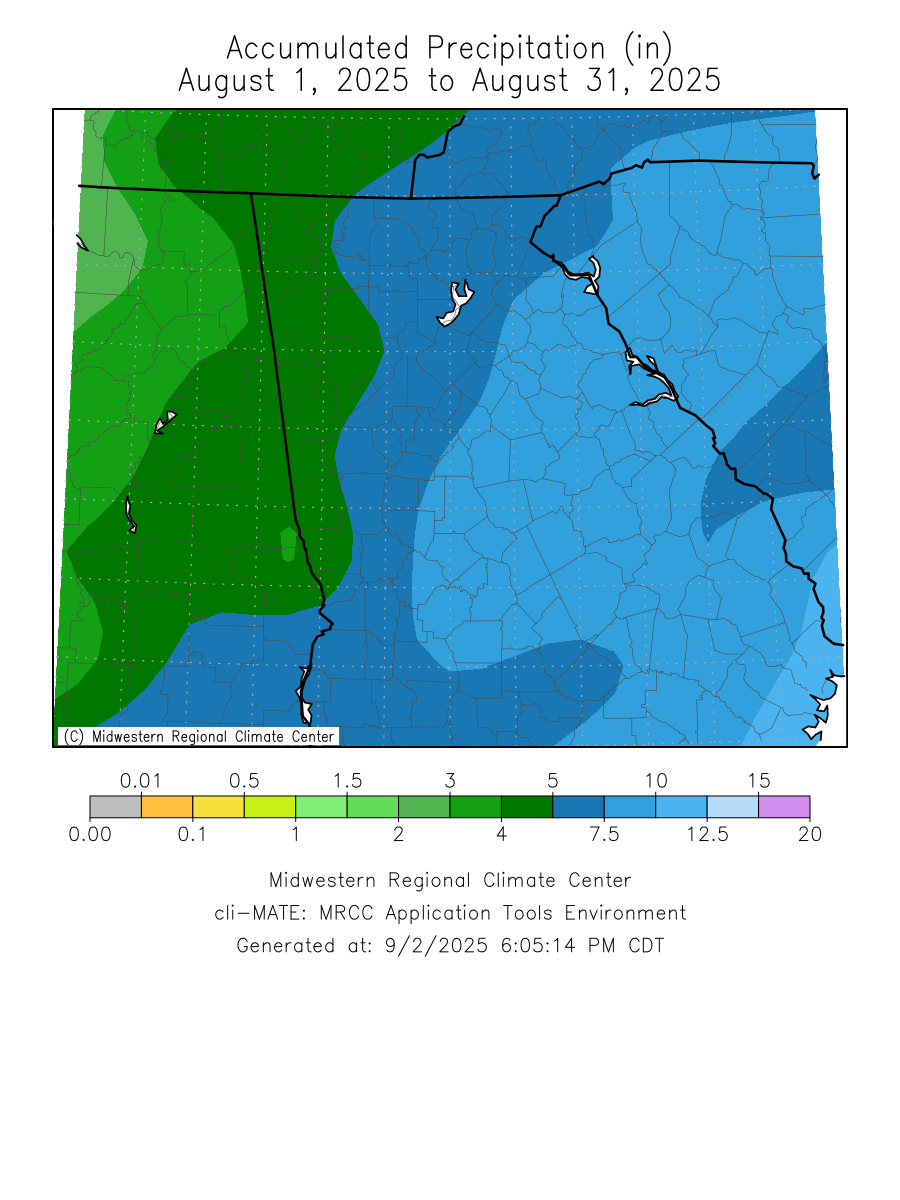
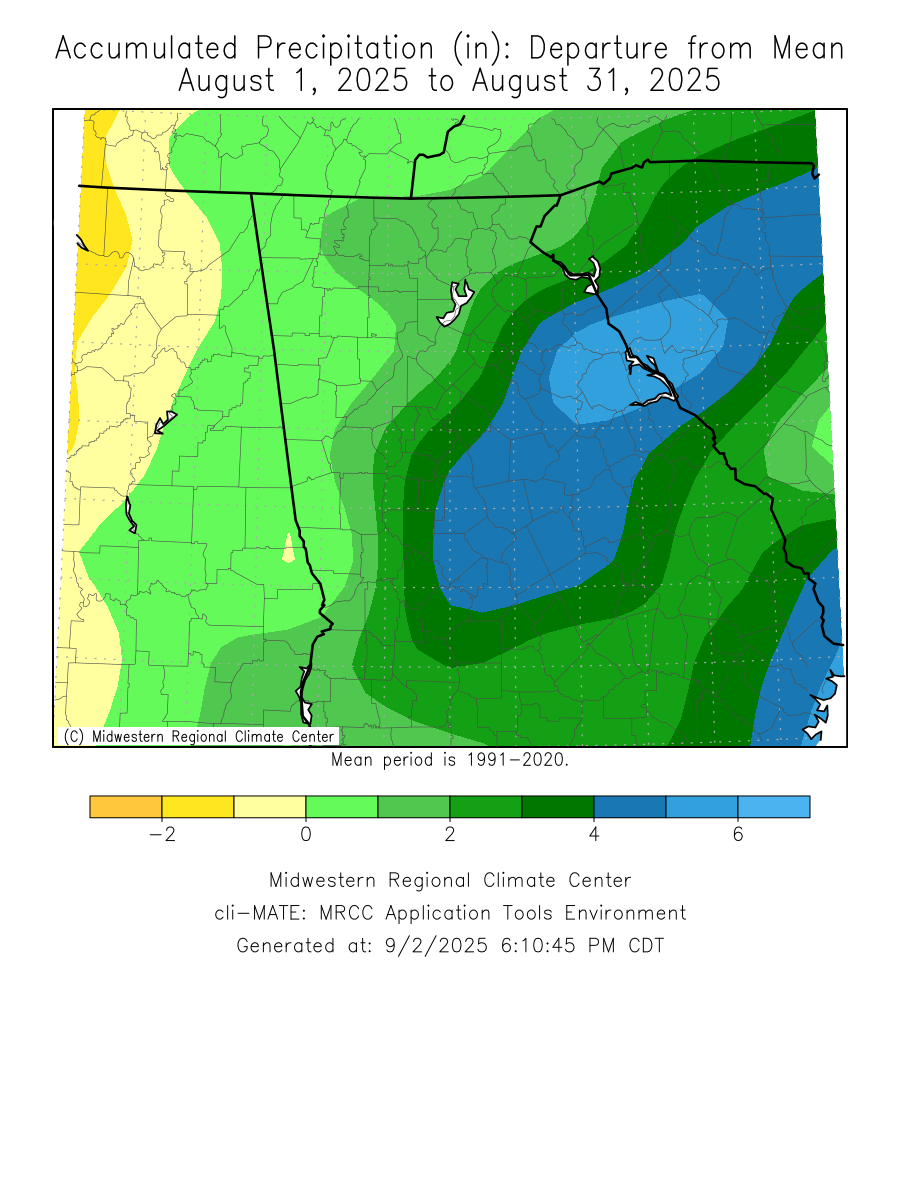
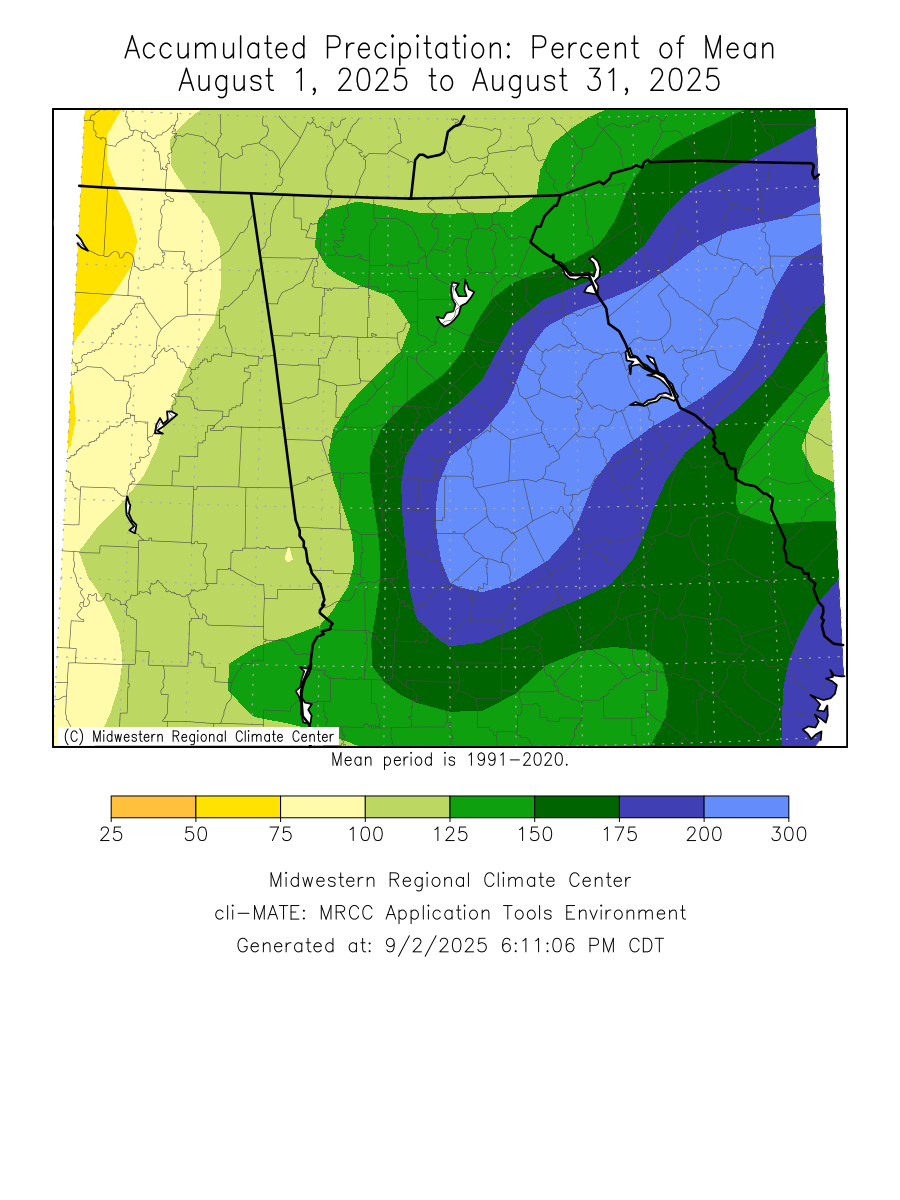
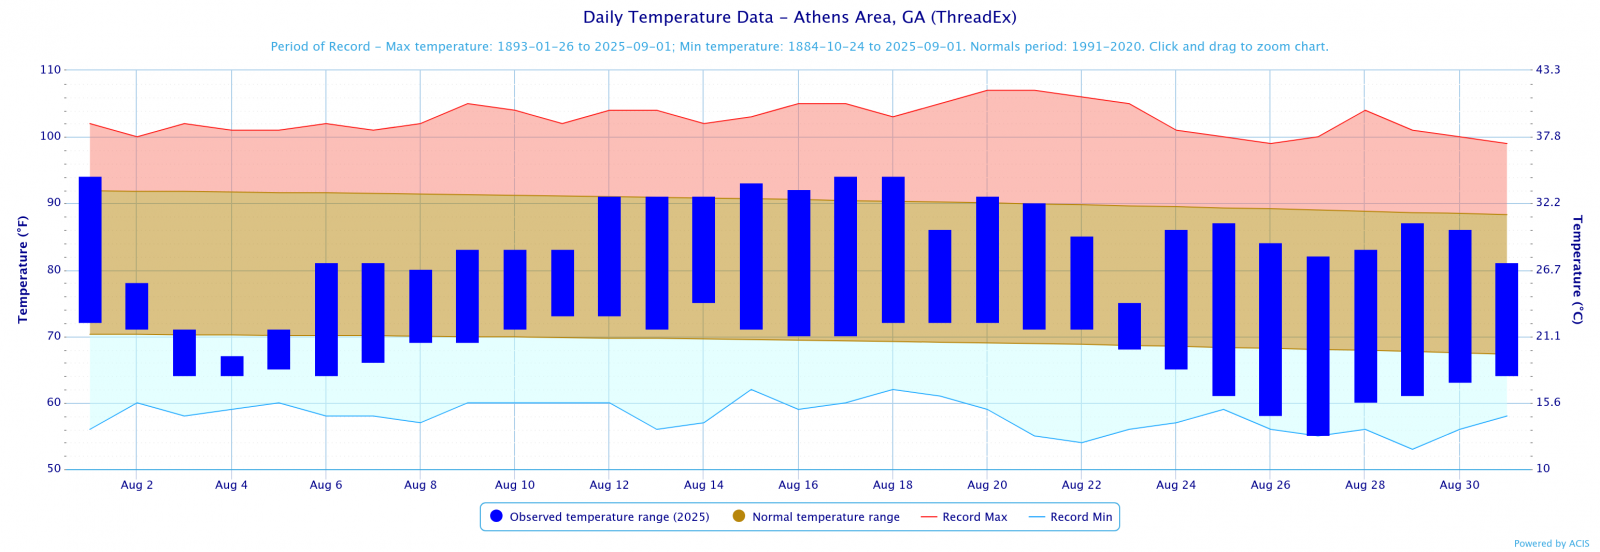
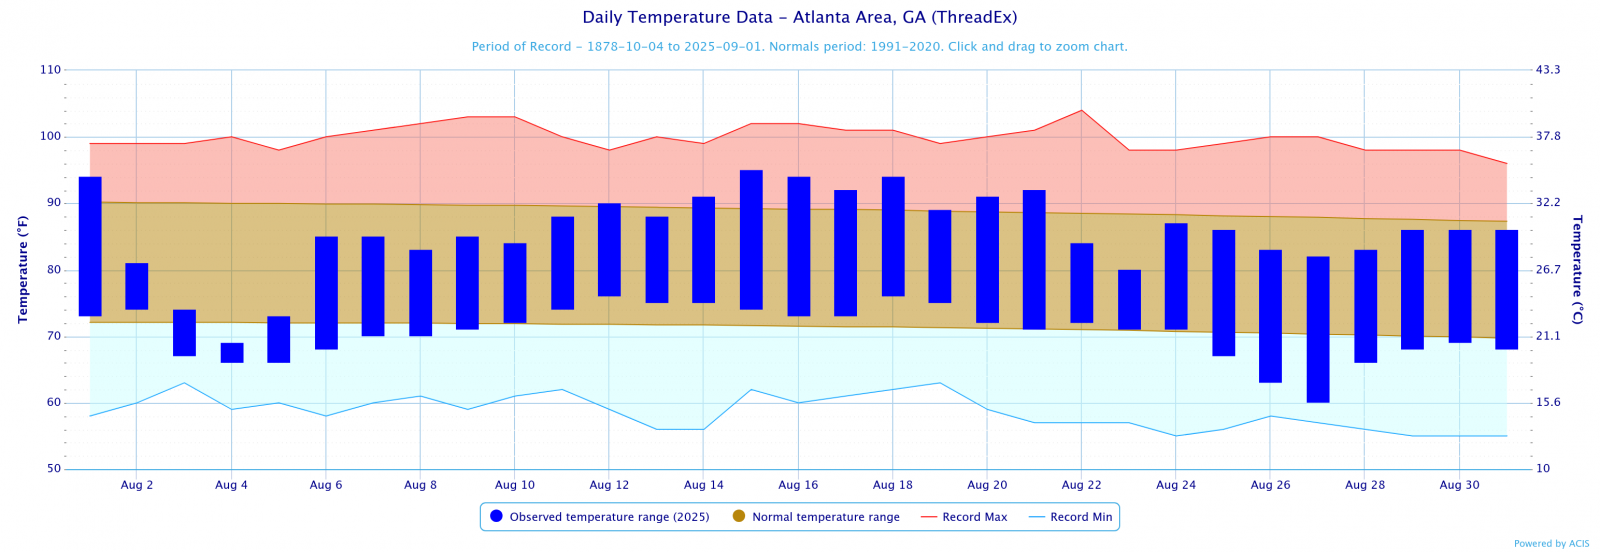
Temperatures through the month of August were three degrees below normal. Precipitation through the month of August was within an inch of normal.
Climate Site Maximum Temperature Max T Date Climate Site Total Precipitation DFN (Departure Climate Site Maximum Daily Precip (in inches) Max P Date *Indicates a daily record was set Data prepared by NWS Peachtree City/Atlanta Based on the Climate Prediction Center's outlook for September, north and central Georgia has equal chances of above or below normal temperatures. South and Central Georgia has a 40% to 50% chance of above normal precipitation. Data prepared by NWS Peachtree City/Atlanta.
Overview
Climate Graphics
Records
Events
September Outlook
August 2025 Climate Averages
Climate Site
Month Temp (°F)
Average Temp
Departure from normal
Athens
76.0
79.8
-3.8
Atlanta
78.2
80.2
-2.0
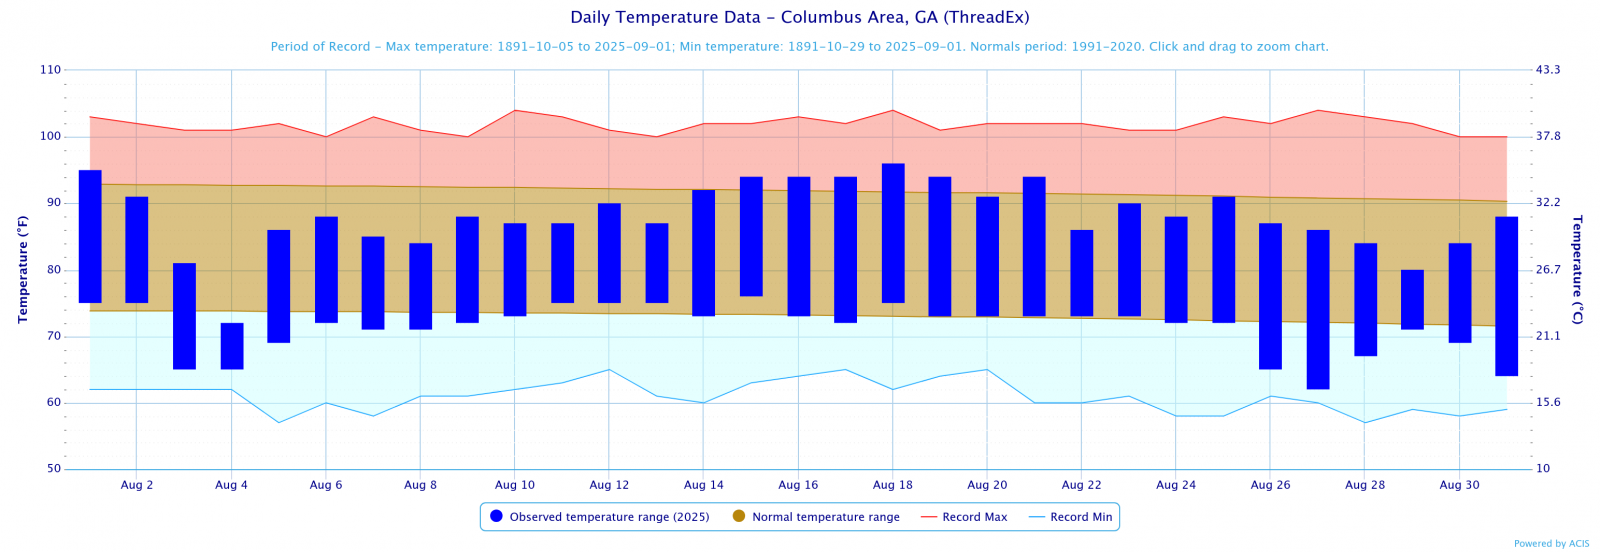
Columbus
79.7
82.4
-2.7
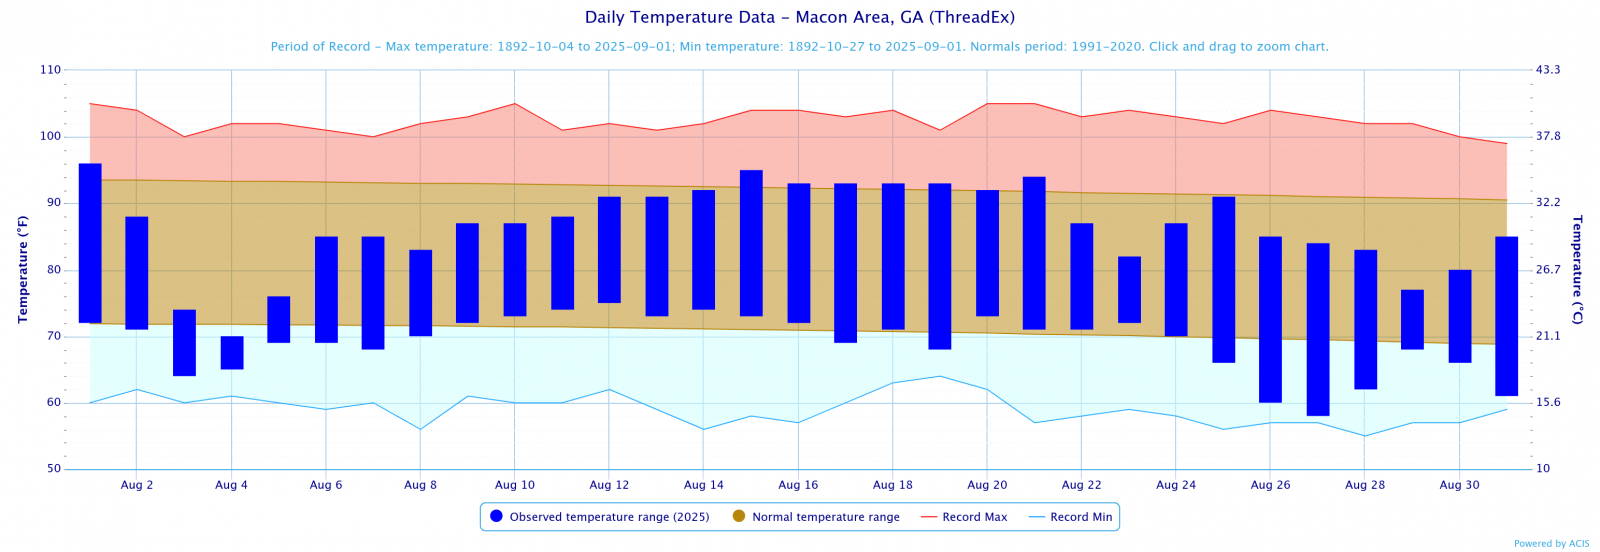
Macon
77.9
81.4
-3.5
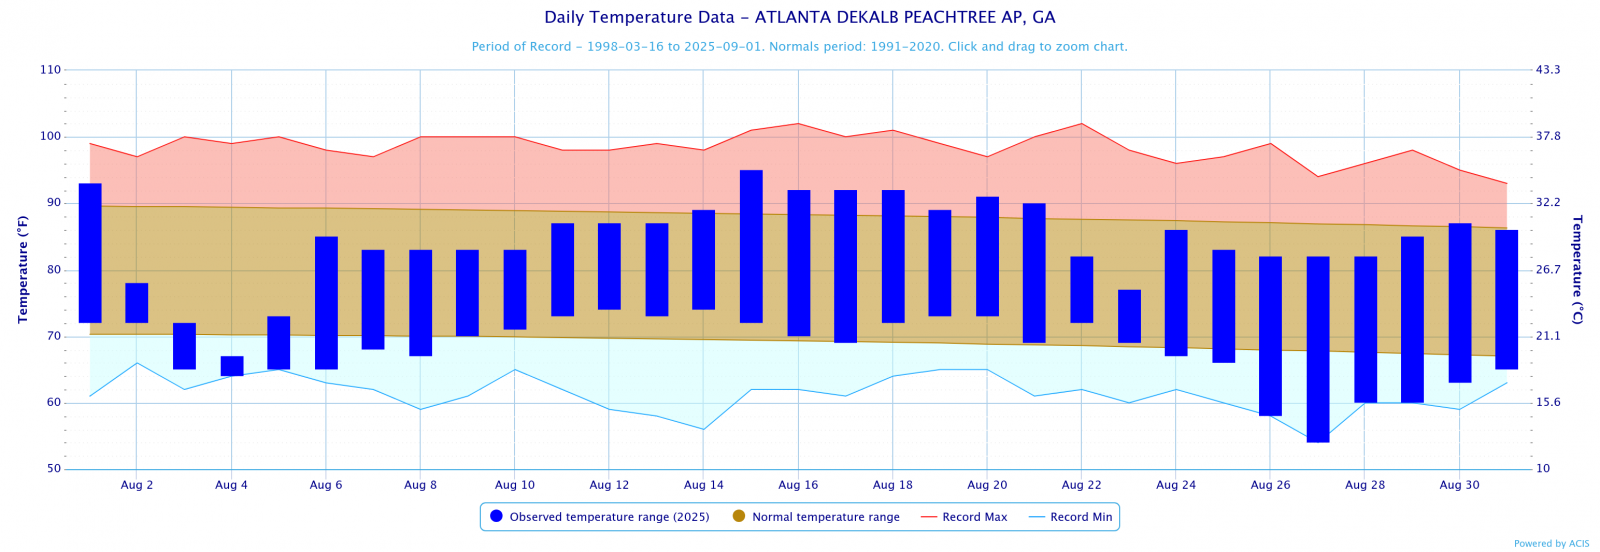
Dekalb Peachtree Arpt
76.3
78.6
-2.3
Fulton Co Arpt
76.3
79.3
-3.0
Gainesville
75.6
77.9
-2.3
Peachtree City
76.1
79.8
-3.7
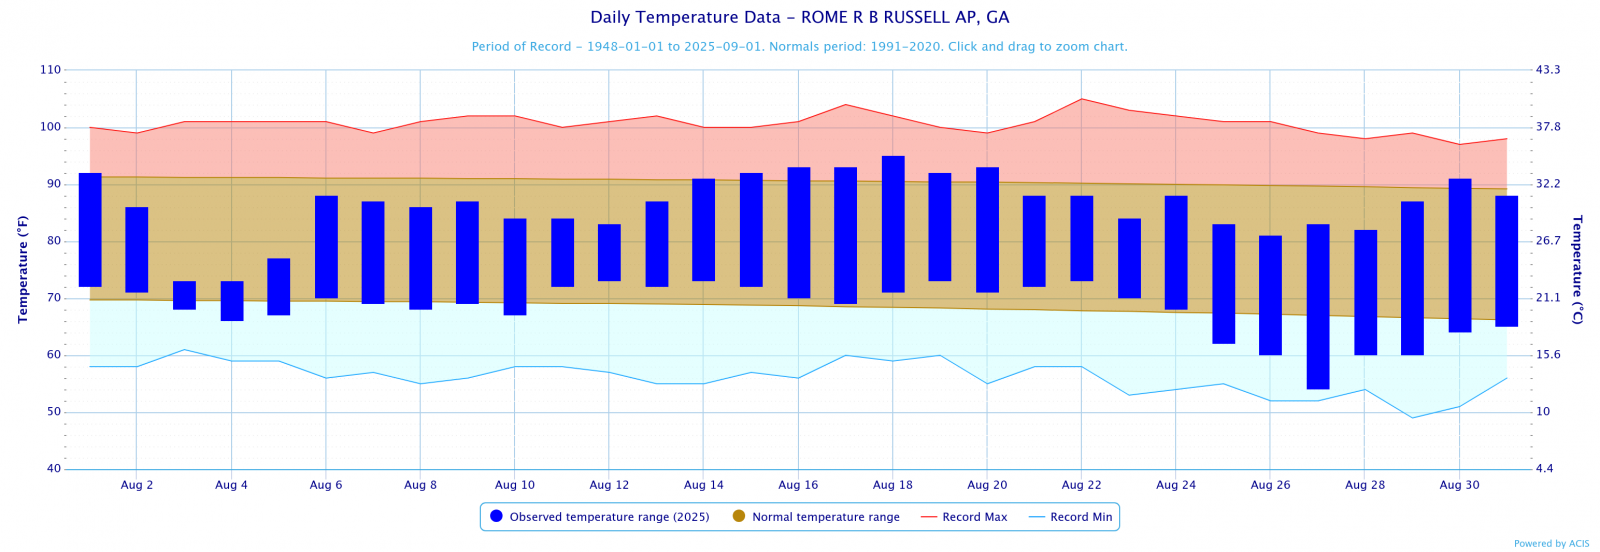
Rome
77.3
79.5
-2.2
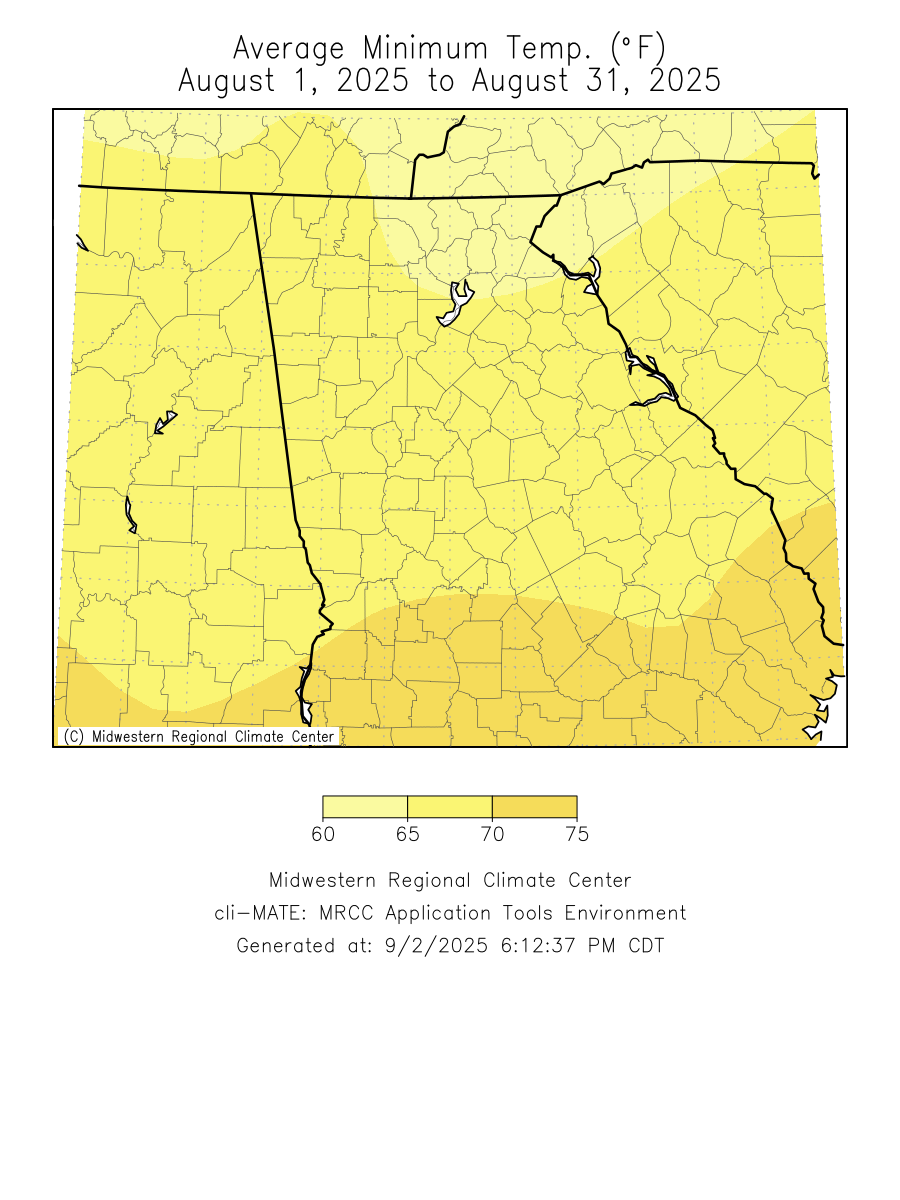
August 2025 Temperature Climate Statistics
Minimum Temperature
Min T Date
Athens
94
8/17, 18
55
8/23
Atlanta
95
8/15
60
8/27
Columbus
96
8/18
62
8/27
Macon
96
8/1
58
8/27
Dekalb Peachtree Arpt
95
8/15
54
8/27
Fulton Co Arpt
94
8/15
55
8/27
Gainesville
93
8/17
56
8/27
Peachtree City
93
8/1
55
8/27
Rome
95
8/18
54
8/27
August 2025 Precipitation Climate Statistics
Average Precipitation
From Normal)
Athens
10.31
4.55
5.76
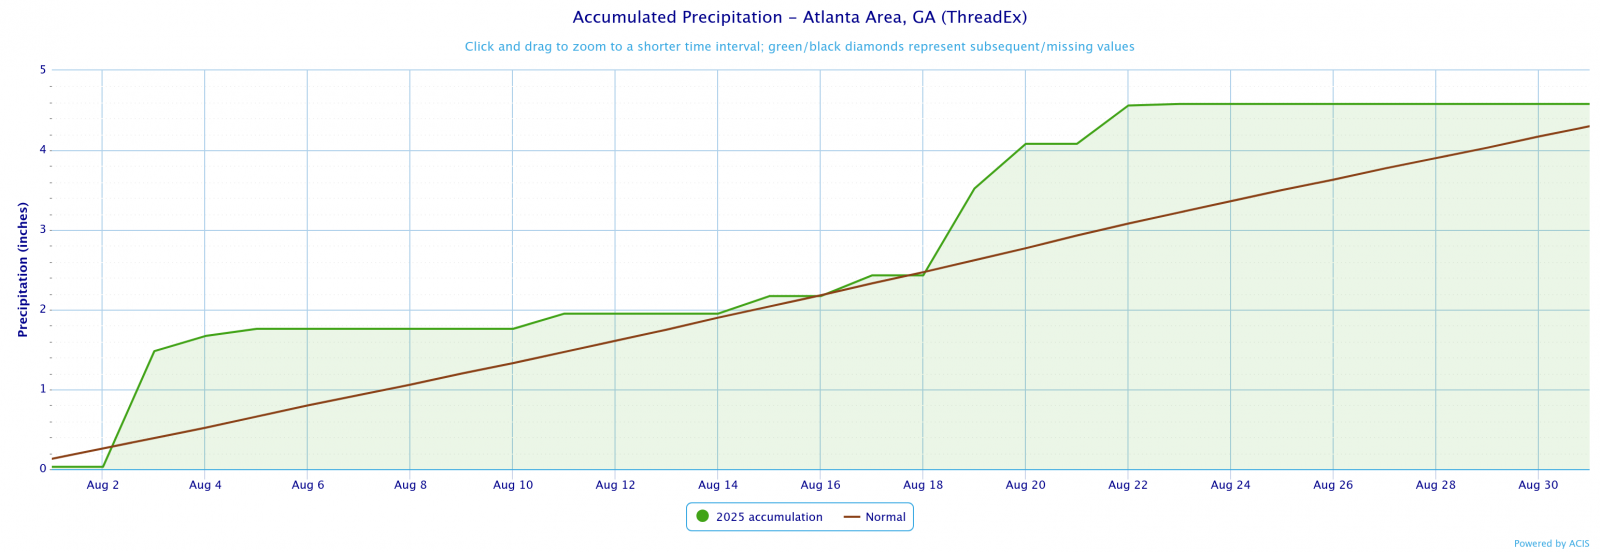
Atlanta
4.58
4.3
0.28
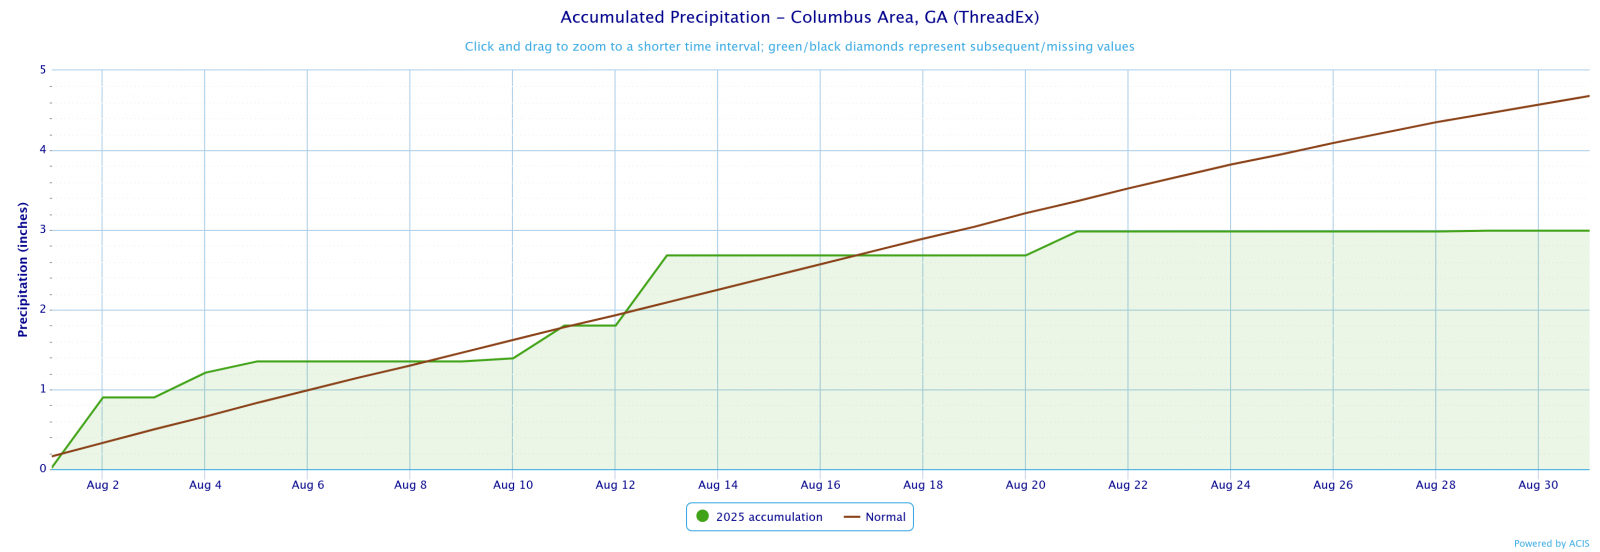
Columbus
2.99
4.68
-1.69
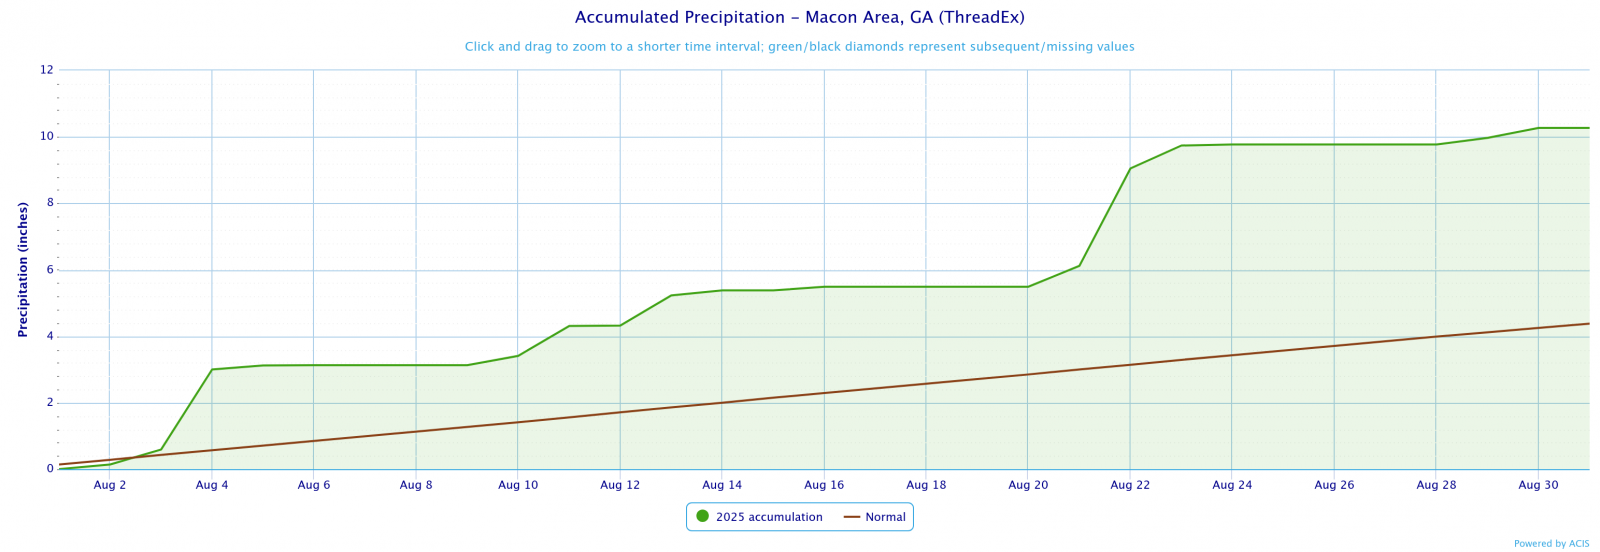
Macon
10.27
4.38
5.89
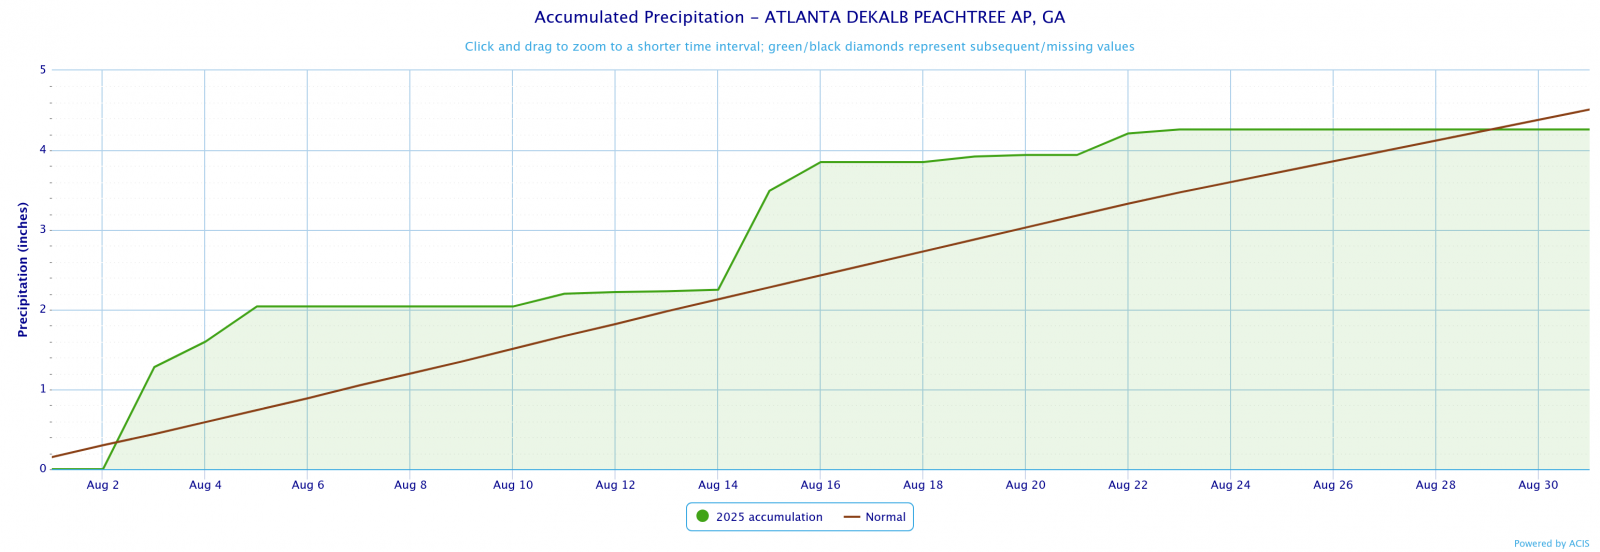
Dekalb Peachtree Arpt
4.26
4.51
-0.25
Fulton County Arpt
3.65
3.98
-0.33
Gainesville
2.81
4.73
-1.92
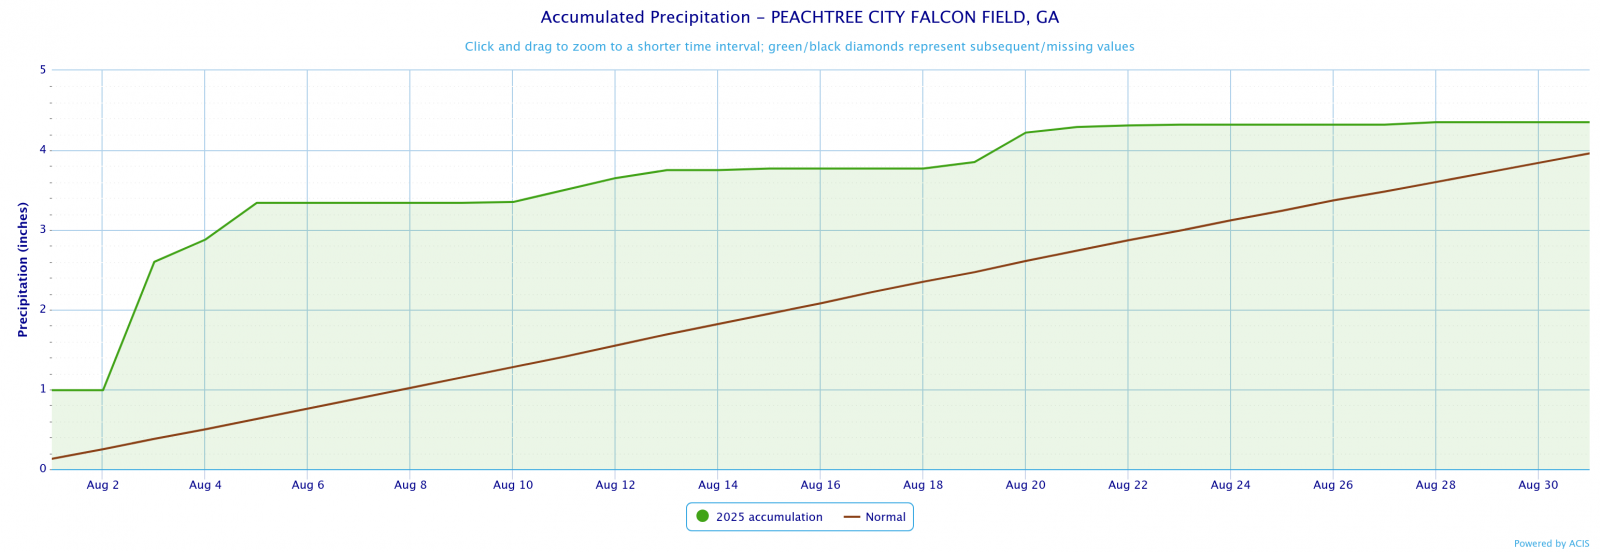
Peachtree City
4.35
3.96
0.39
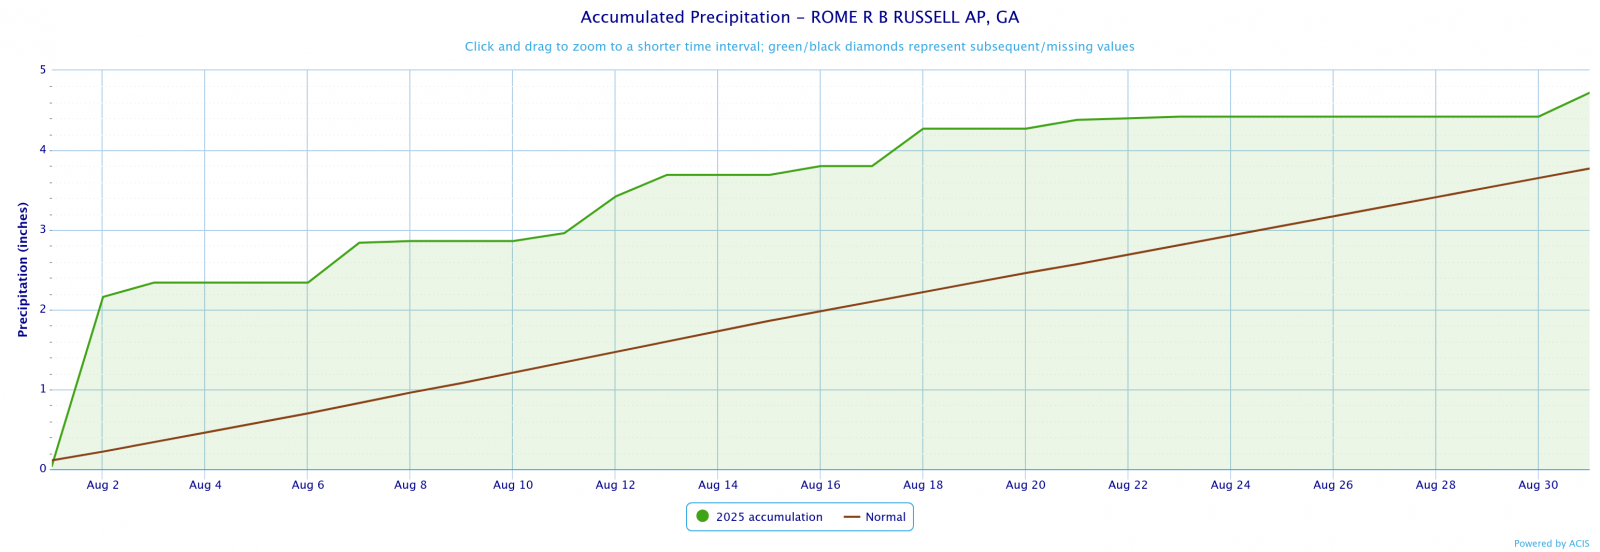
Rome
4.72
3.77
0.95
August 2025 Precipitation Climate Statistics
Athens
3.00
8/5
Atlanta
1.45
8/2
Columbus
0.88
8/1
Macon
3.62
8/22
Dekalb Peachtree Arpt
1.28
8/2
Fulton Co Arpt
2.31
8/2
Gainesville
0.75
8/4
Peachtree City
1.61
8/3
Rome
2.30
8/2
Click the links below to explore the temperature and precipitation data across north and central Georgia for the month of August 2025.
Temperature Maps
Precipitation Maps
Temperature Graphs
Precipitation Graphs


Temperature and precipitation records at our 4 main climate sites are located below.
August 2025 Climate Records
Date
Type
Location
Records set over a 24 hour period
8/27
Min Temp
Athens
A min temp of 56 occurred on 8/29 which tied the old record of 56 from 1919.
No significant weather outbreaks occurred across north and central Georgia this past August.
The September climate outlook is below.
September Outlook