North and Central Georgia
August 2019 Climate Summary
| Previous Month | Next Month |
For August, the majority of locations experienced temperatures around 0.5 to 3 degrees above average with varying precipitation.
|
August Monthly Top 10 Rankings |
|---|
|
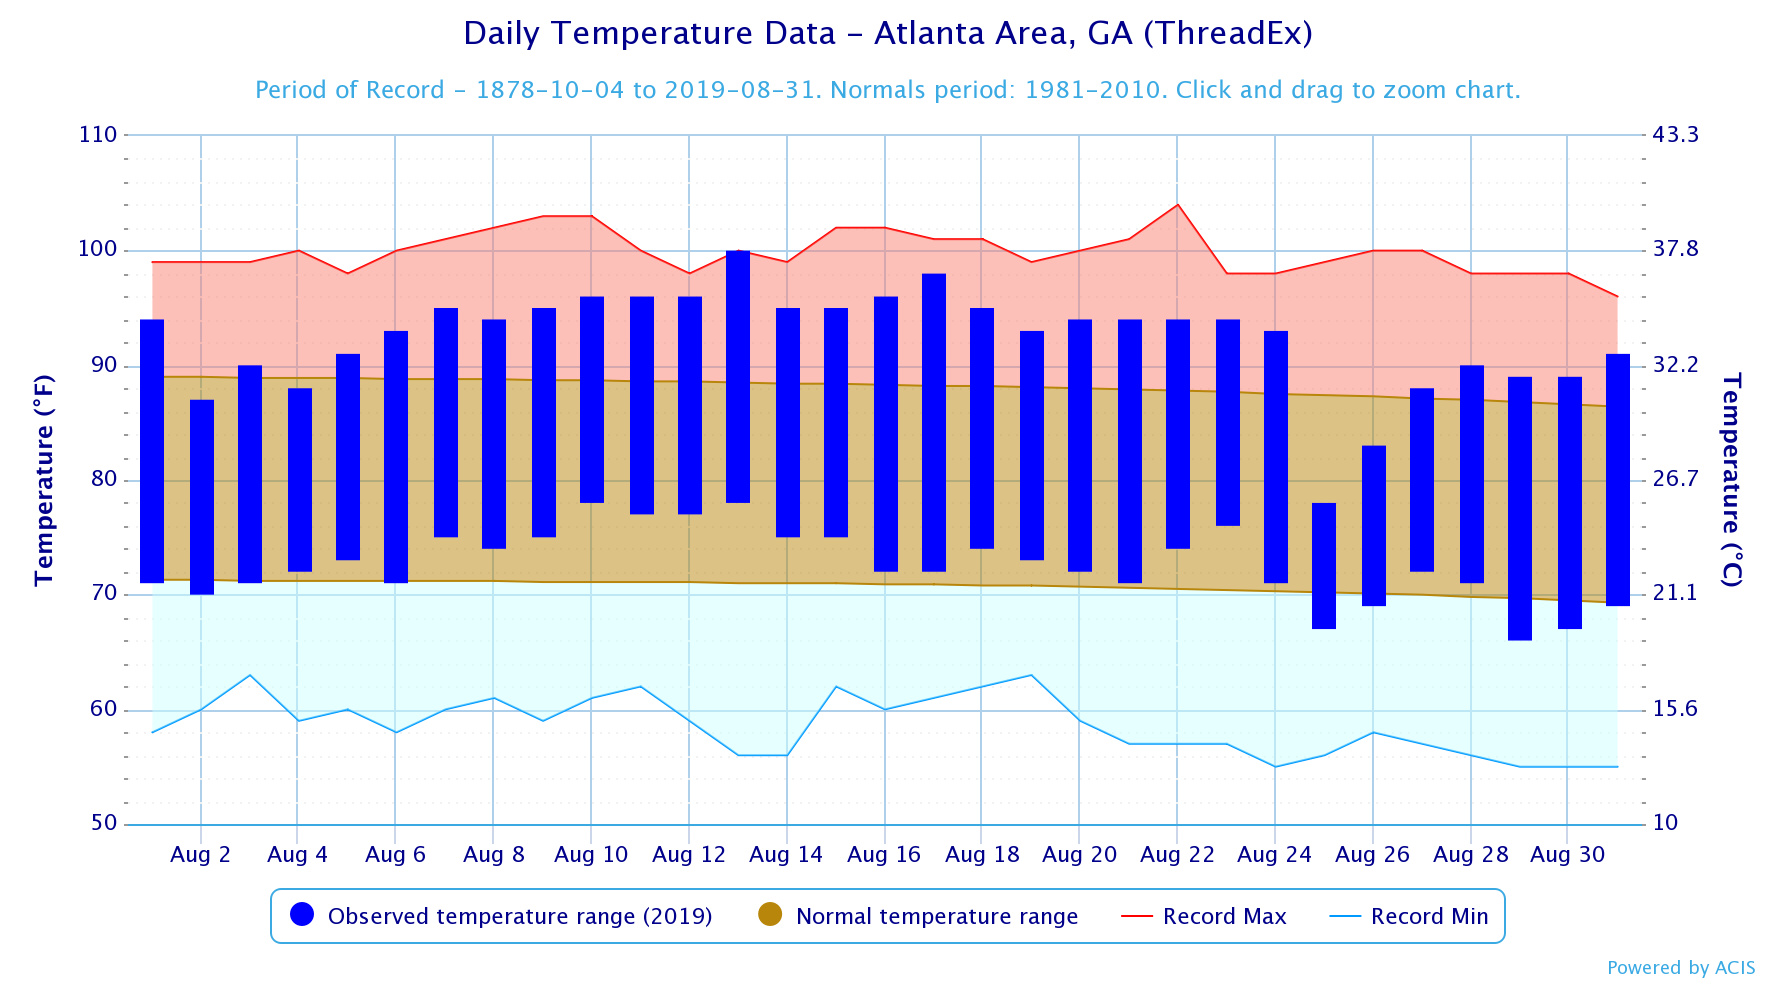
Atlanta 6th Warmest August on Record |
*Complete rankings in tables below
Temp. Extremes (ºF) for August
|
Site |
Warmest Temp. |
Coldest Temp. |
|
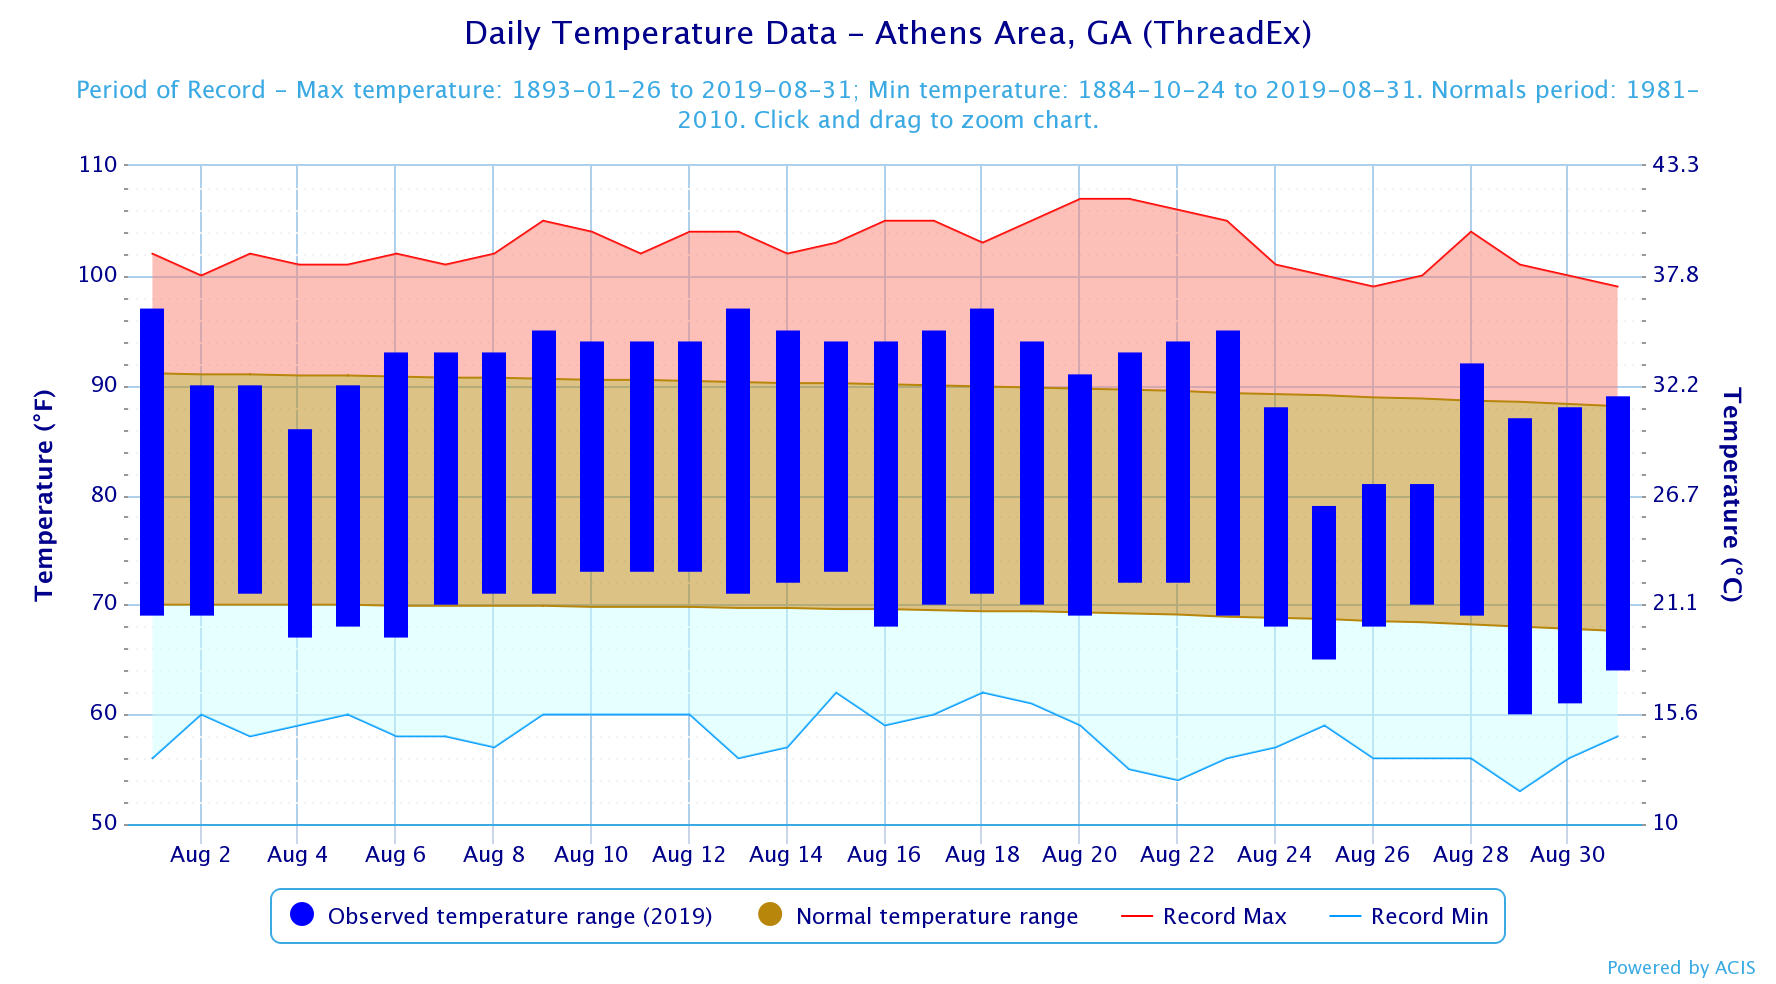
Athens |
97 (8/13,8/14,8/18) |
60 (8/29) |
|
Atlanta |
100* (8/13) |
66 (8/29) |
|
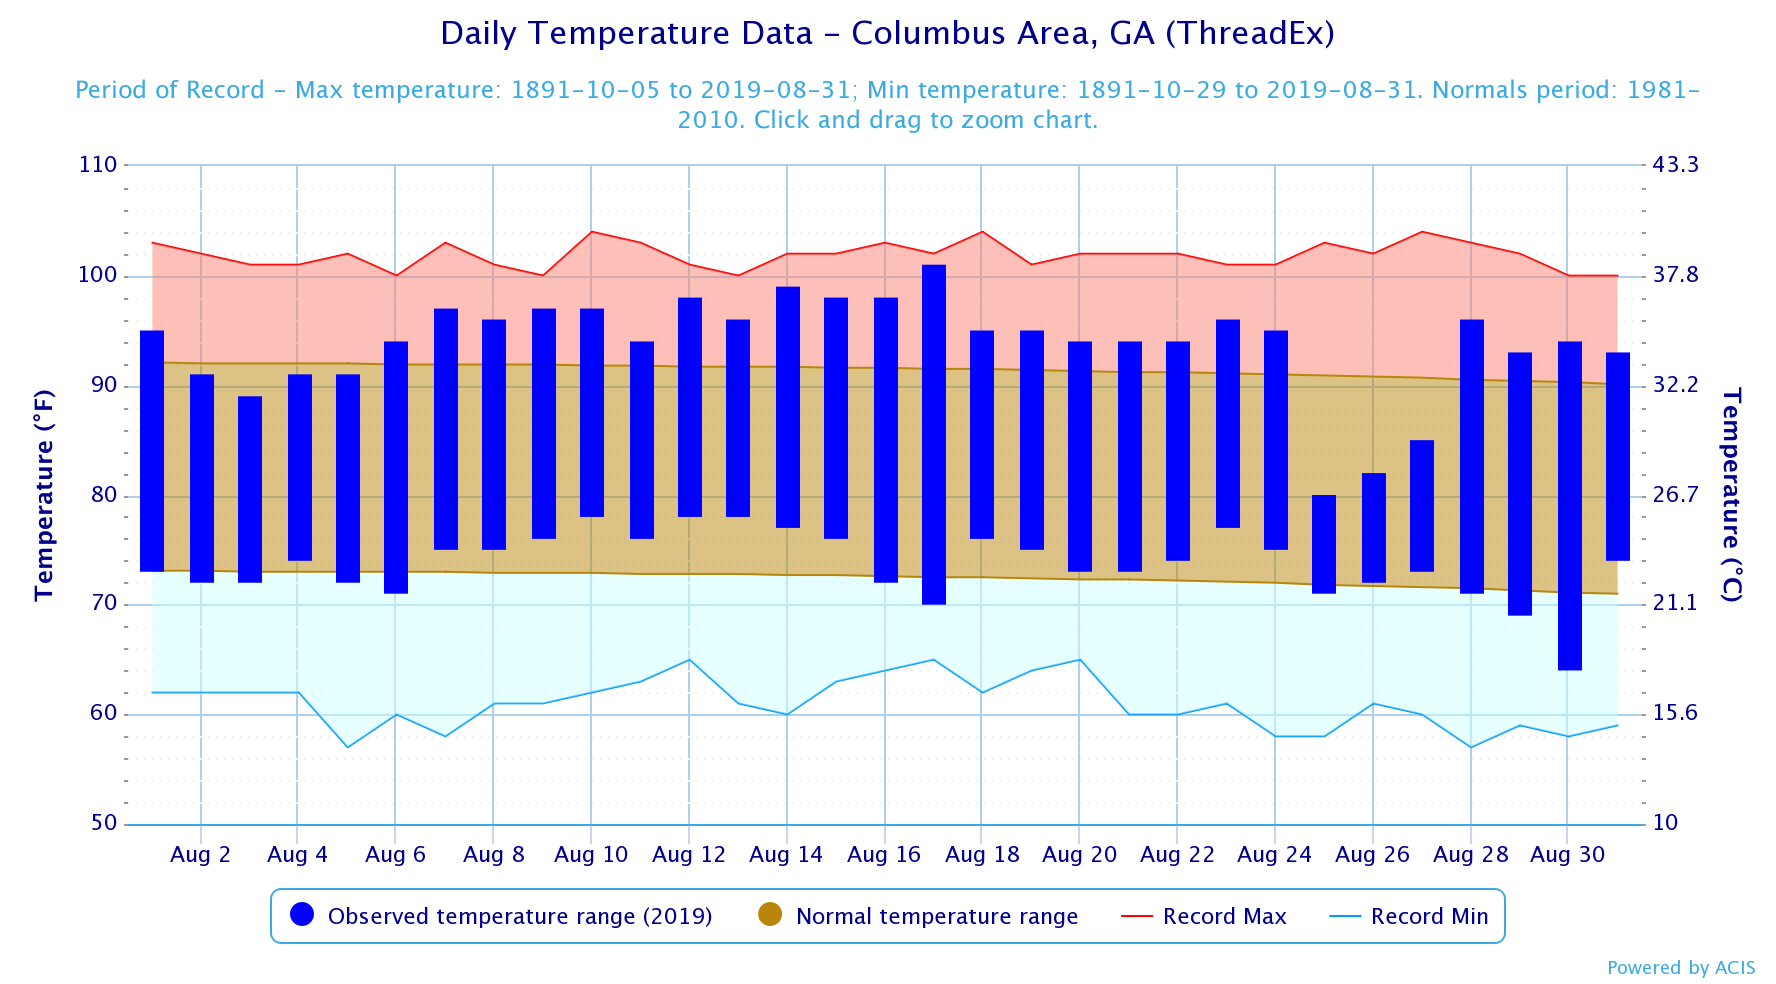
Columbus |
101 (8/17) |
64 (8/30) |
|
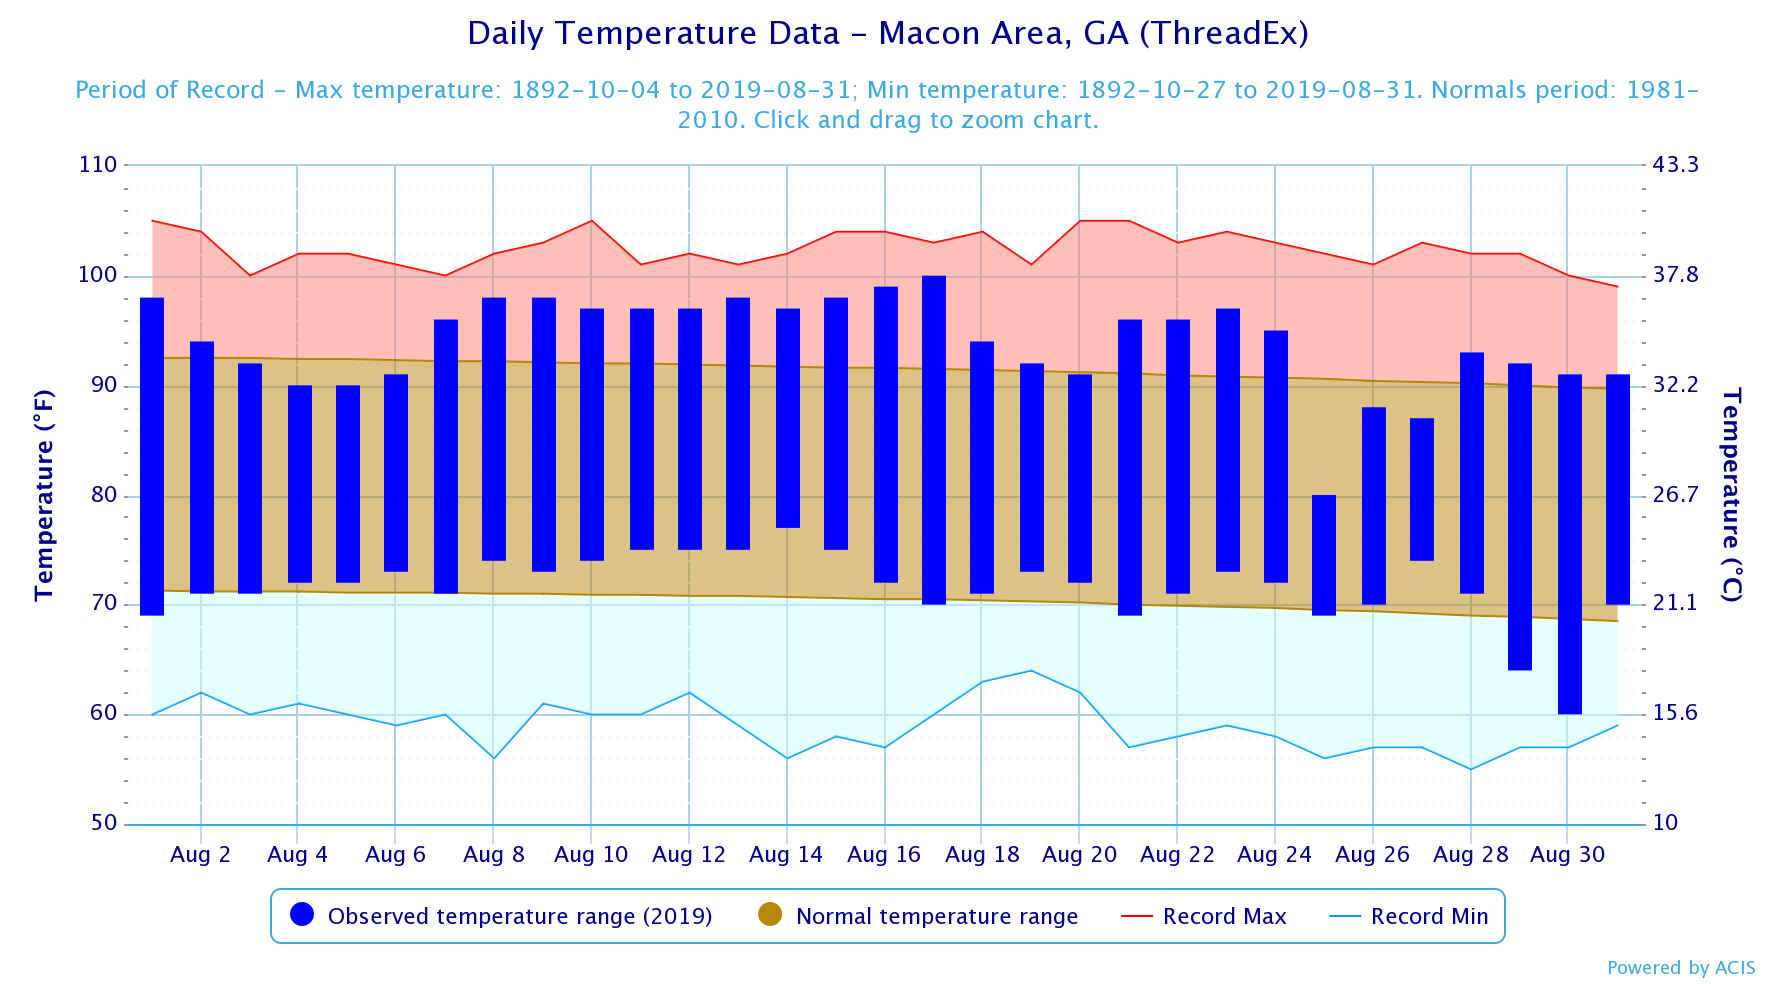
Macon |
100 (8/17) |
60 (8/30) |
|
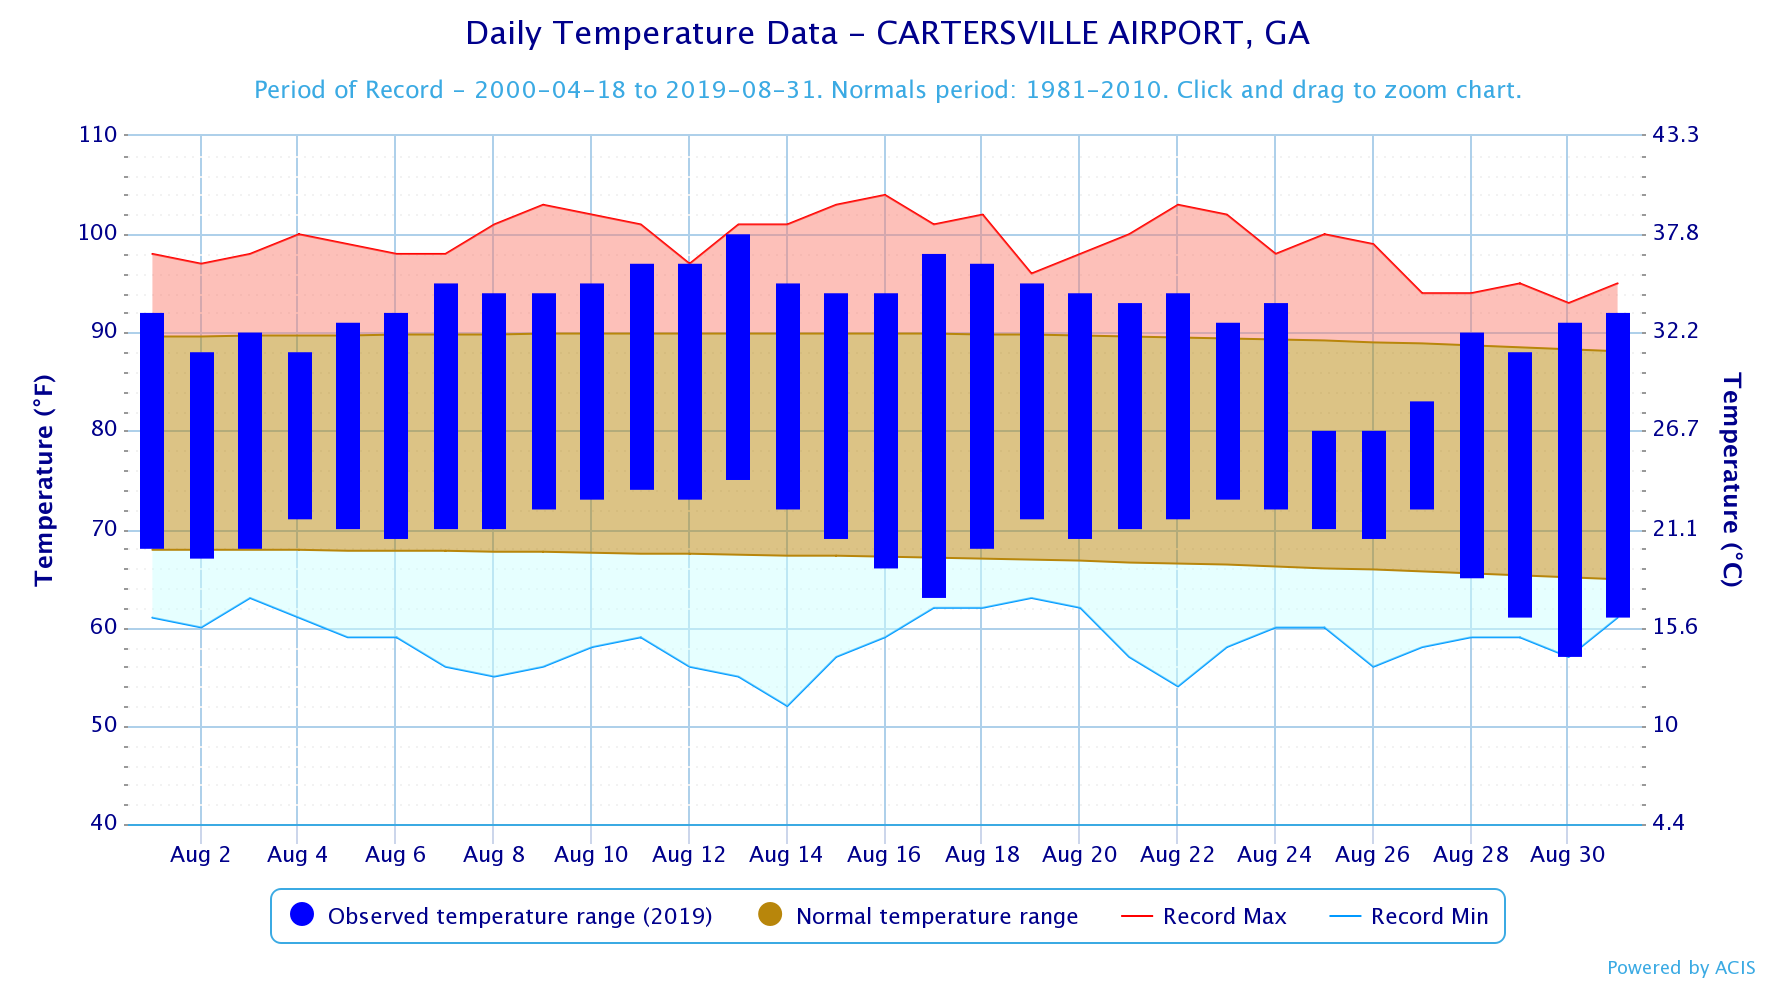
Cartersville |
100 (8/13) |
57 (8/30) |
|
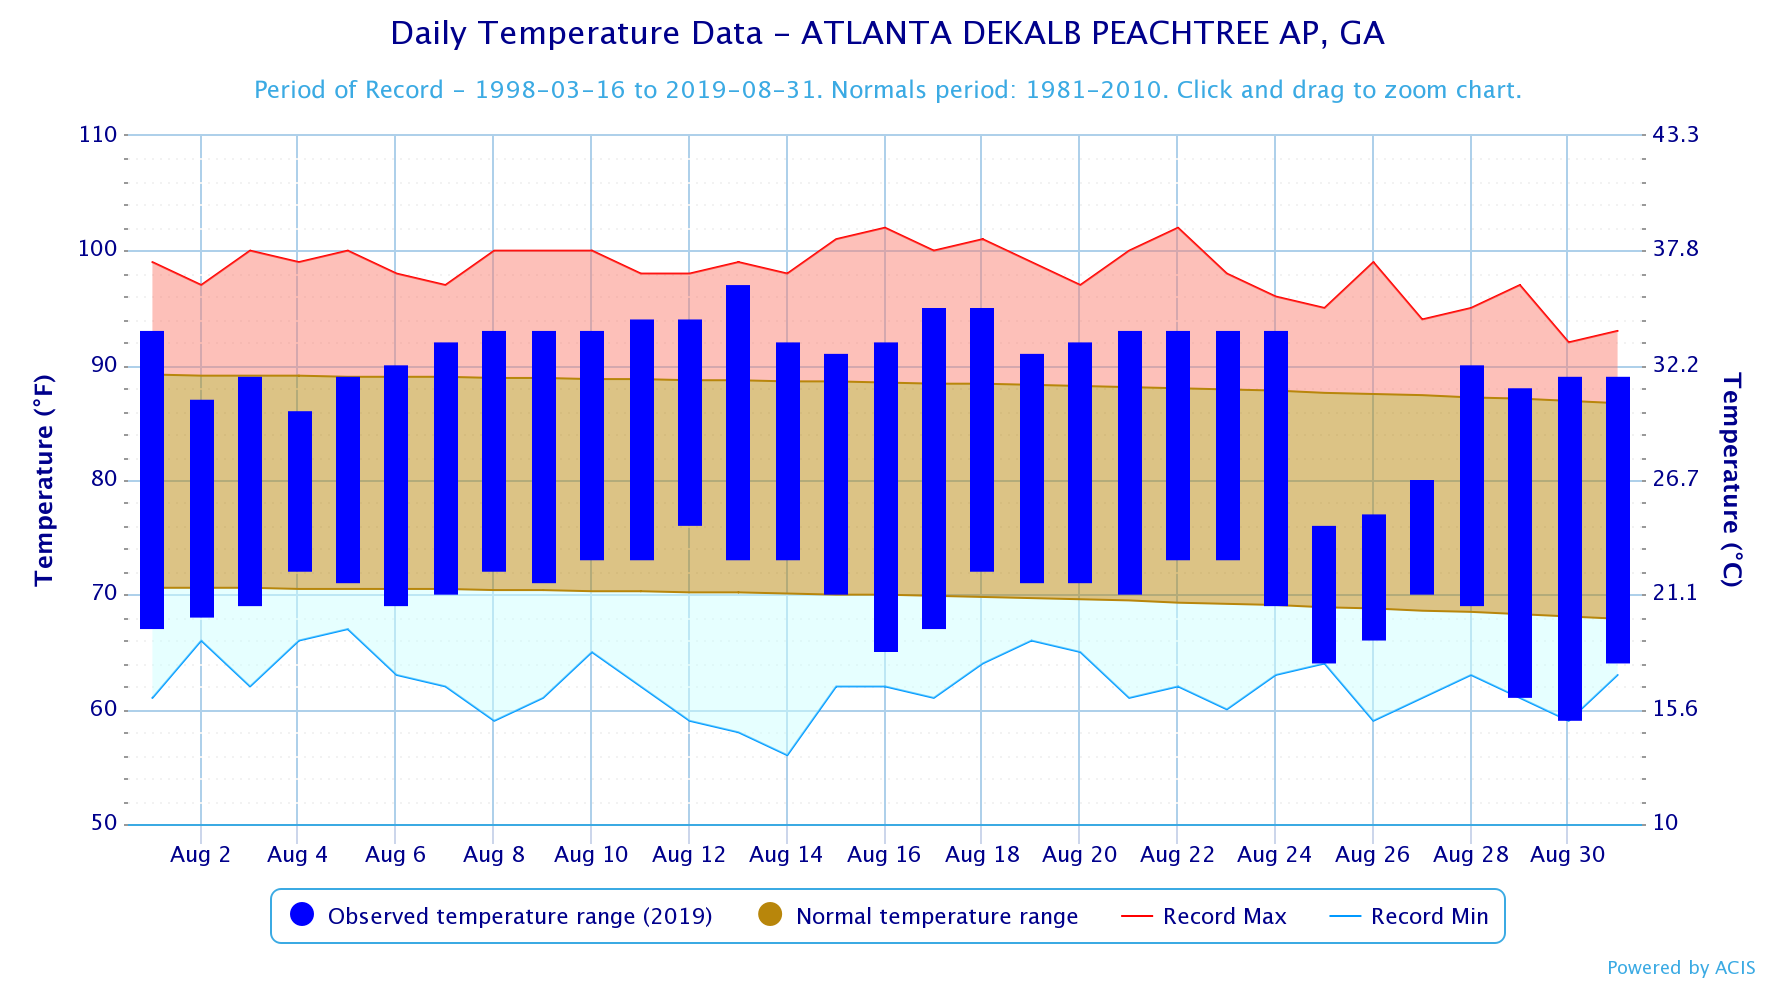
DeKalb Peachtree Arpt |
97 (8/13) |
59 (8/30) |
|
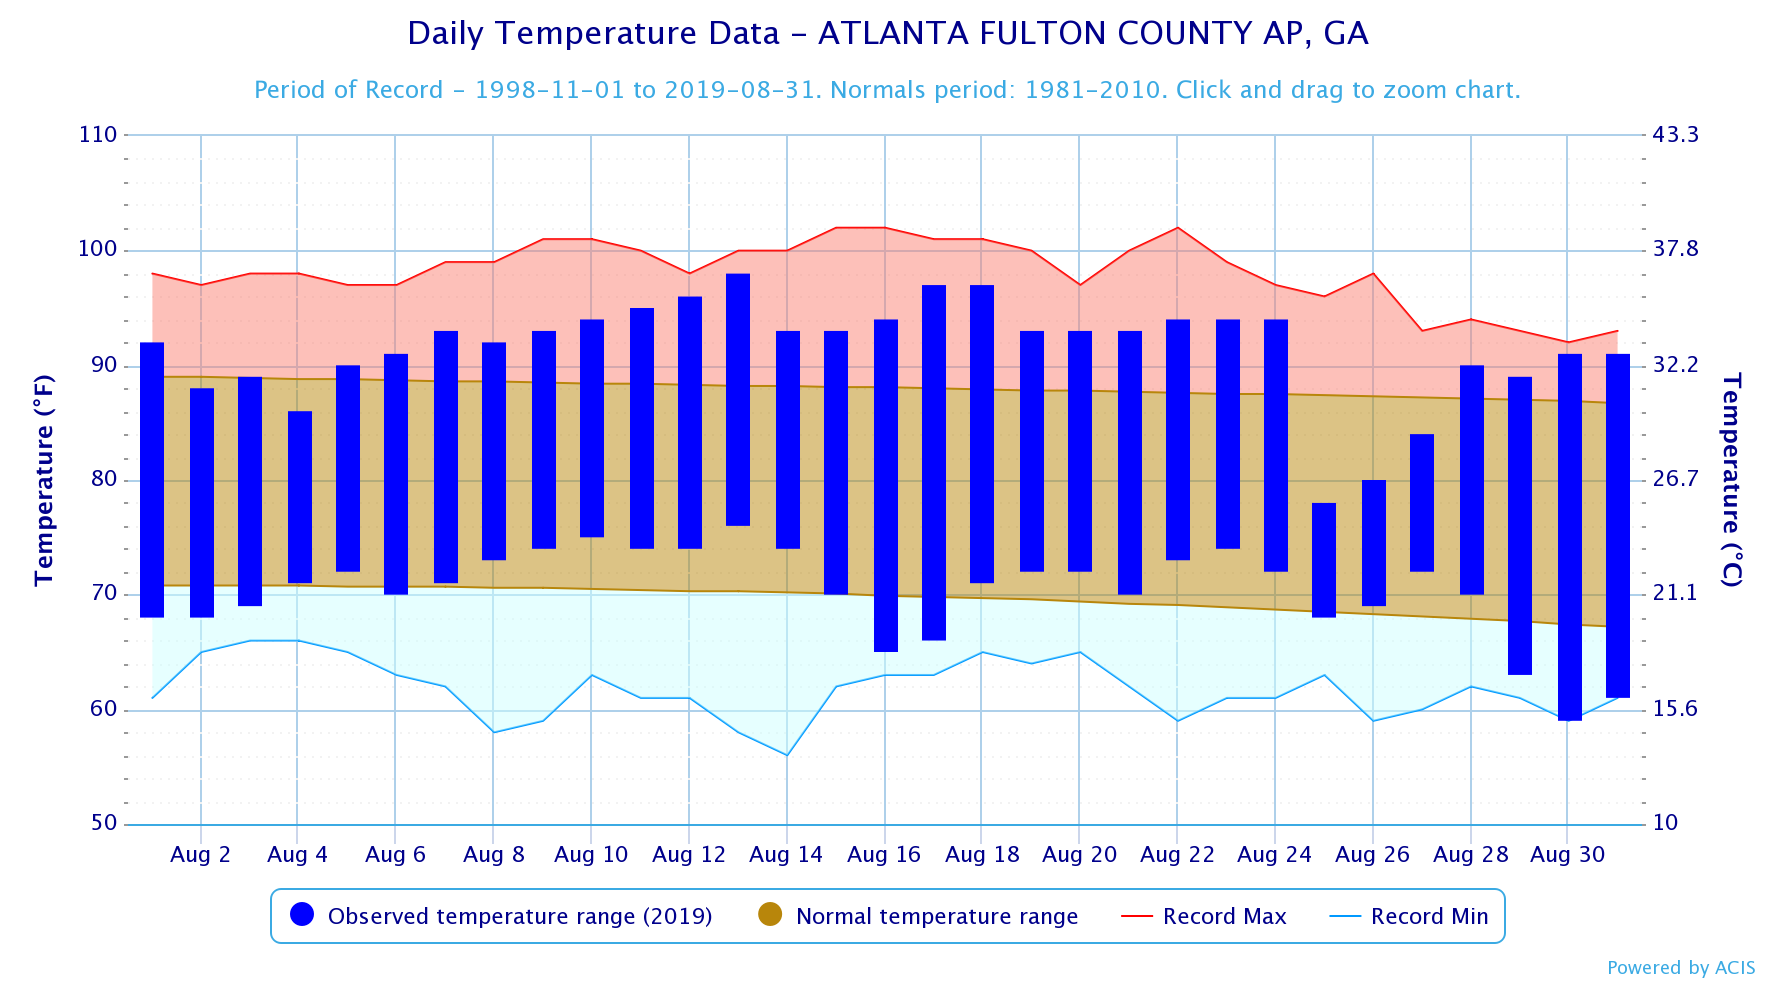
Fulton Co. Arpt |
98 (8/13) |
59 (8/30) |
|
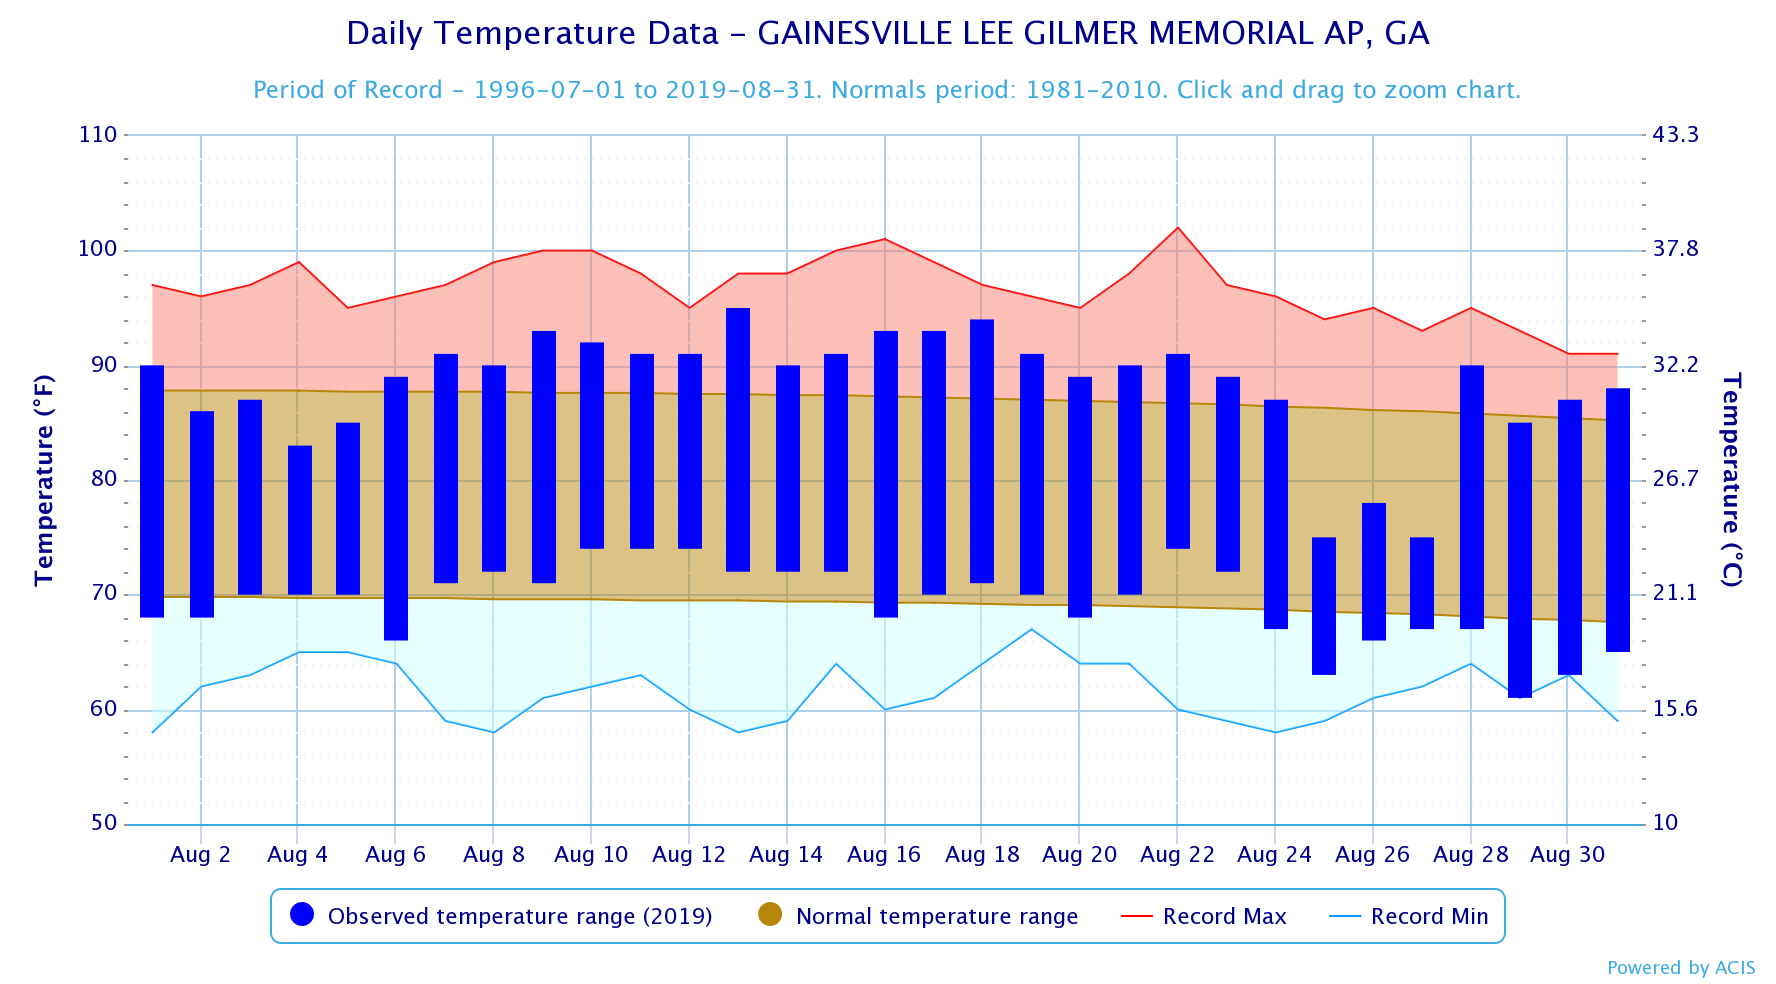
Gainesville |
95 (8/13) |
61(8/29) |
|
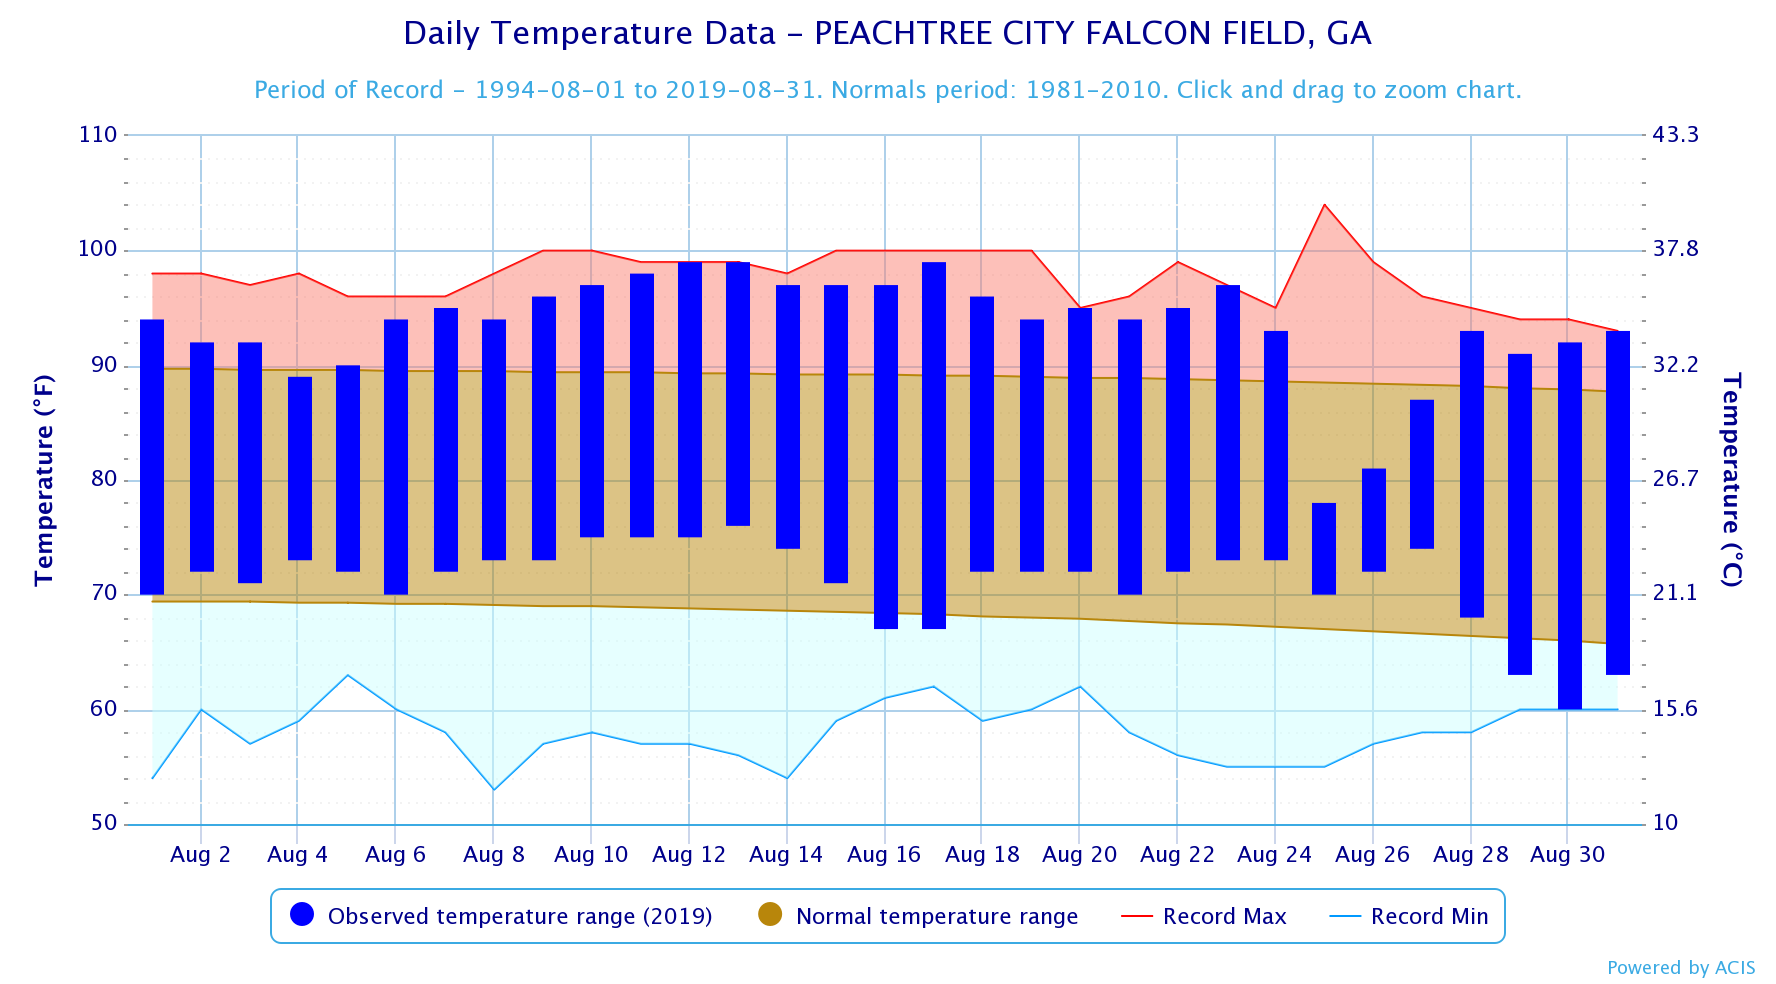
Peachtree City |
99 (8/12,8/13,8/17) |
60 (8/30) |
|
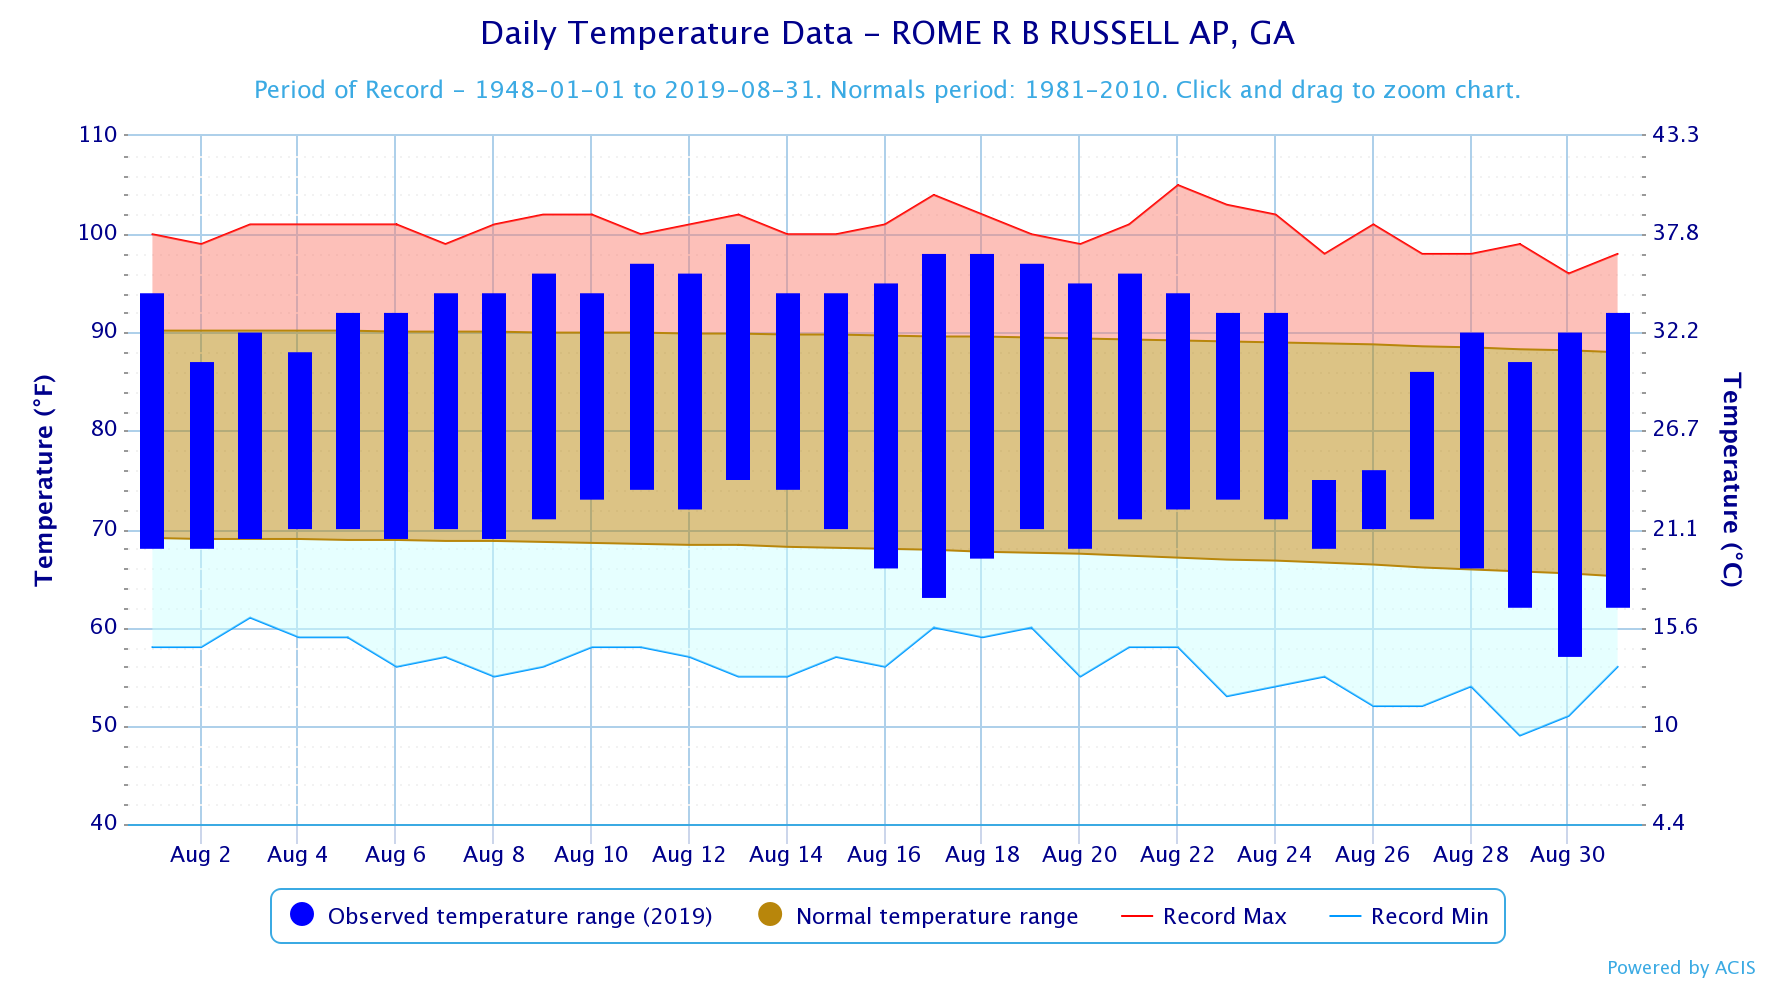
Rome |
99 (8/13) |
57 (8/30) |
* Set record for day
August Avg. Temperature (°F) and Rankings
* Click on site name below to view a graph with additional data
|
Site |
Avg. Temp. and Current Ranking |
Normal |
Dep. from Normal |
Record |
|
80.3 (26th Warmest) |
79.6 |
+0.7 |
85.2 (2007) |
|
|
82.5 (6th Warmest) |
76.4 |
+3.1 |
85.6 (2007) |
|
|
83.7 (11th Warmest) |
81.9 |
+1.8 |
85.5 (2011) |
|
|
82.8 (13th Warmest) |
80.9 |
+1.9 |
84.6 (2007, 1980, 1954) |
|
|
80.5 |
78.2 |
+2.3 |
|
|
|
79.8 |
79.0 |
+0.8 |
|
|
|
80.8 |
78.8 |
+2.0 |
|
|
|
78.8 |
78.1 |
+0.7 |
|
|
|
82.2 |
78.6 |
+3.6 |
|
|
|
80.5 |
78.6 |
+1.9 |
|
Precip. Extremes (in) for August
|
Site |
Highest Daily Amount |
|
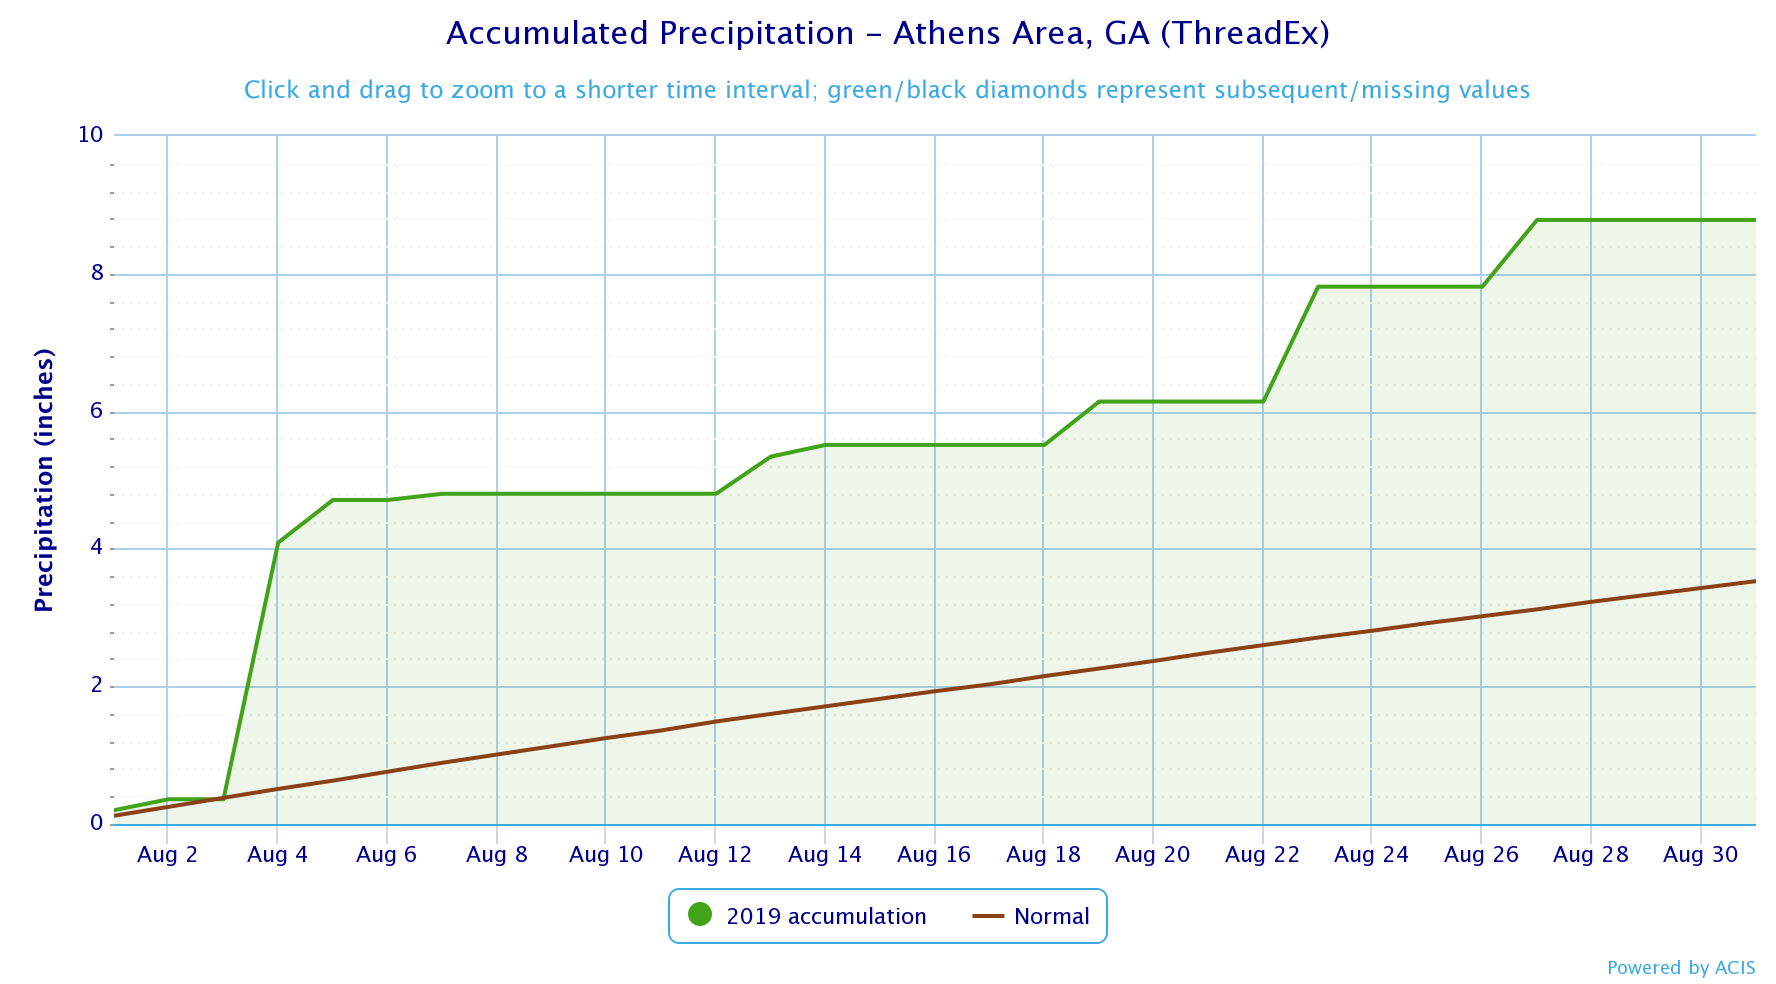
Athens |
3.73 (8/4) |
|
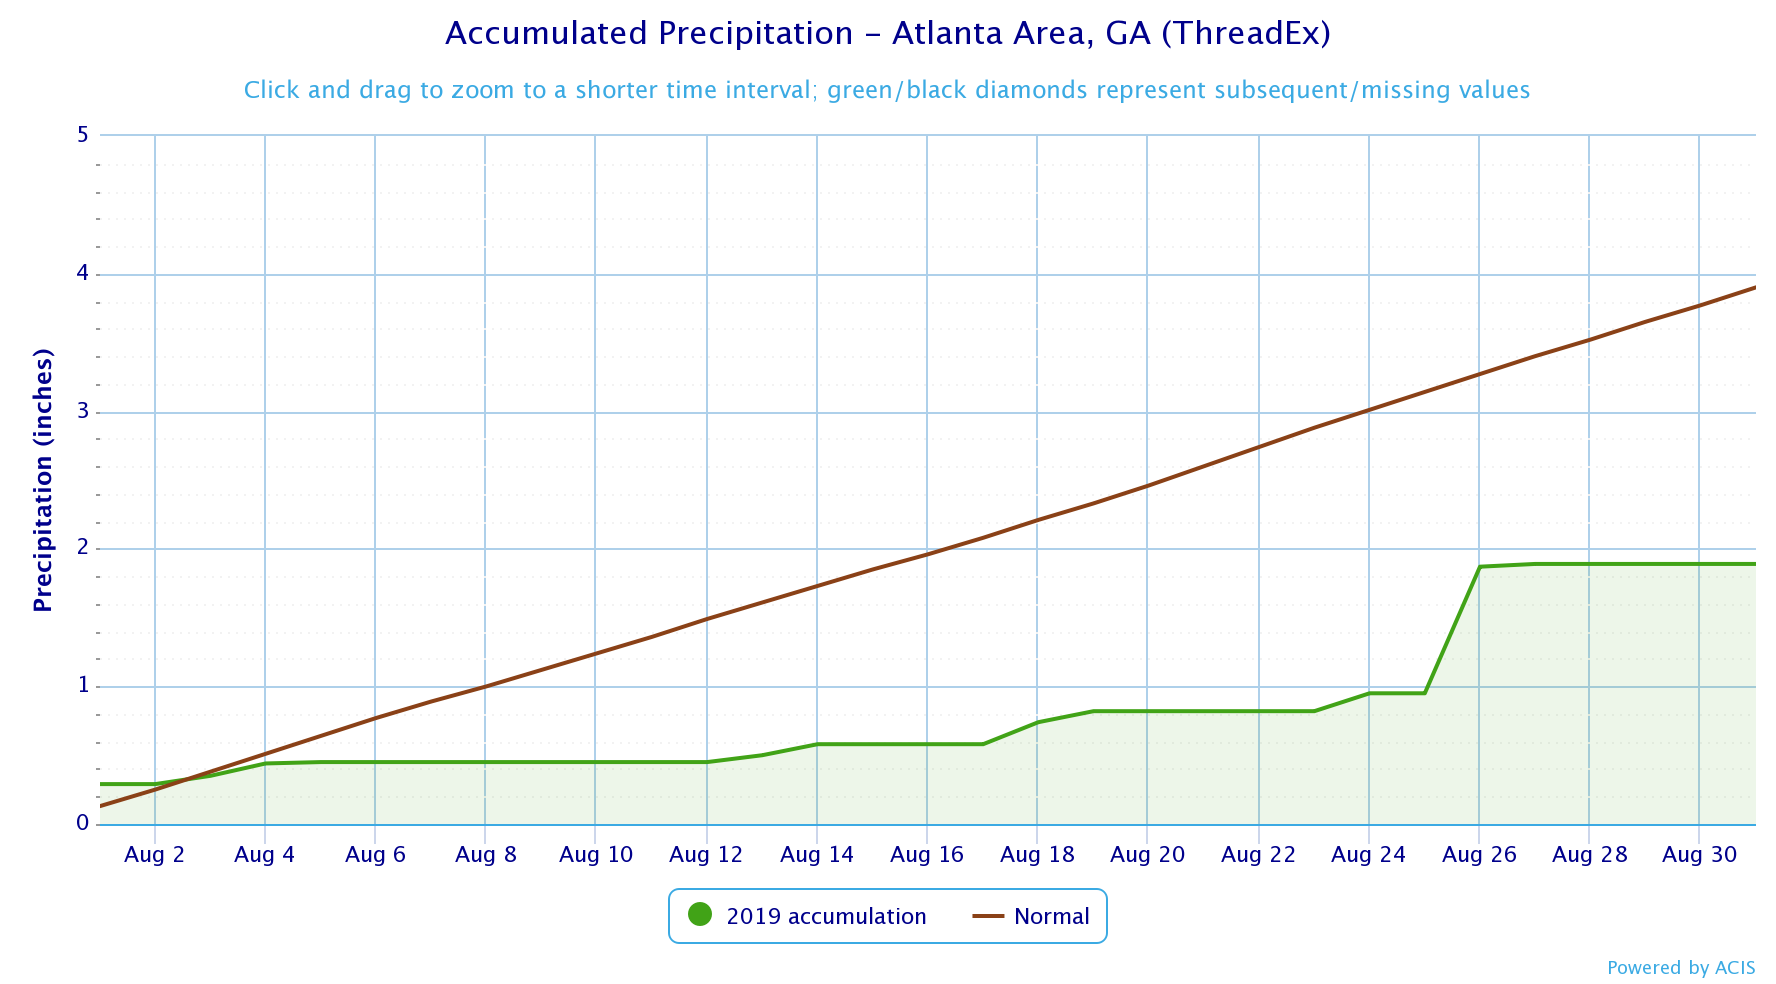
Atlanta |
0.92 (8/26) |
|
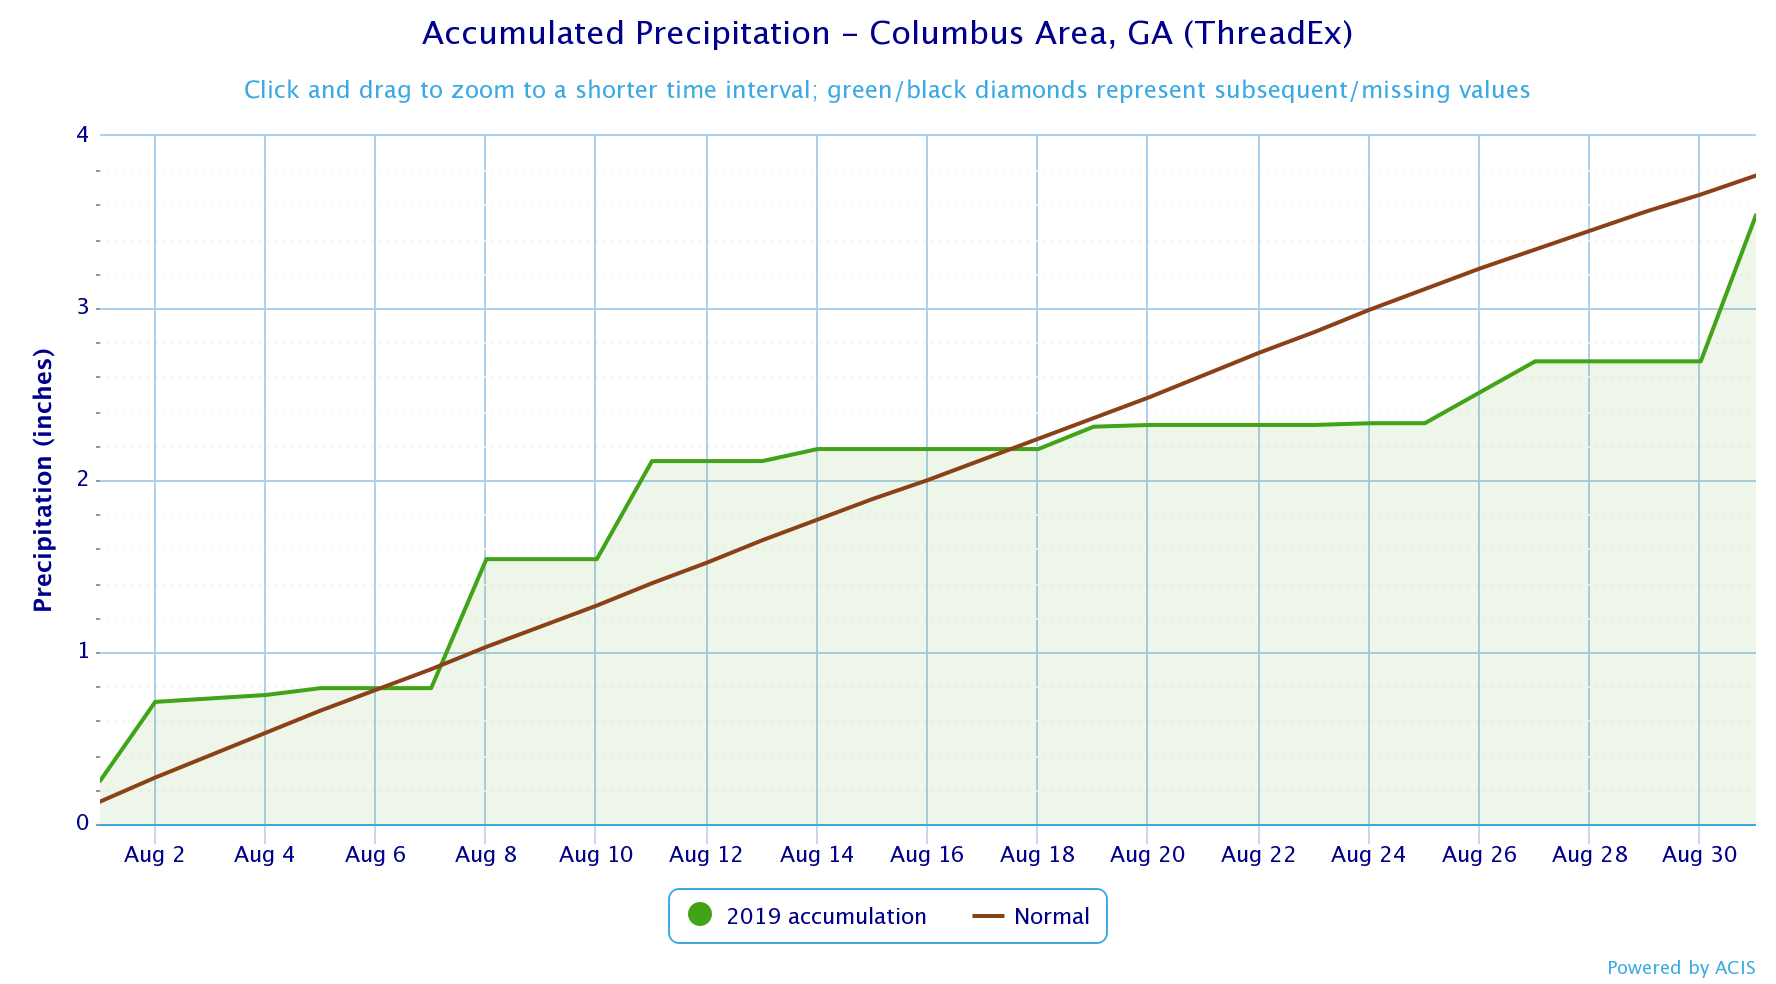
Columbus |
0.85 (8/31) |
|
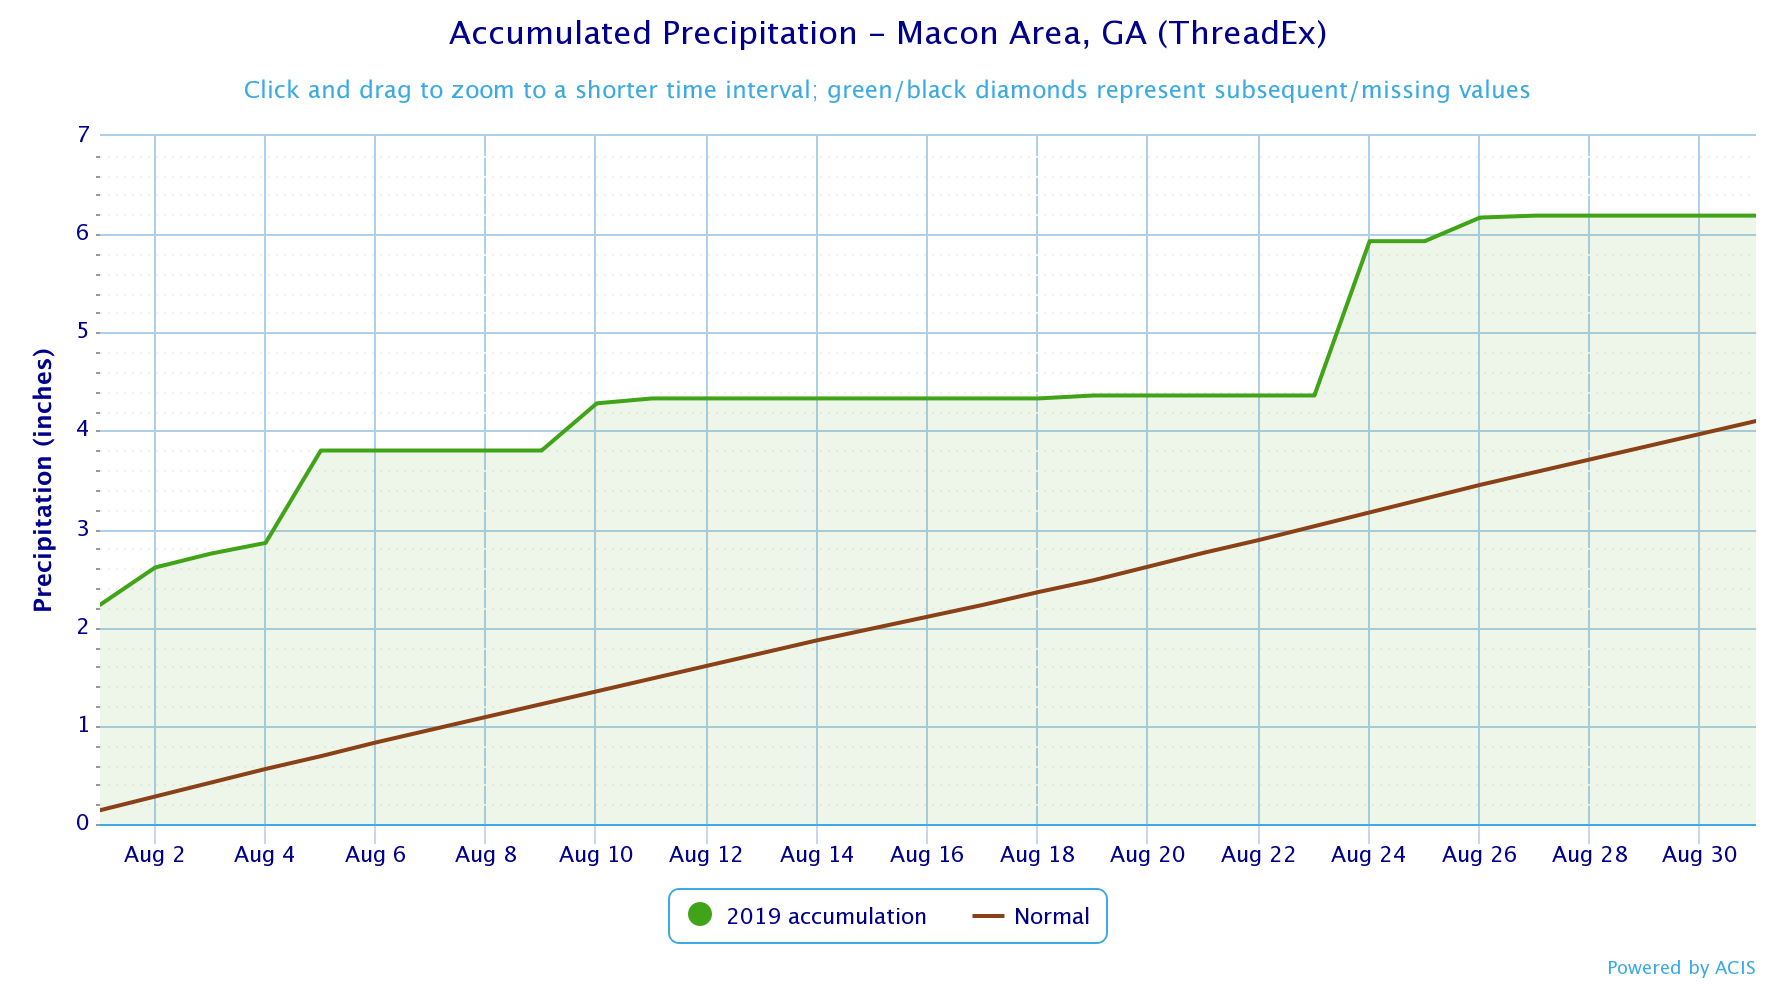
Macon |
2.23 (8/1) |
|
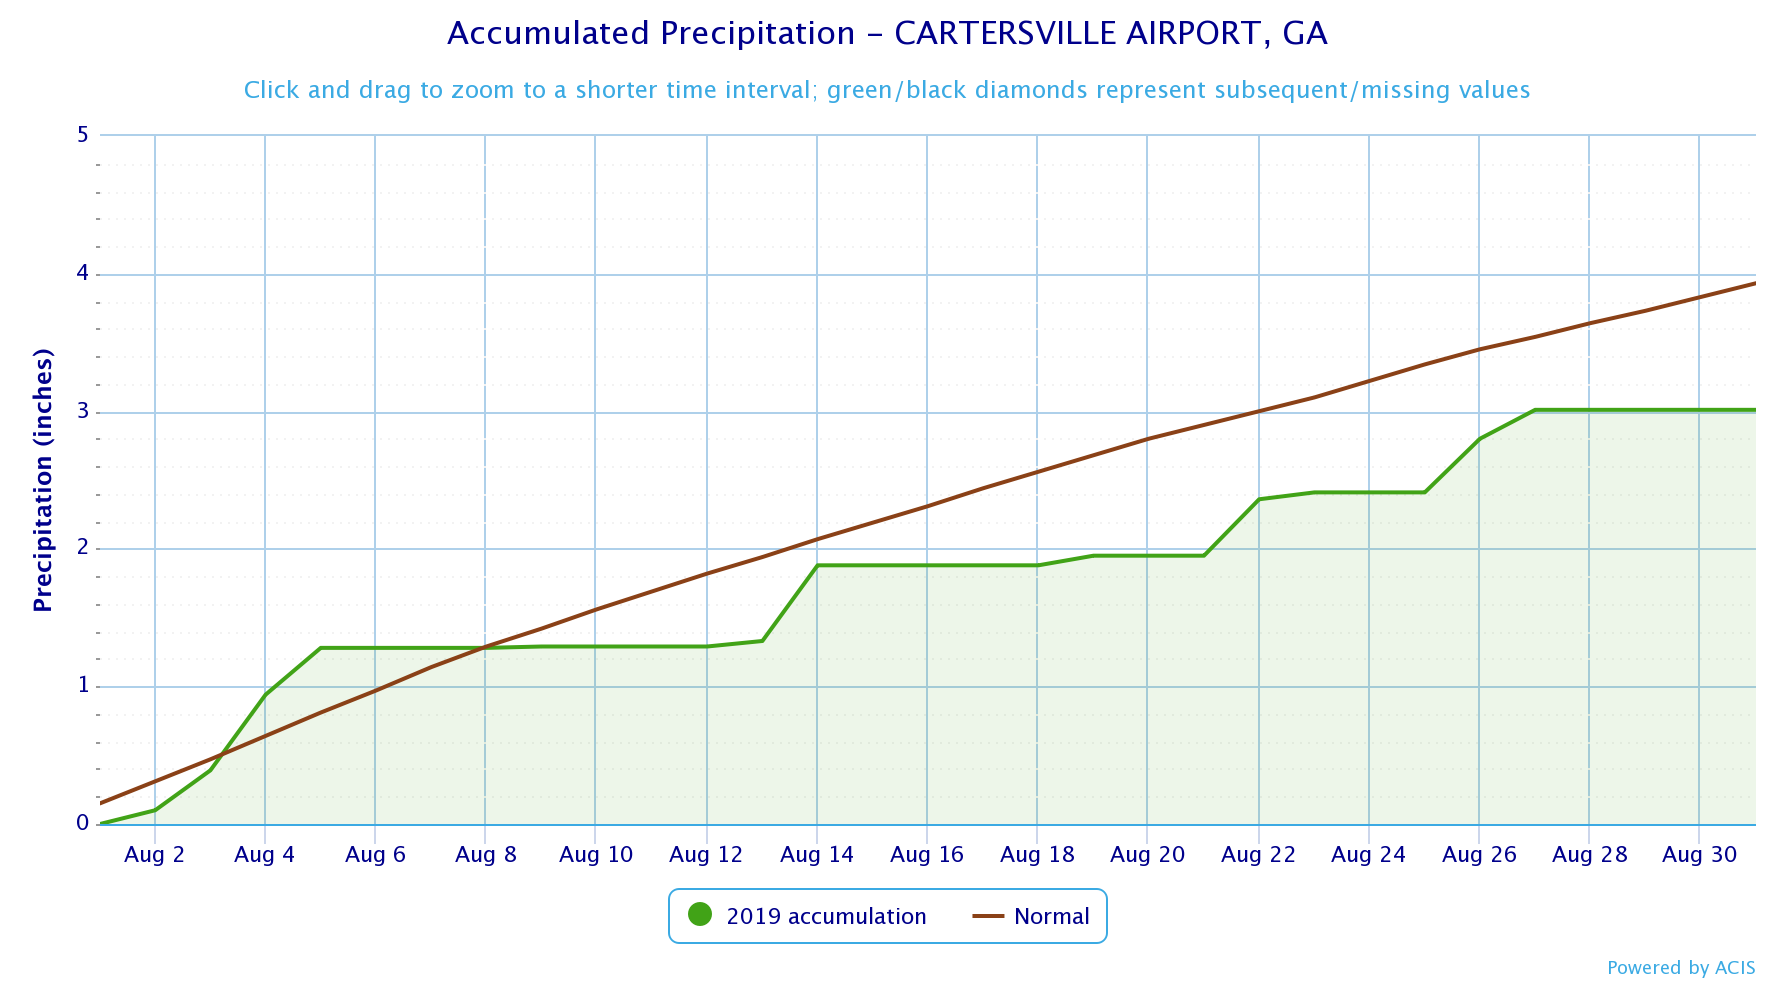
Cartersville |
0.55 (8/4,8/14) |
|
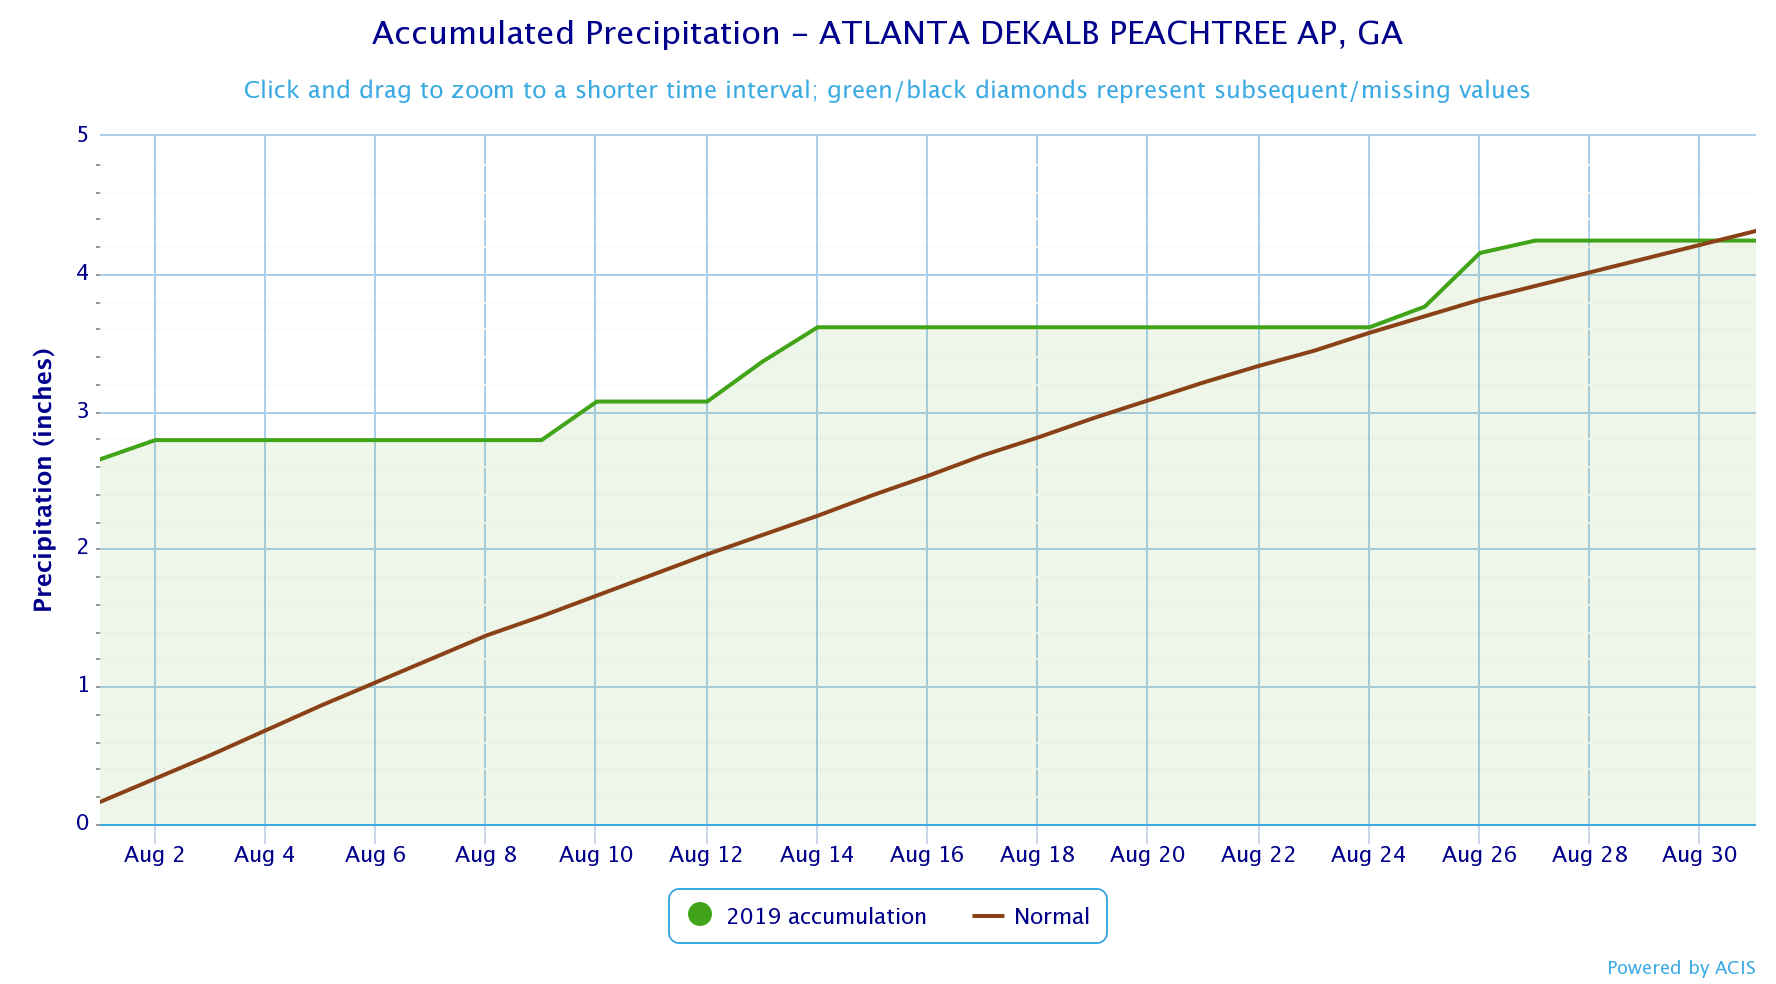
DeKalb Peachtree Arpt |
2.65 (8/1) |
|
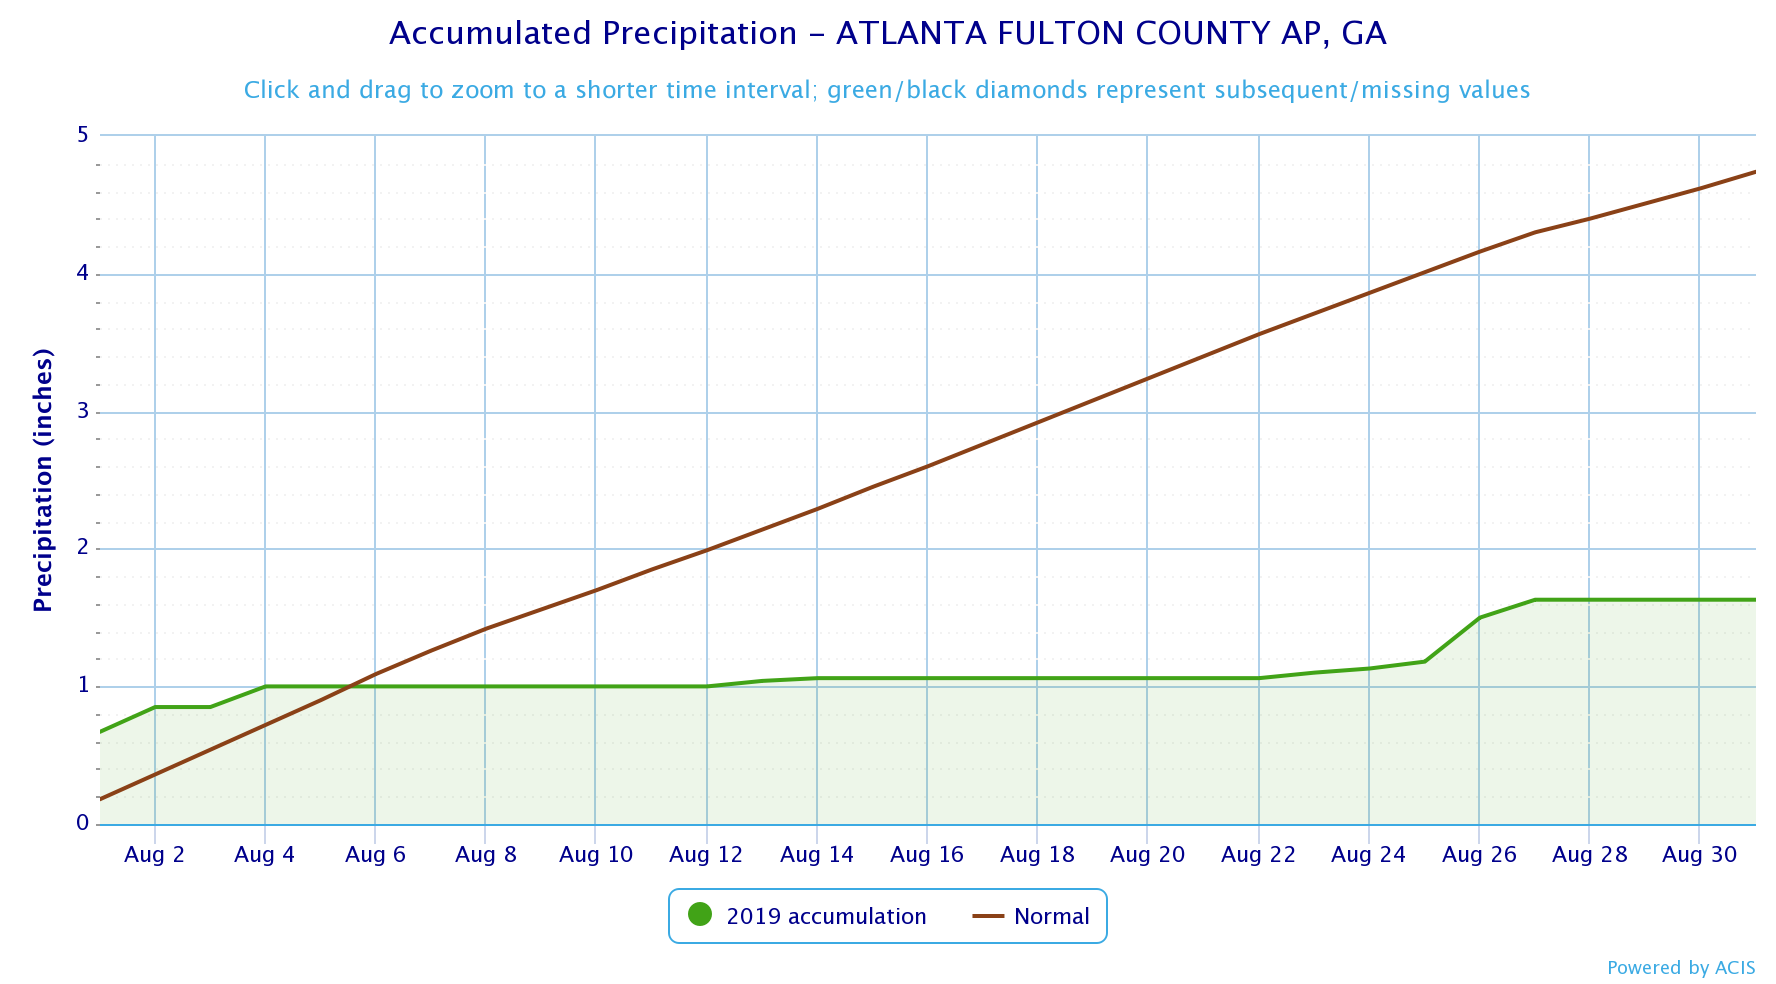
Fulton Co. Arpt |
0.67 (8/1) |
|
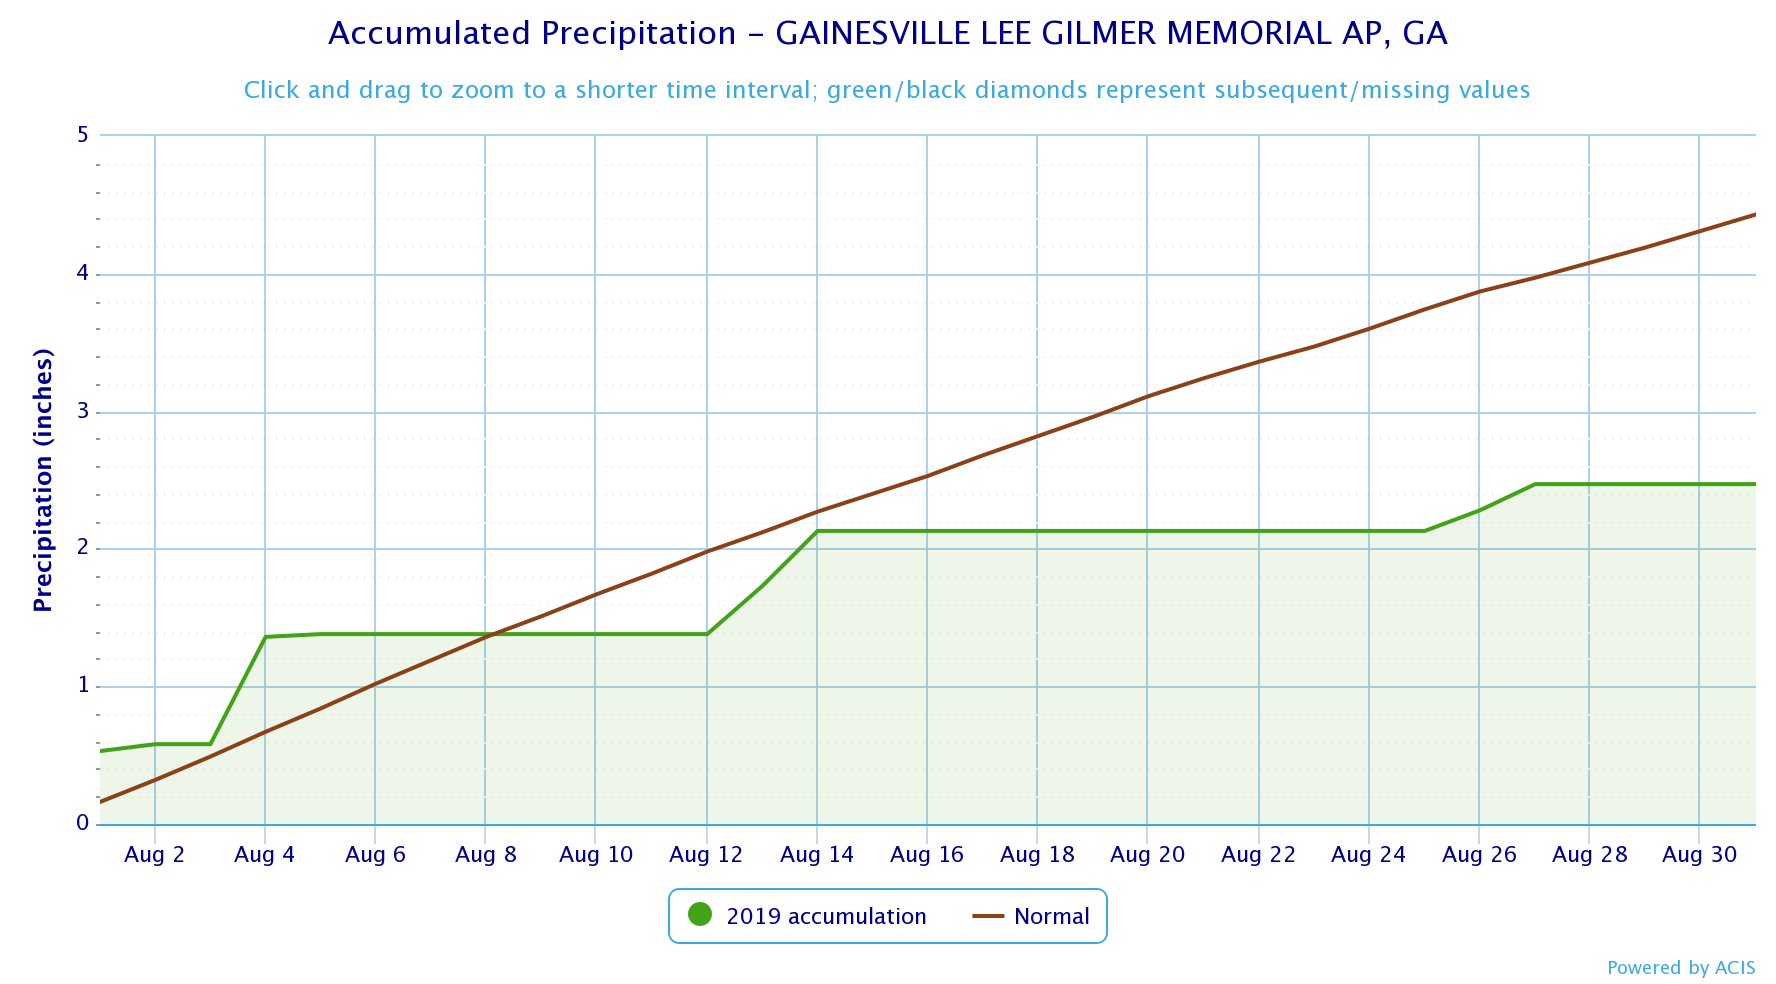
Gainesville |
0.78 (8/4) |
|
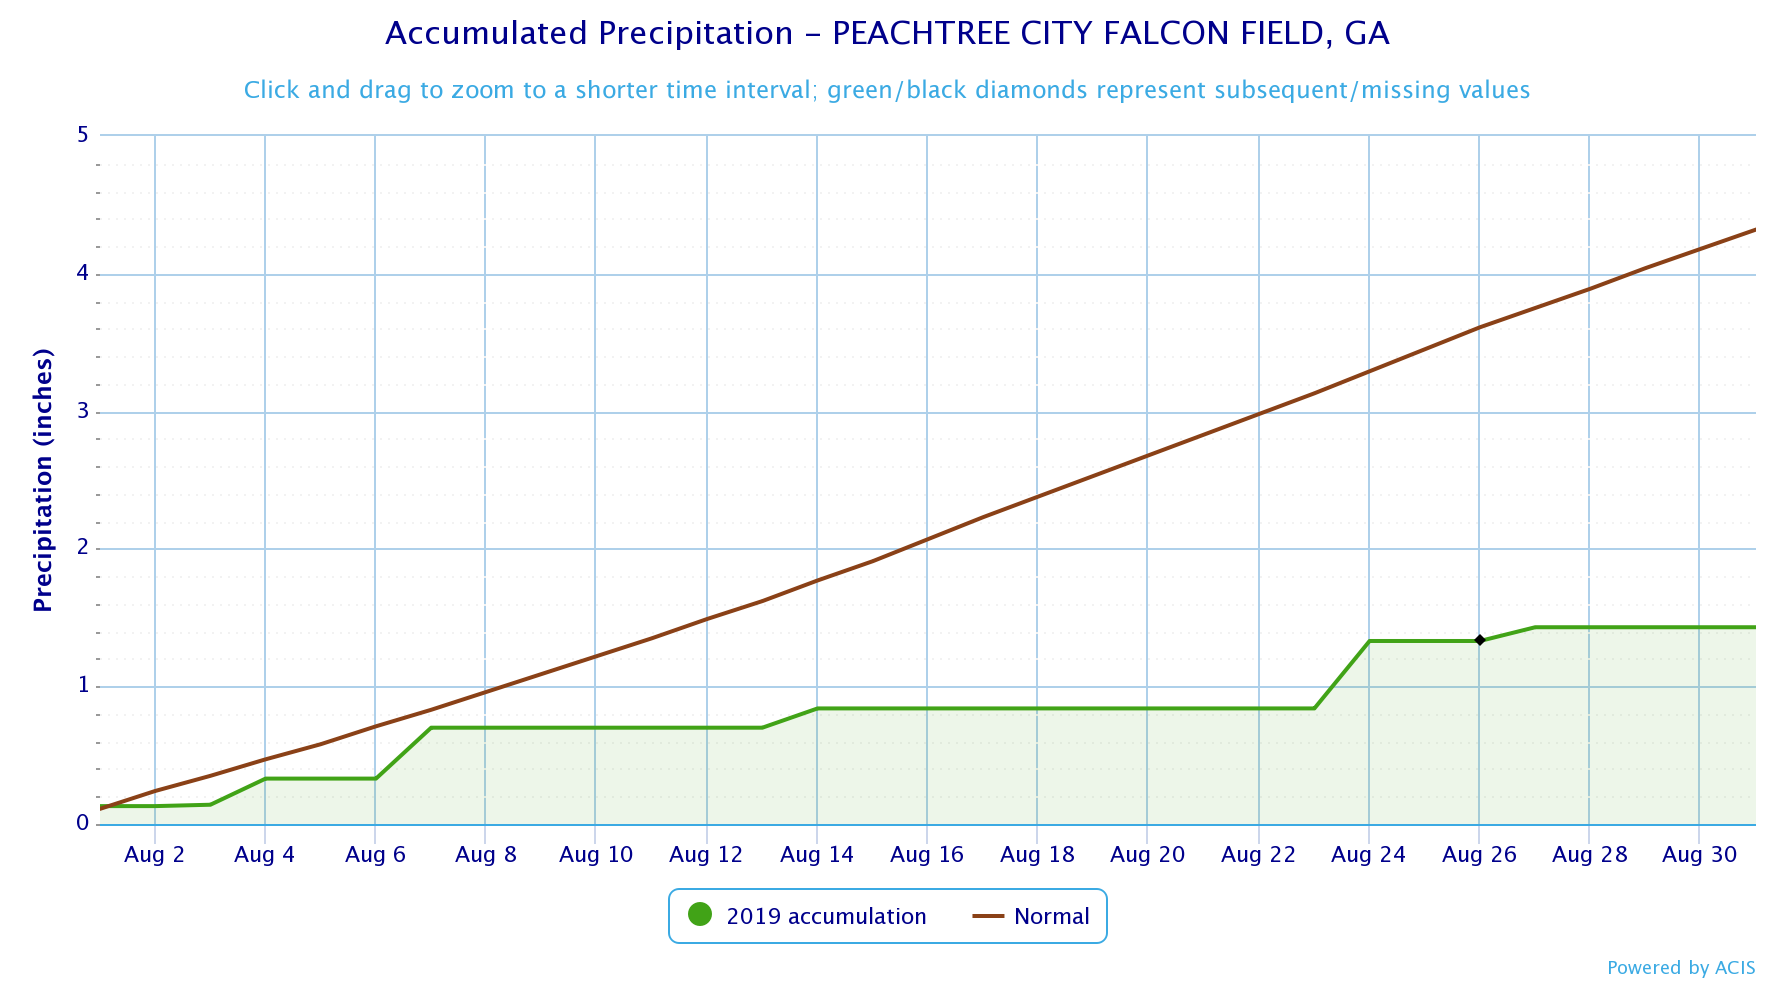
Peachtree City |
0.49 (8/24) |
|
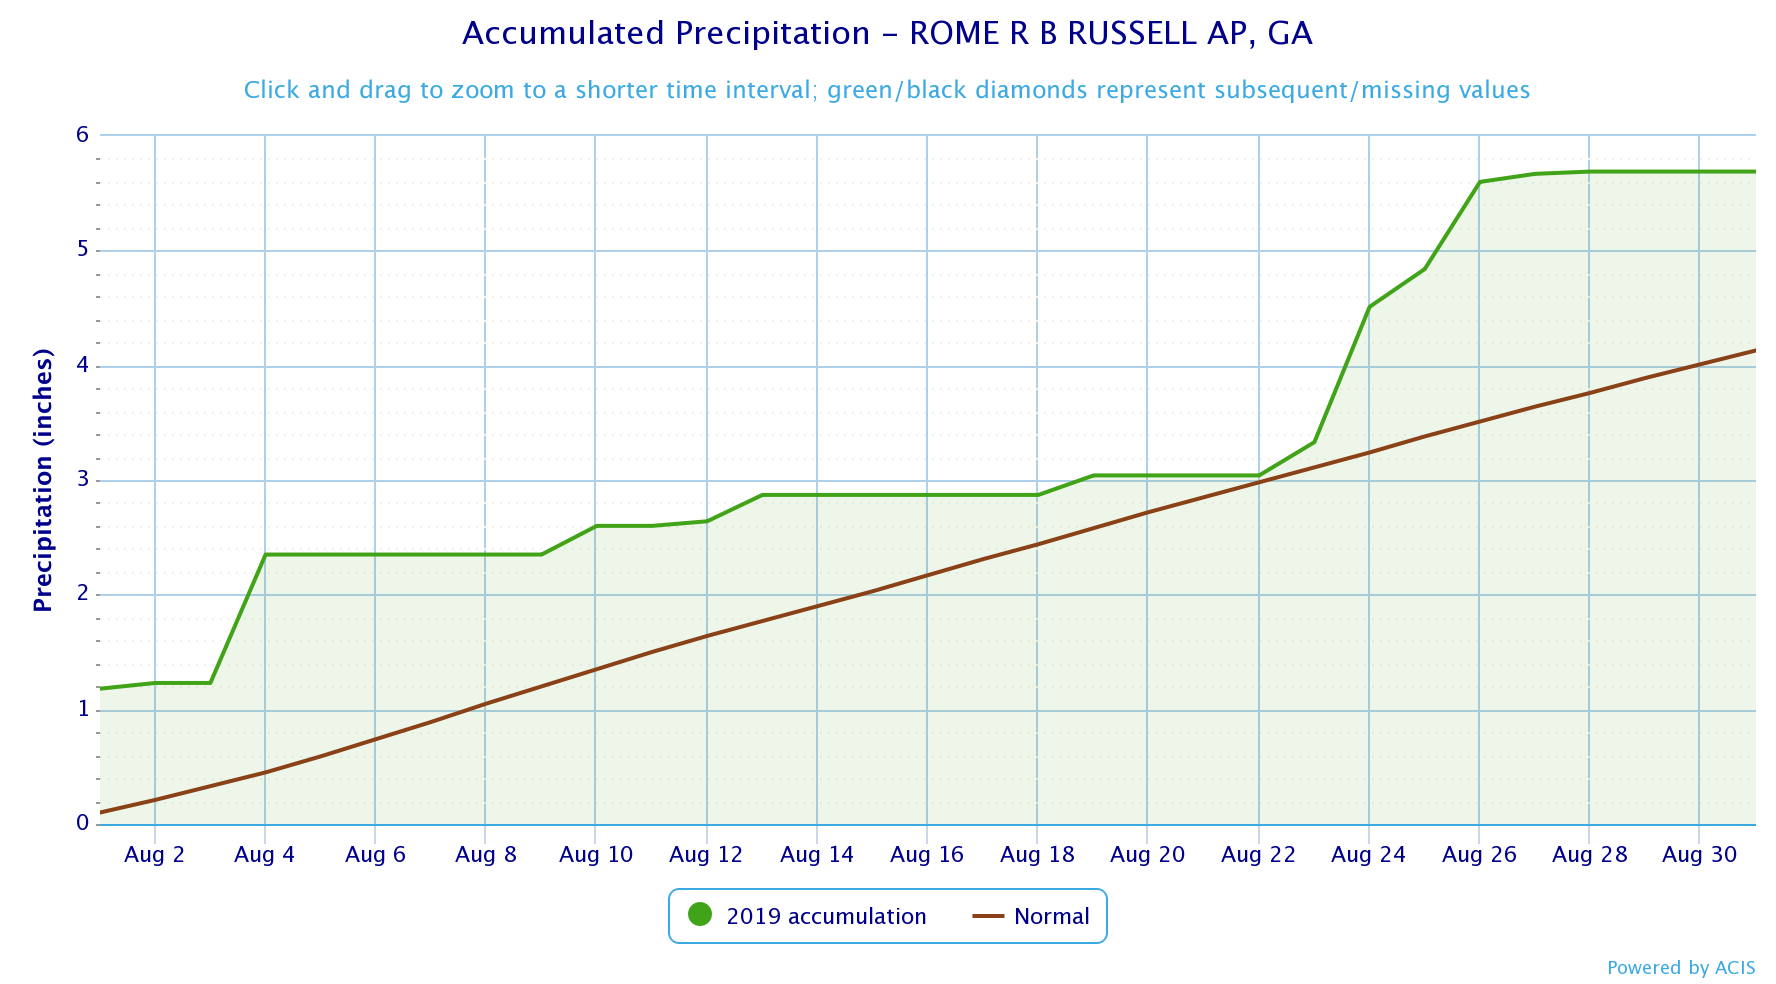
Rome |
1.18 (8/24) |
August 2019 Precipitation Totals (in) and Rankings
* Click on site name below to view a graph with additional data
|
Site |
Total Precip. and Current Ranking |
Normal |
Dep. from Normal |
Record |
|
8.78 (5th Wettest) |
3.53 |
+5.25 |
18.43 (1908) |
|
|
1.89 (32nd Driest) |
3.90 |
-2.01 |
0.09 (1951) |
|
|
3.54 (51st Drist) |
3.77 |
-0.23 |
0.80 (1988) |
|
|
6.19 (22nd Wettest) |
4.10 |
+2.09 |
20.52 (1928) |
|
|
3.01 |
3.93 |
-0.92 |
|
|
|
4.24 |
4.31 |
-0.07 |
|
|
|
1.63 |
4.74 |
-3.11 |
|
|
|
2.47 |
4.43 |
-1.96 |
|
|
|
1.43 |
4.32 |
-2.89 |
|
|
|
5.69 |
4.13 |
+1.56 |
|
Records Set this August
Athens:
Atlanta:
Columbus:
Macon:
September Outlook
Based on the Climate Prediction Center’s September outlook, north Georgia has a 33% to 40% chance of above normal temperatures and central Georgia has a 40 to 50% chance of above normal temperatures. For precipitation, north Georgia has a an equal chance of above, normal, or below normal precipitation and central Georgia has a 33 to 50% chance of above normal precipitation.
 |
 |
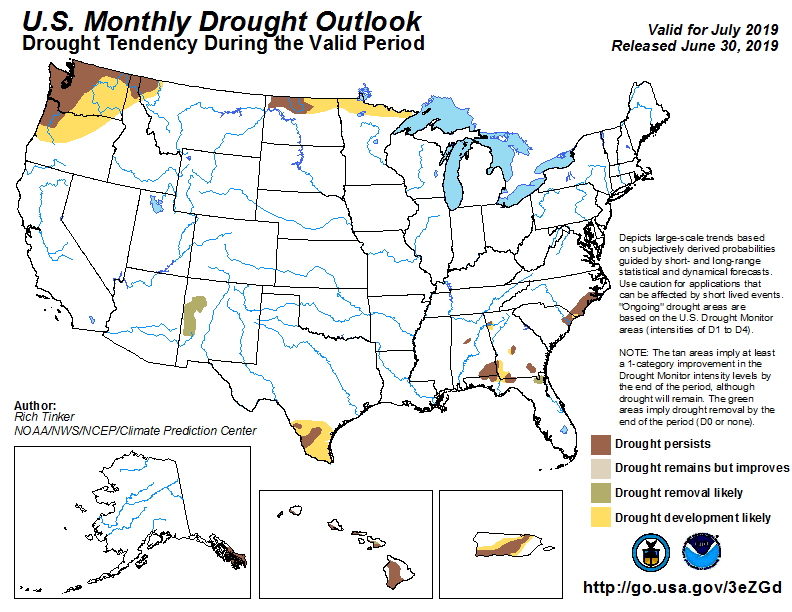
September Drought Outlook
Based on the U.S. Monthly Drought Outlook for September, drought is expected to persist across middle Georgia.
Data prepared by the Atlanta Forecast Office.

