| Previous Month | Next Month |
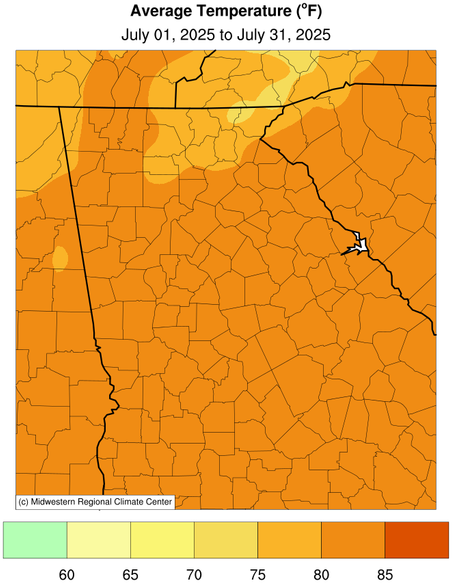
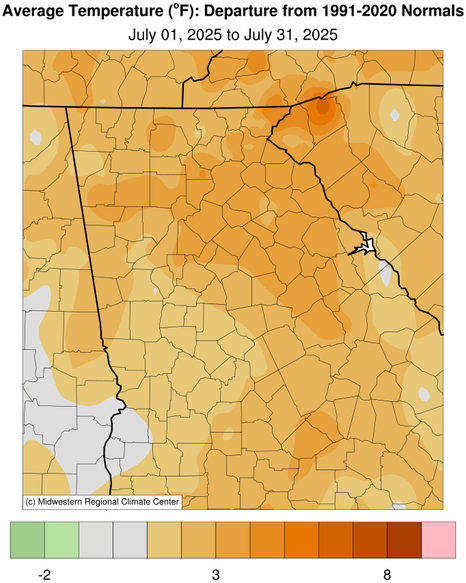
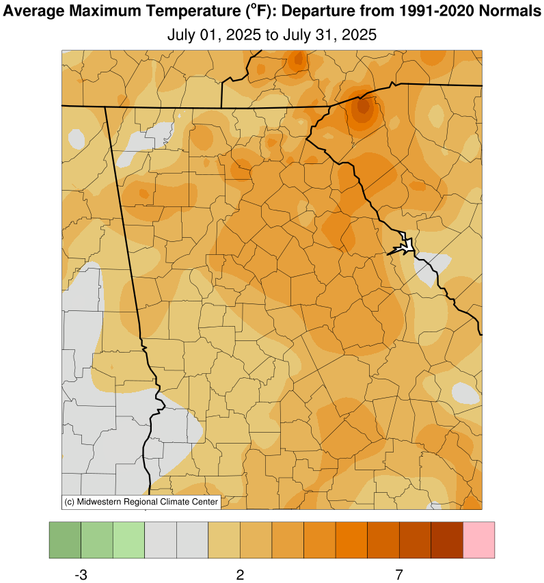
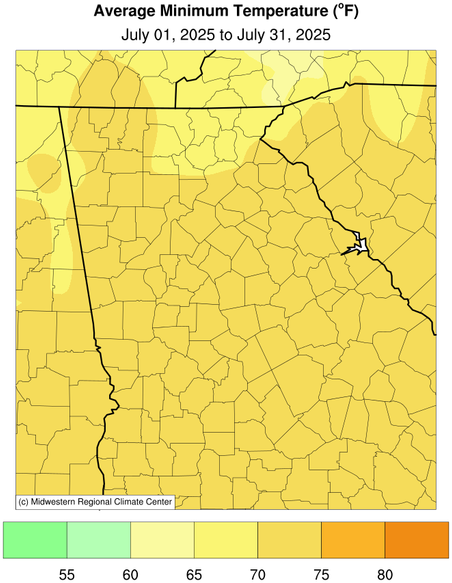
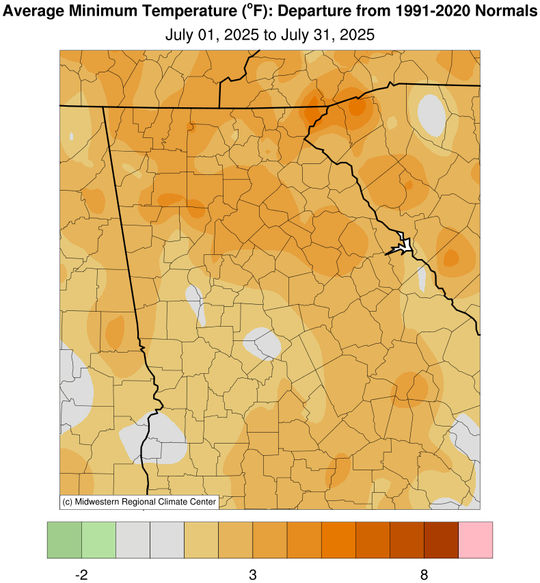
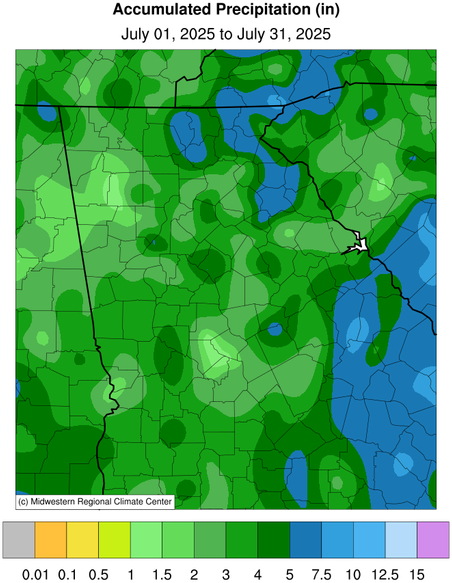
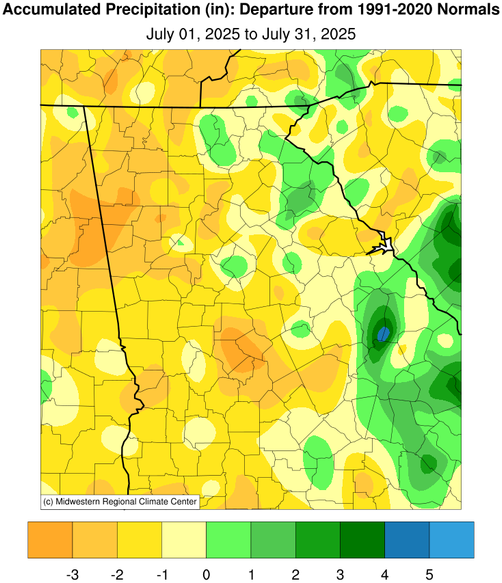
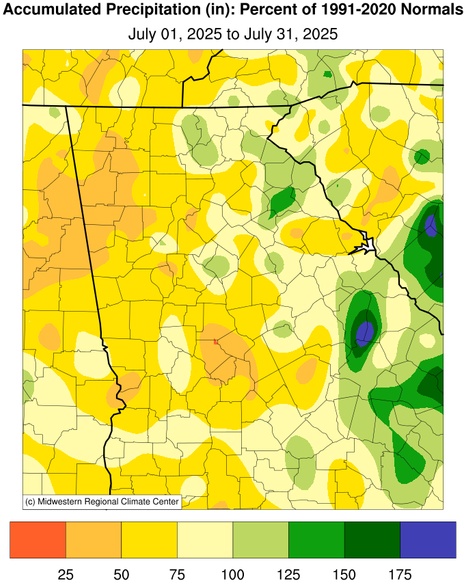
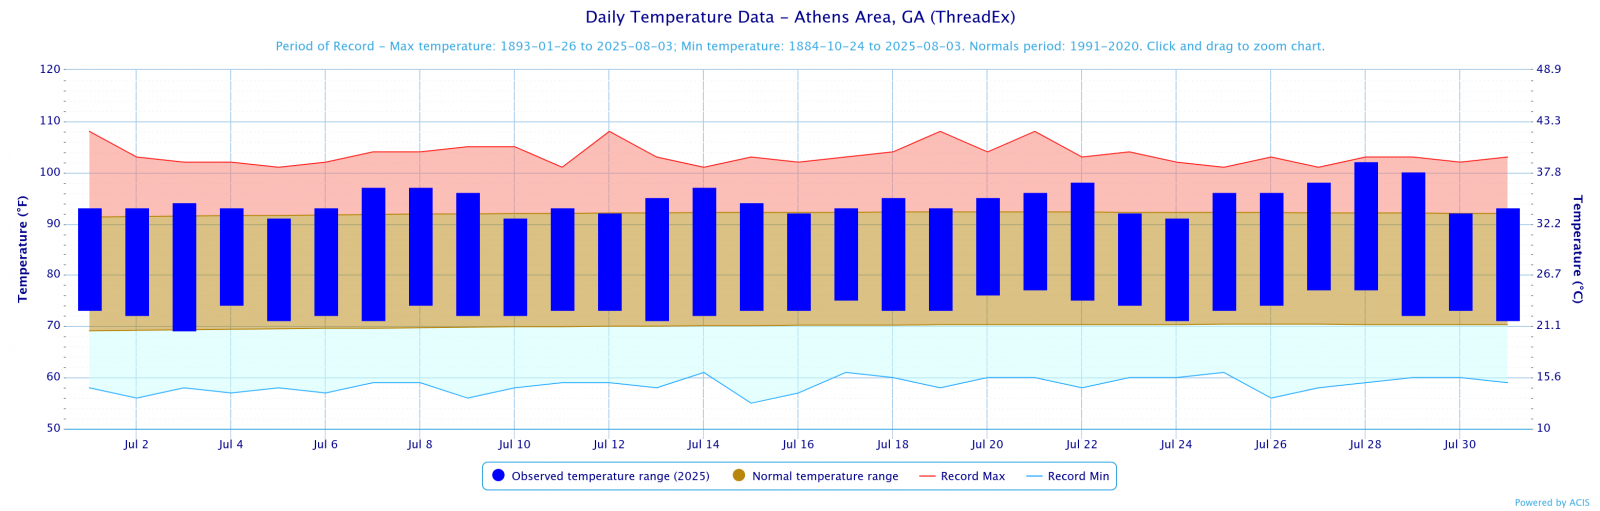
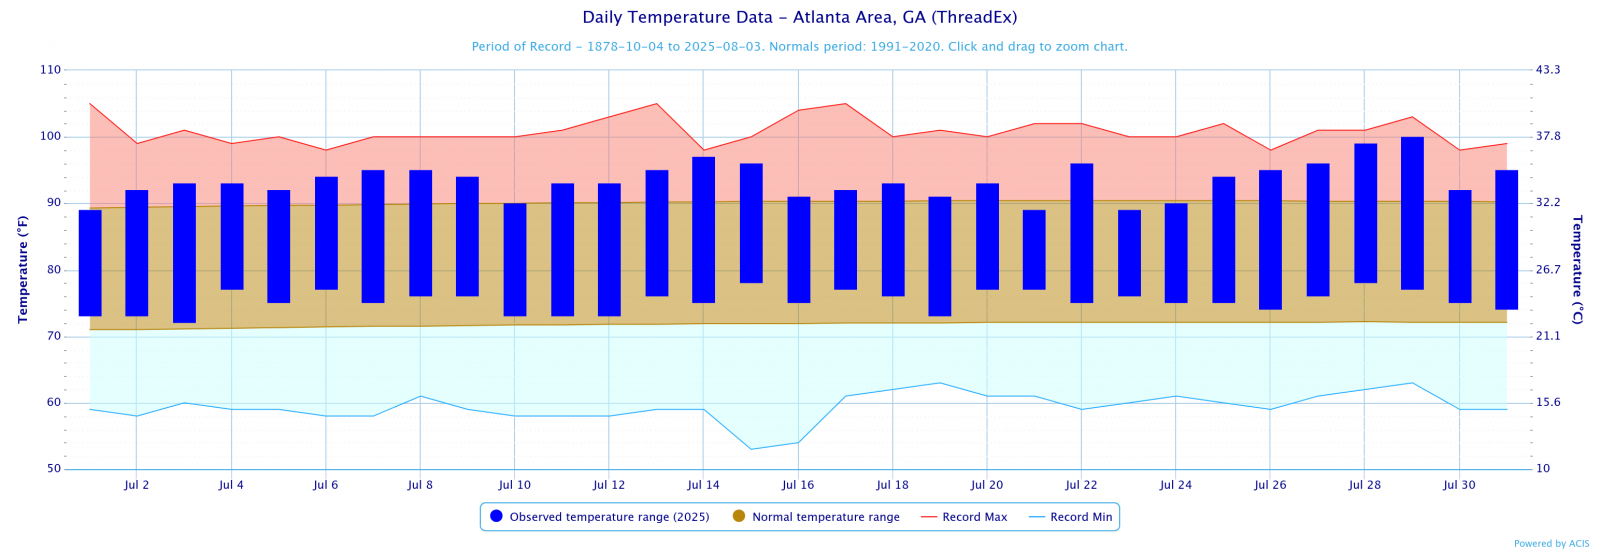
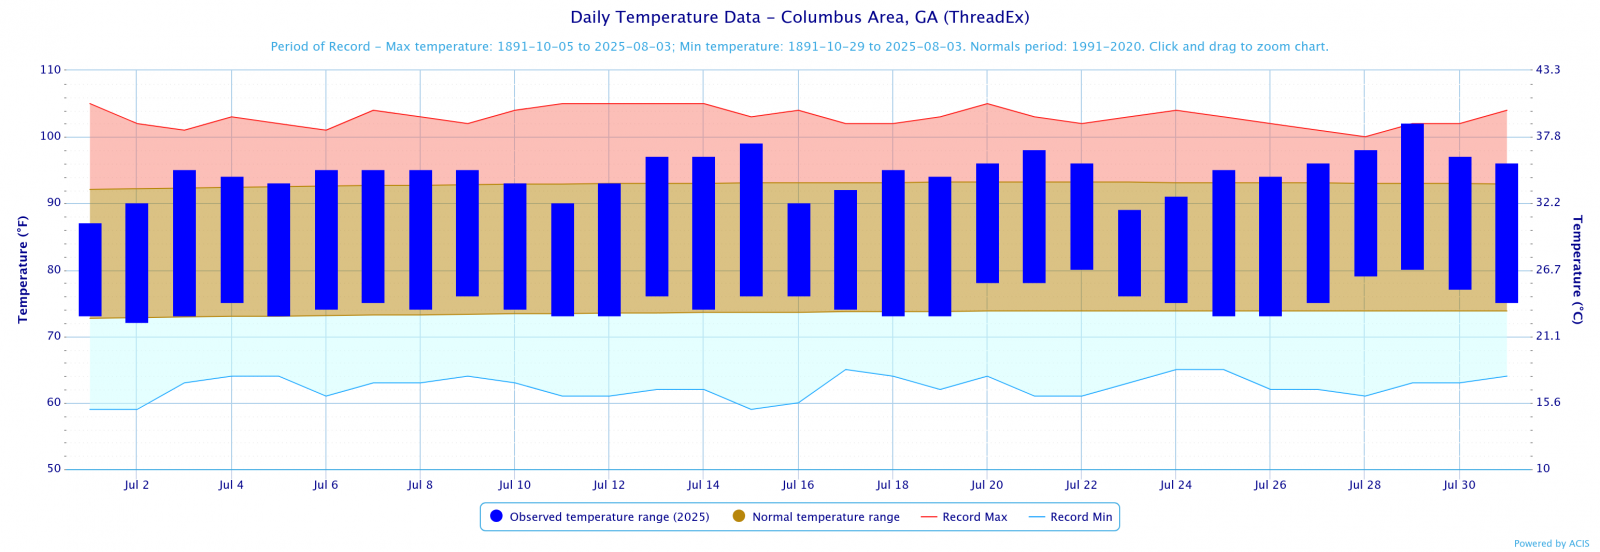
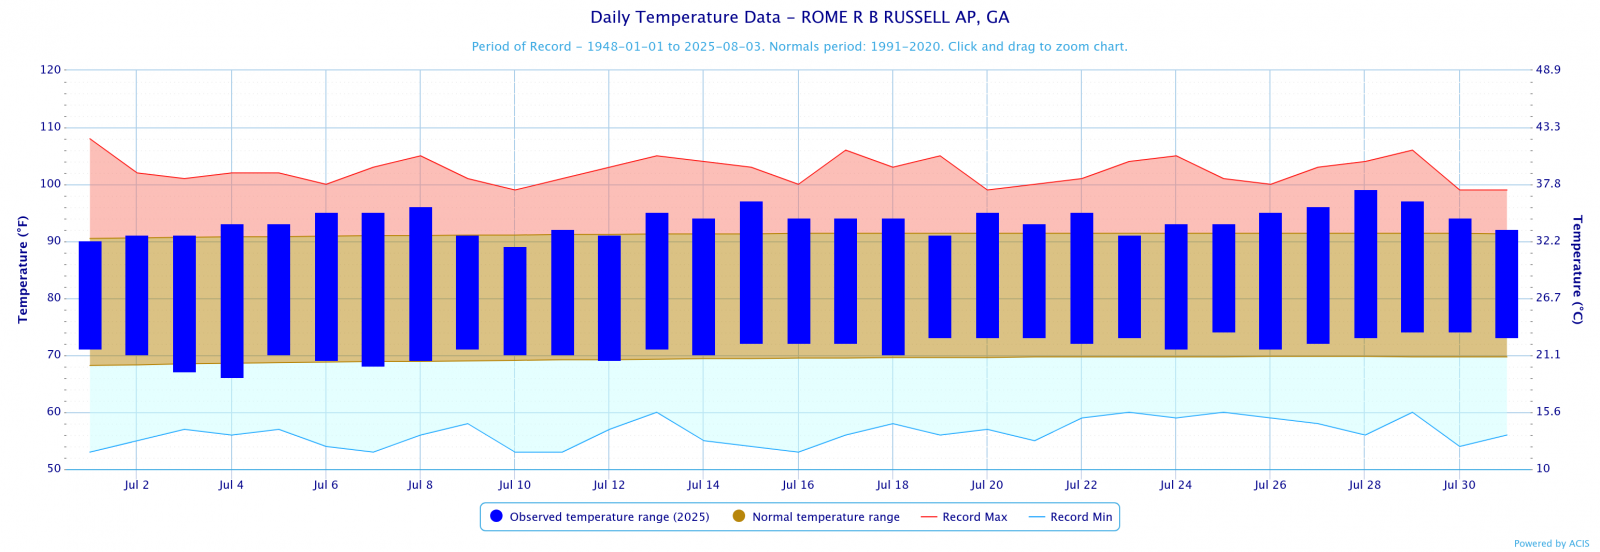
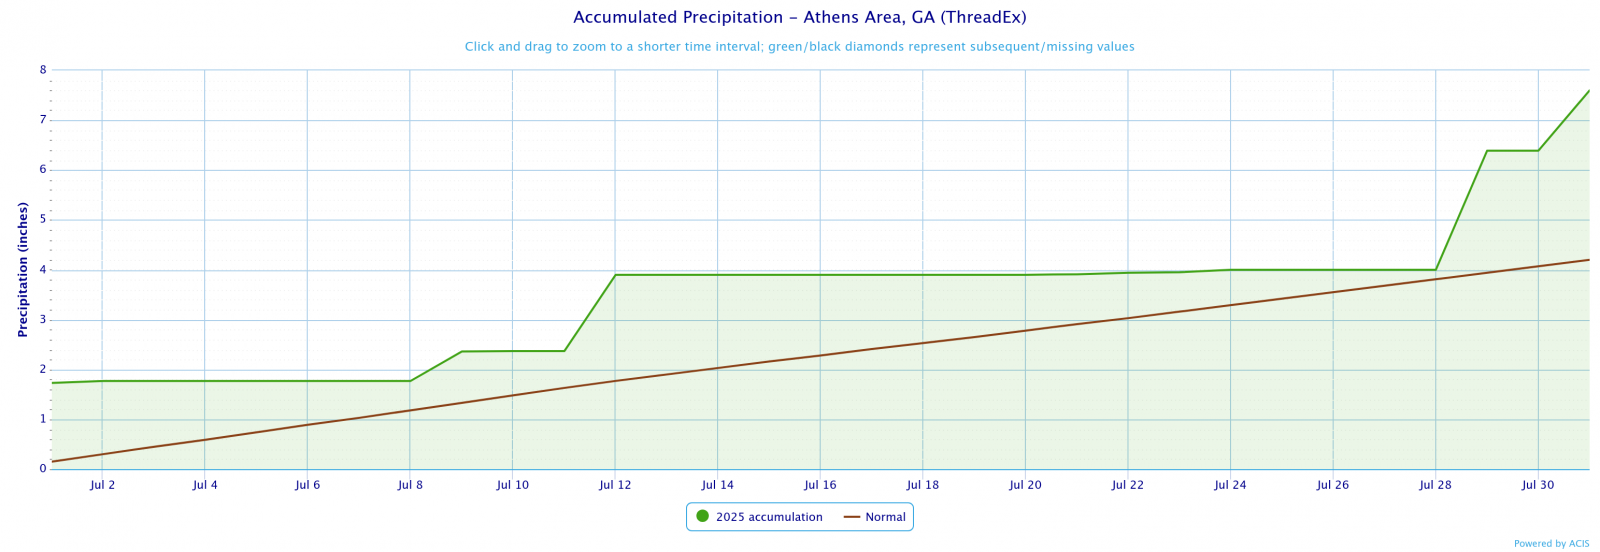
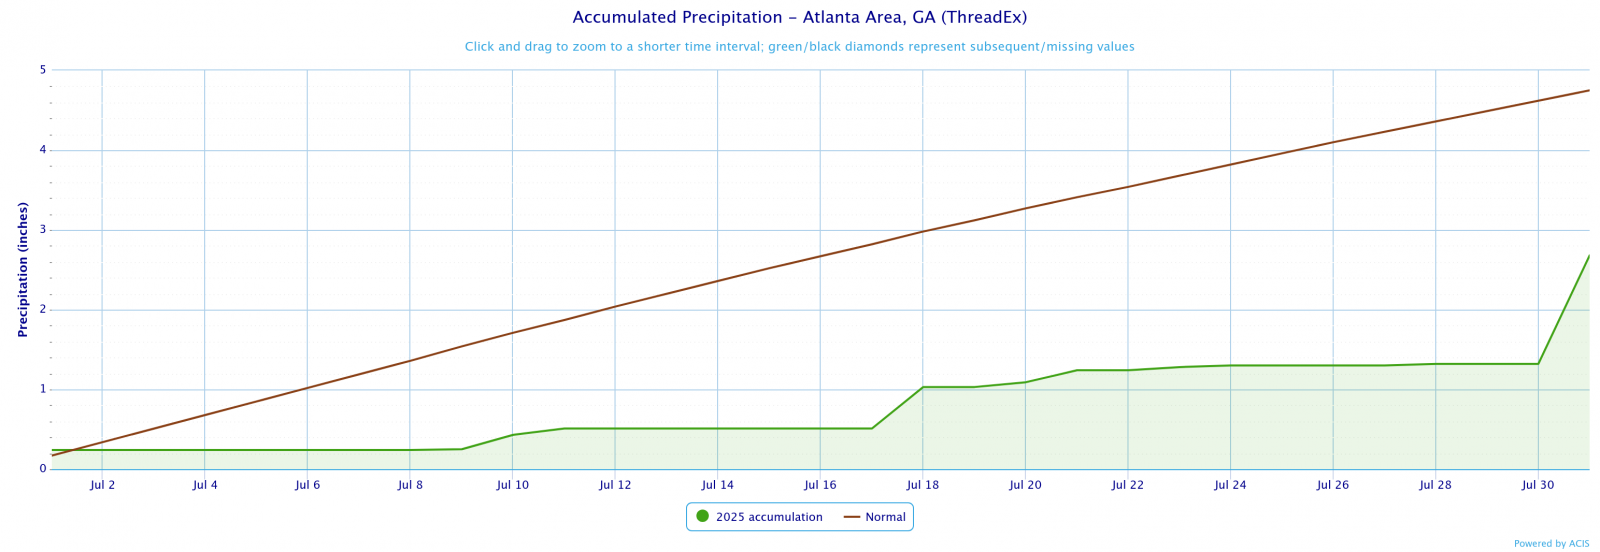
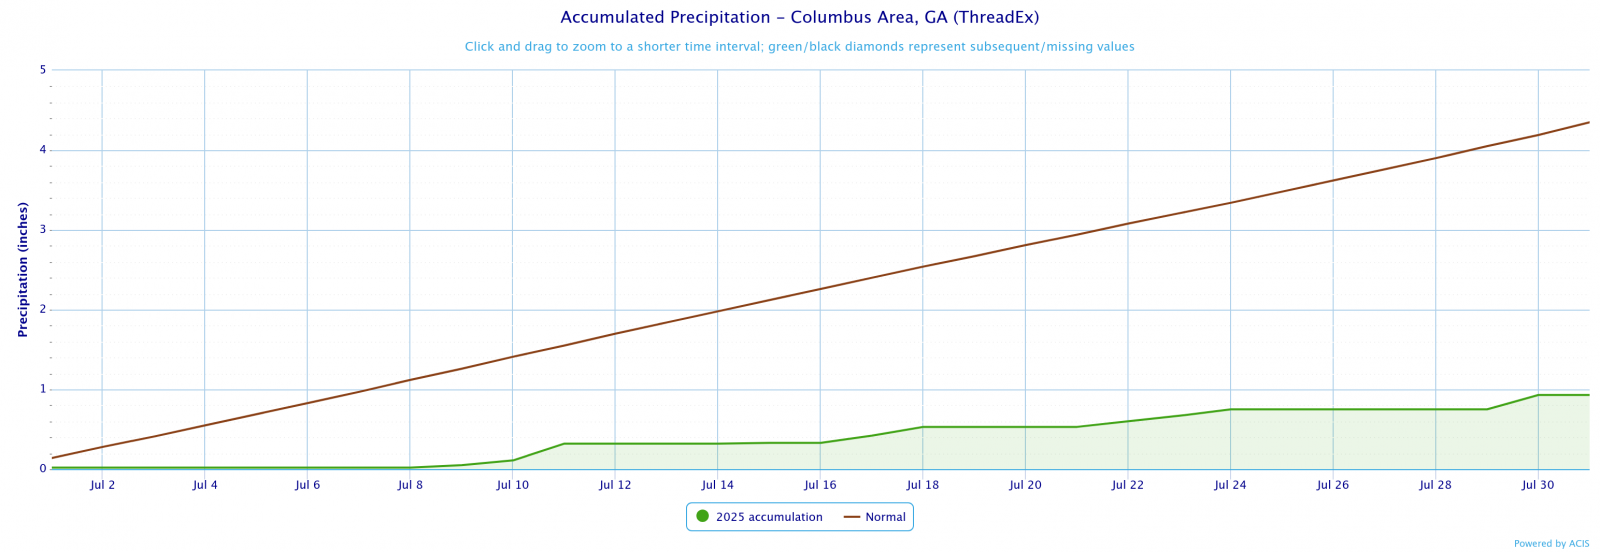
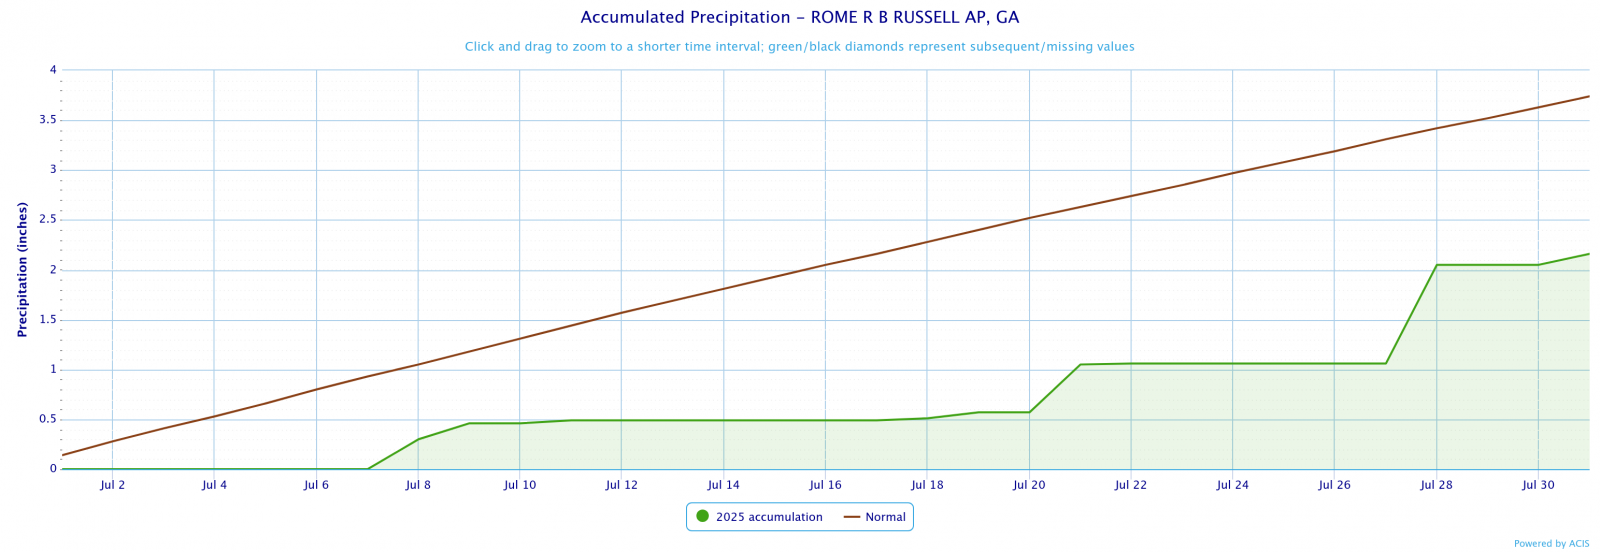
Temperatures through the month of July were around 2 degrees above normal. Precipitation totals through the month of July were around 1 inches below normal.
|
July 2025 Climate Averages
|
|||
|
Climate Site
|
Month Temp (°F)
|
Average Temp
|
Departure from normal
|
|
Athens
|
83.8 |
81.0
|
2.8
|
|
Atlanta
|
84.3
|
80.9
|
3.4
|
|
Columbus
|
84.7
|
83.2
|
1.5
|
|
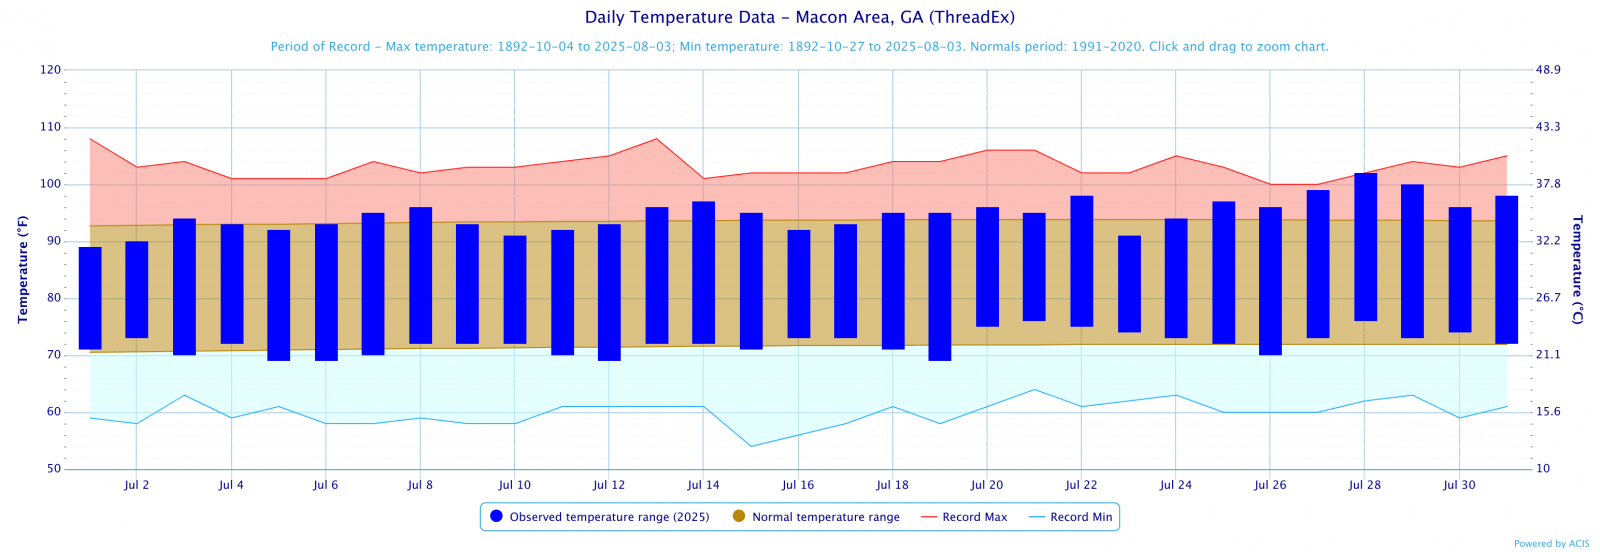
Macon
|
83.4
|
82.5
|
0.9
|
|
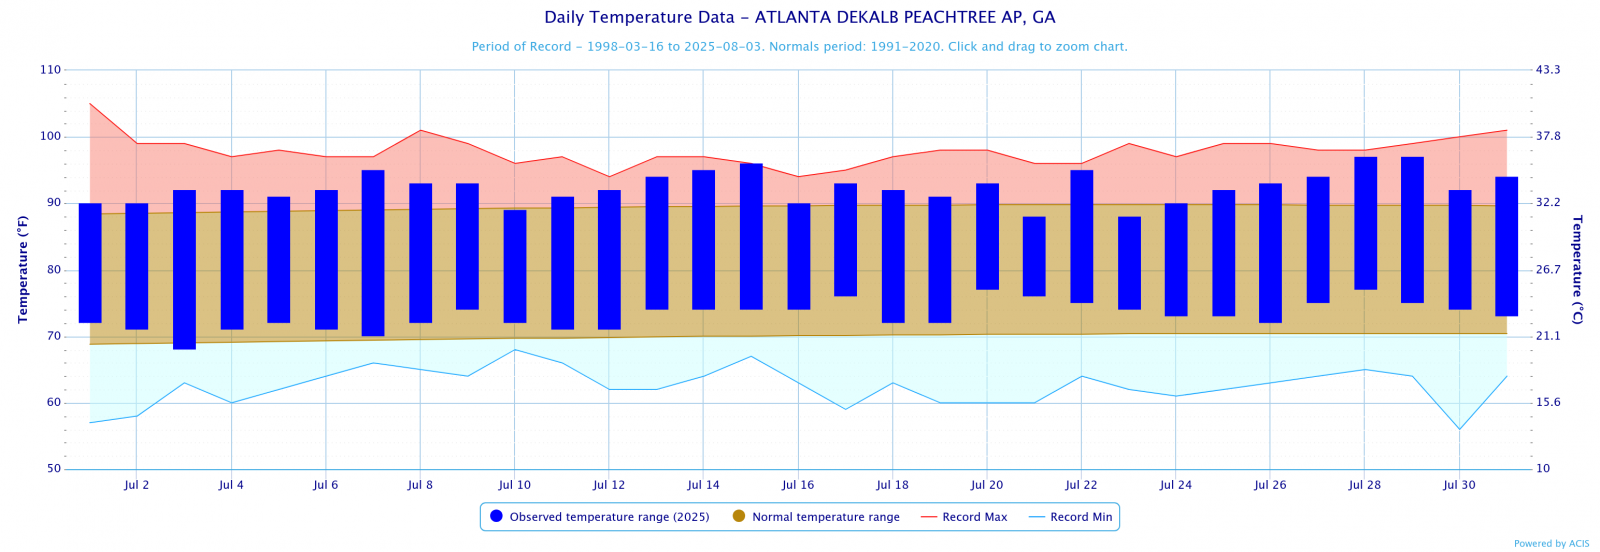
Dekalb Peachtree Arpt
|
82.7
|
79.6
|
3.1
|
|
Fulton Co Arpt
|
82.0
|
80.1
|
1.9
|
|
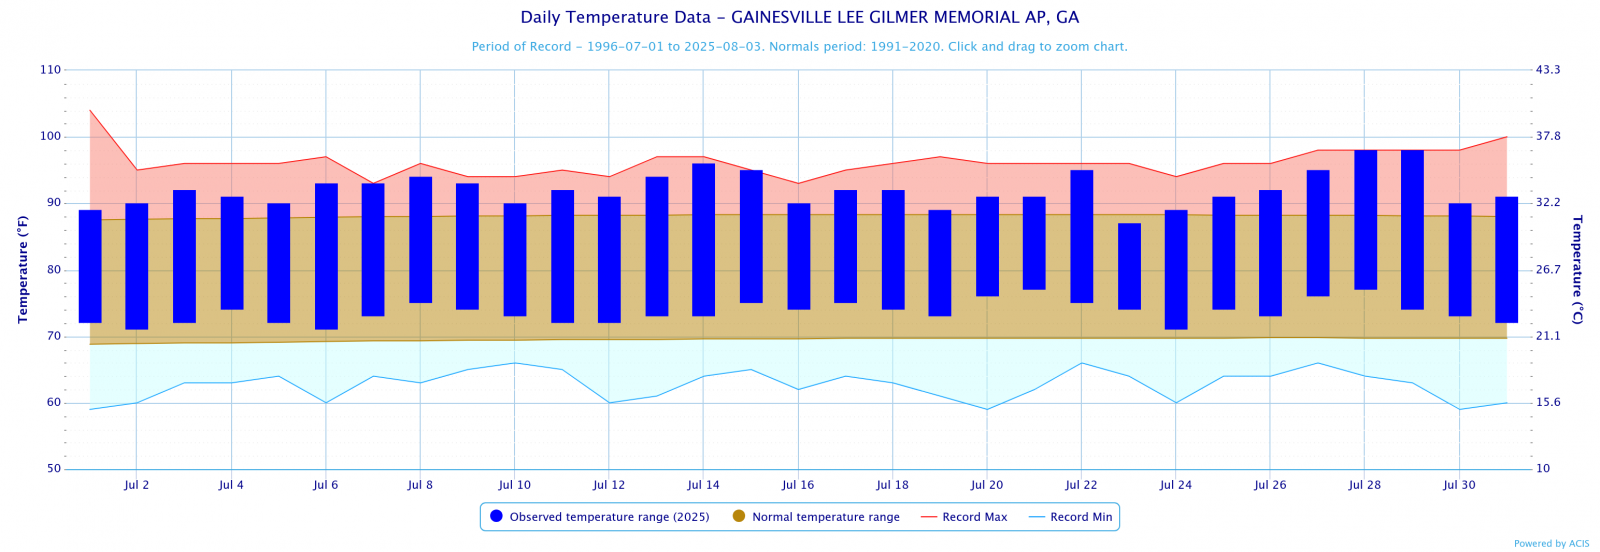
Gainesville
|
82.8
|
78.8
|
4.0
|
|
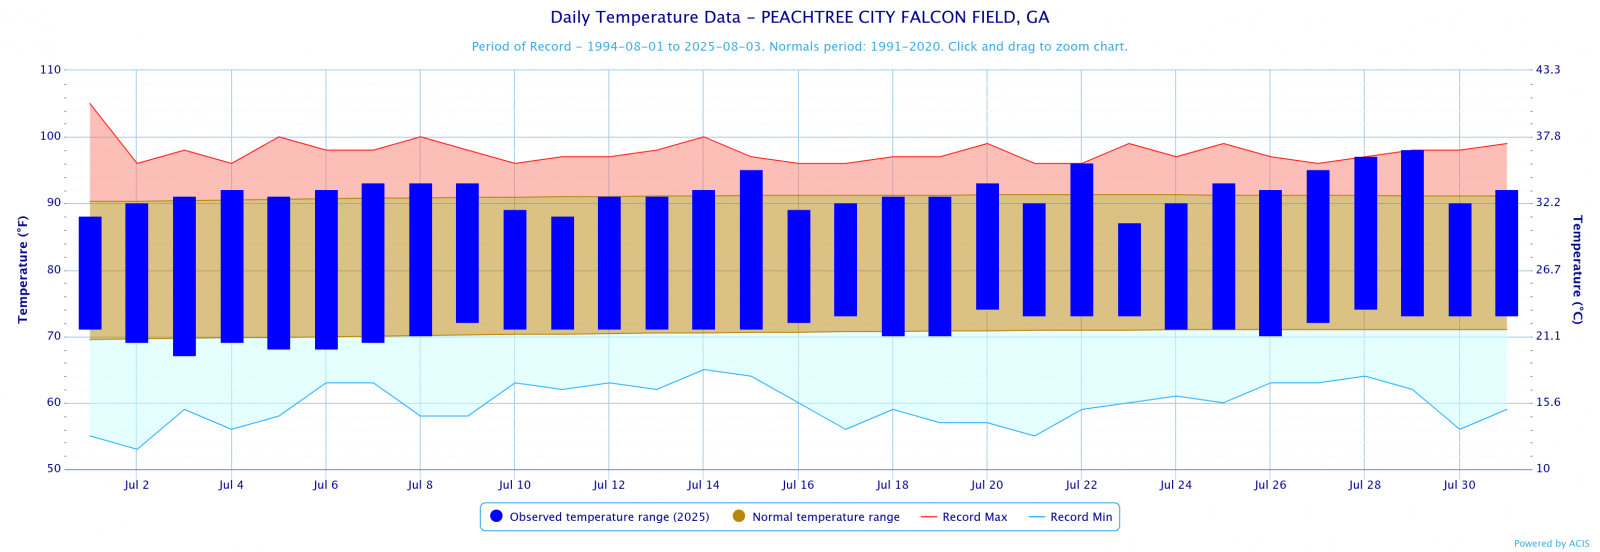
Peachtree City
|
81.4
|
80.8
|
0.6
|
|
Rome
|
82.3
|
80.2
|
2.1
|
|
July 2025 Temperature Climate Statistics
|
||||
|
Climate Site |
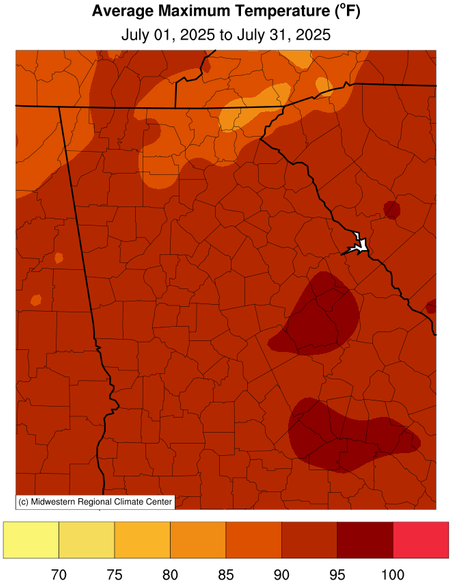
Maximum Temperature |
Max T Date |
Minimum Temperature
|
Min T Date
|
|
Athens
|
102
|
7/28
|
69
|
7/3
|
|
Atlanta
|
100
|
7/29
|
72
|
7/3
|
|
Columbus
|
102
|
7/29
|
72
|
7/2
|
|
Macon
|
102
|
7/28
|
69
|
7/12,19
|
|
Dekalb Peachtree Arpt
|
97
|
7/28,29
|
68
|
7/3
|
|
Fulton Co Arpt
|
98
|
7/29
|
69
|
7/6,7
|
|
Gainesville
|
98
|
7/28,29
|
71
|
7/6,24
|
|
Peachtree City
|
98
|
7/29
|
67
|
7/3
|
|
Rome
|
99
|
7/28
|
66
|
7/4
|
*Indicates a daily record was set
|
July 2025 Precipitation Climate Statistics
|
|||
|
Climate Site |
Total Precipitation |
Average Precipitation
|
DFN (Departure From Normal)
|
|
Athens
|
7.6
|
4.20
|
3.40
|
|
Atlanta
|
2.68
|
4.75
|
-2.07
|
|
Columbus
|
0.93
|
4.35
|
-3.42
|
|
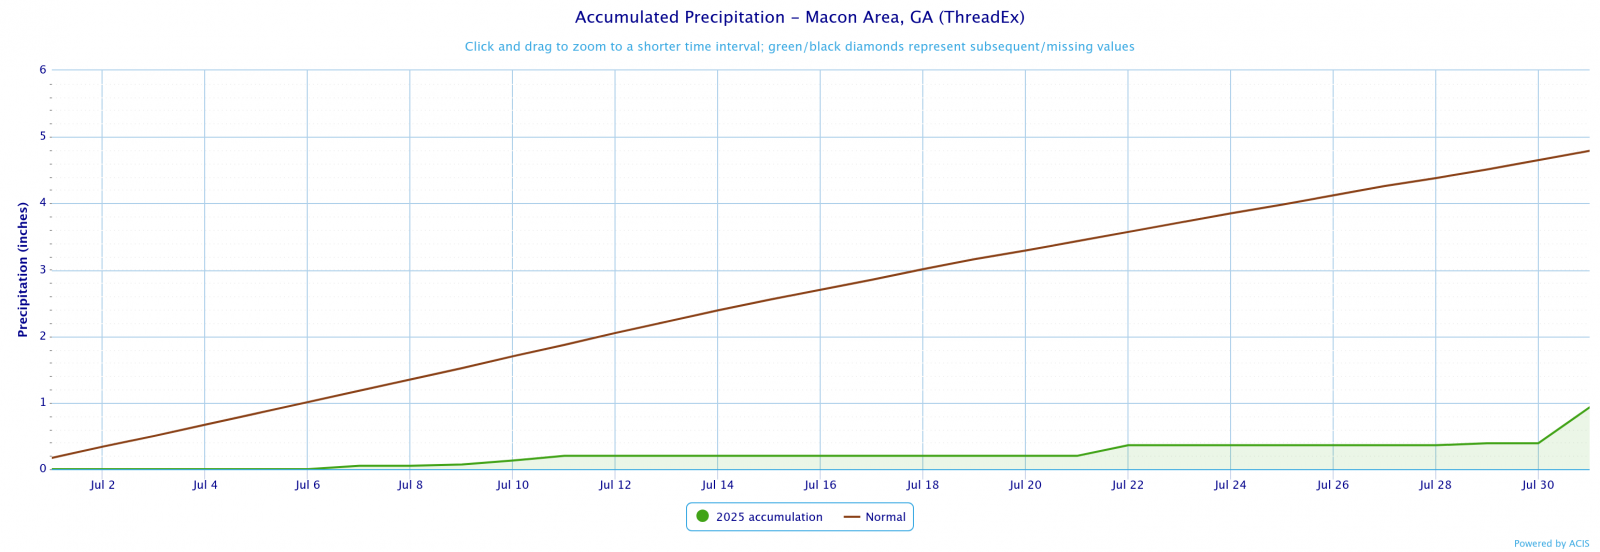
Macon
|
0.93
|
4.79
|
-3.96
|
|
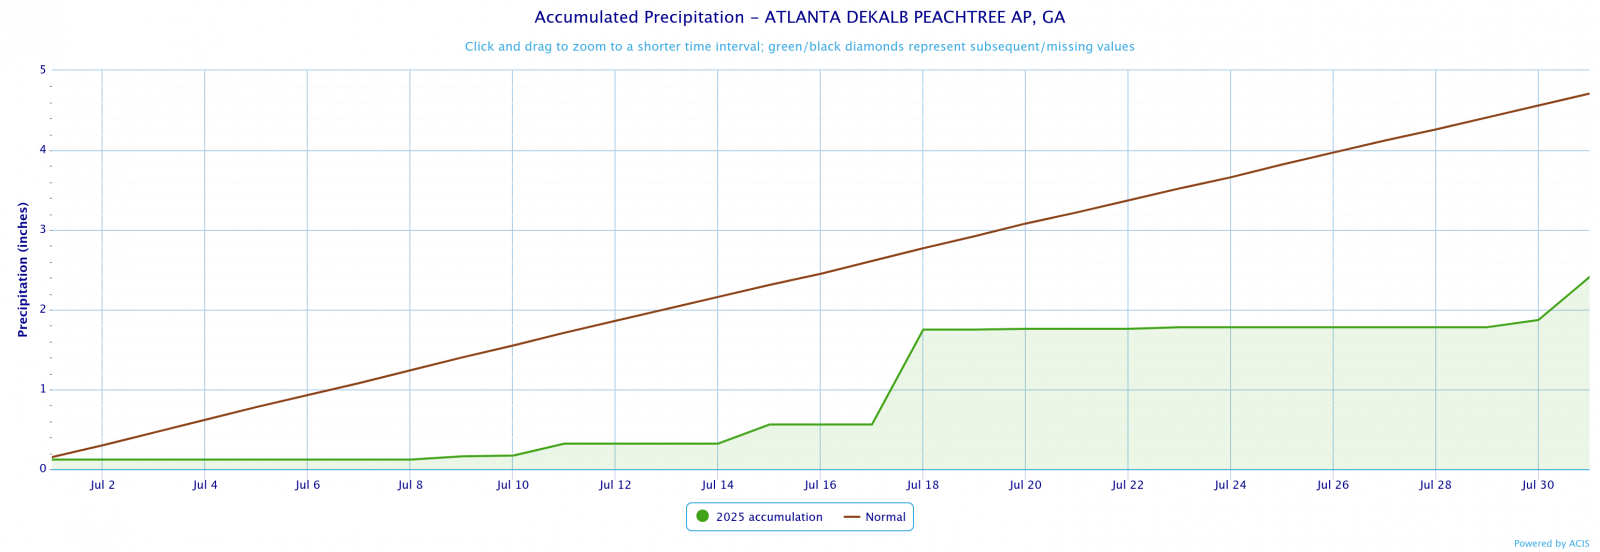
Dekalb Peachtree Arpt
|
2.41
|
4.71
|
-2.30
|
|
Fulton County Arpt
|
7.13
|
5.01
|
2.12
|
|
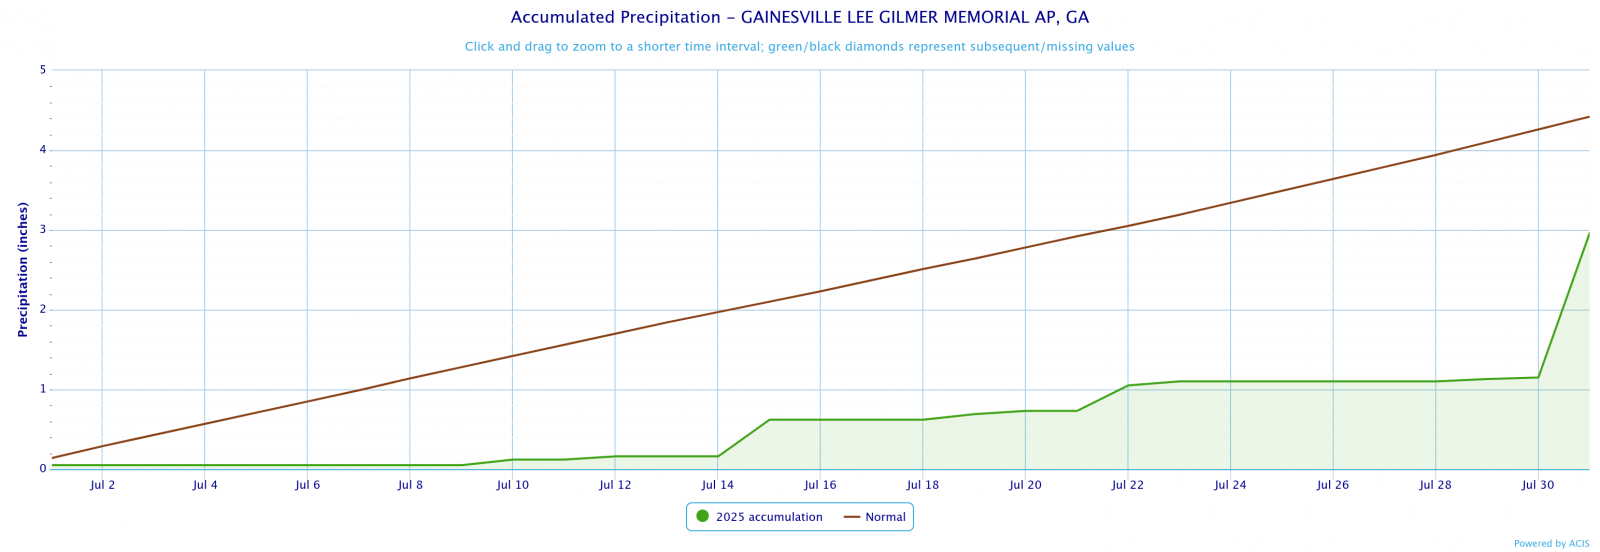
Gainesville
|
2.96
|
4.42
|
-1.46
|
|
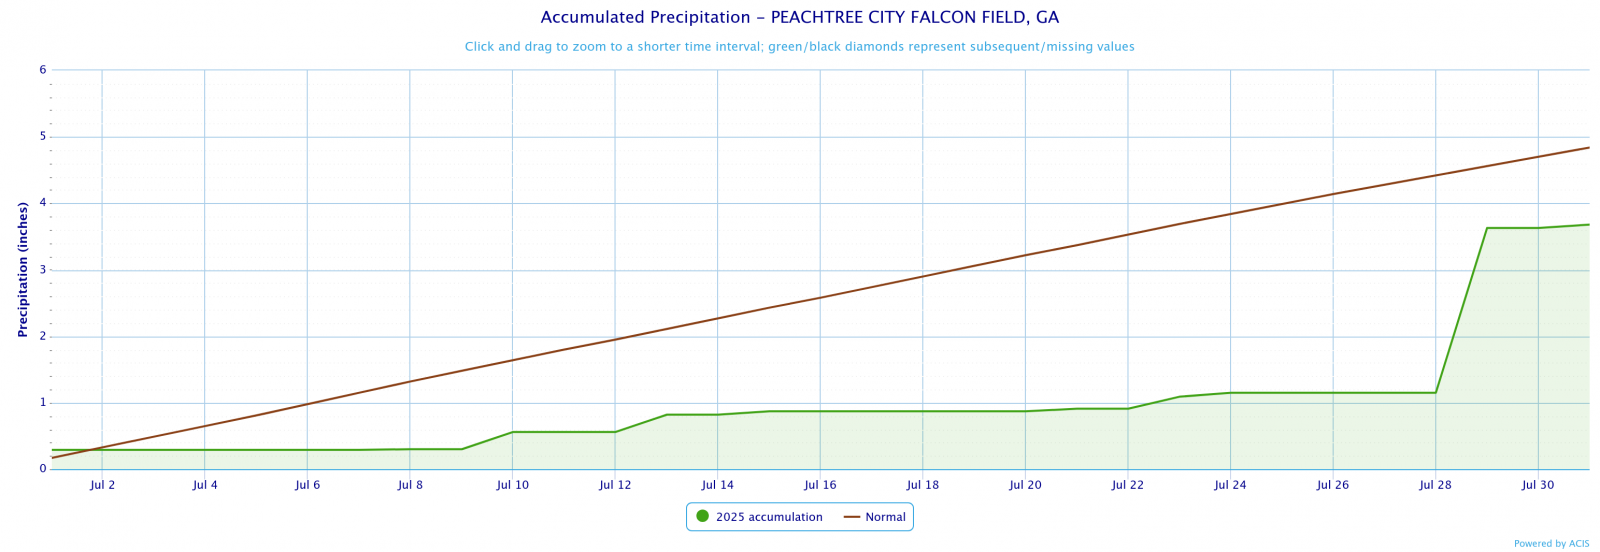
Peachtree City
|
3.68
|
4.42
|
-1.16
|
|
Rome
|
2.16
|
3.74
|
-1.58
|
|
July 2025 Precipitation Climate Statistics
|
||||
|
Climate Site |
Maximum Daily Precip (in inches) |
Max P Date |
||
|
Athens
|
2.39
|
7/29
|
||
|
Atlanta
|
1.36
|
7/31
|
||
|
Columbus
|
0.38
|
7/30
|
||
|
Macon
|
0.54
|
7/31
|
||
|
Dekalb Peachtree Arpt
|
1.19
|
7/18
|
||
|
Fulton County Arpt
|
2.60
|
7/1
|
||
|
Gainesville
|
1.81
|
7/30
|
||
|
Peachtree City
|
2.48
|
7/29
|
||
|
Rome
|
0.99
|
7/28
|
||
*Indicates a daily record was set
Data prepared by NWS Peachtree City/Atlanta
| Temperature Maps | Precipitation Maps |
| Temperature Graphs | Precipitation Graphs |
|
July 2025 Climate Records
|
|||
|
Date
|
Type
|
Location
|
Records set over a 24 hour period
|
|
7/29
|
Max Temp
|
Columbus |
A max temp of 102 occurred on 7/29 which tied the old record of 101 from 1952.
|
|
7/28
|
Max Temp
|
Macon |
A max temp of 102 occurred on 7/28 which tied the old record of 101 from 1952.
|
Based on the Climate Prediction Center's outlook for August, north and central Georgia have a 33-44% chances of above normal temperatures. Much of Gerogia has a 50-60% chance of above normal precipitation.
 |
 |

