2012: Warmest Year on Record
Overview:
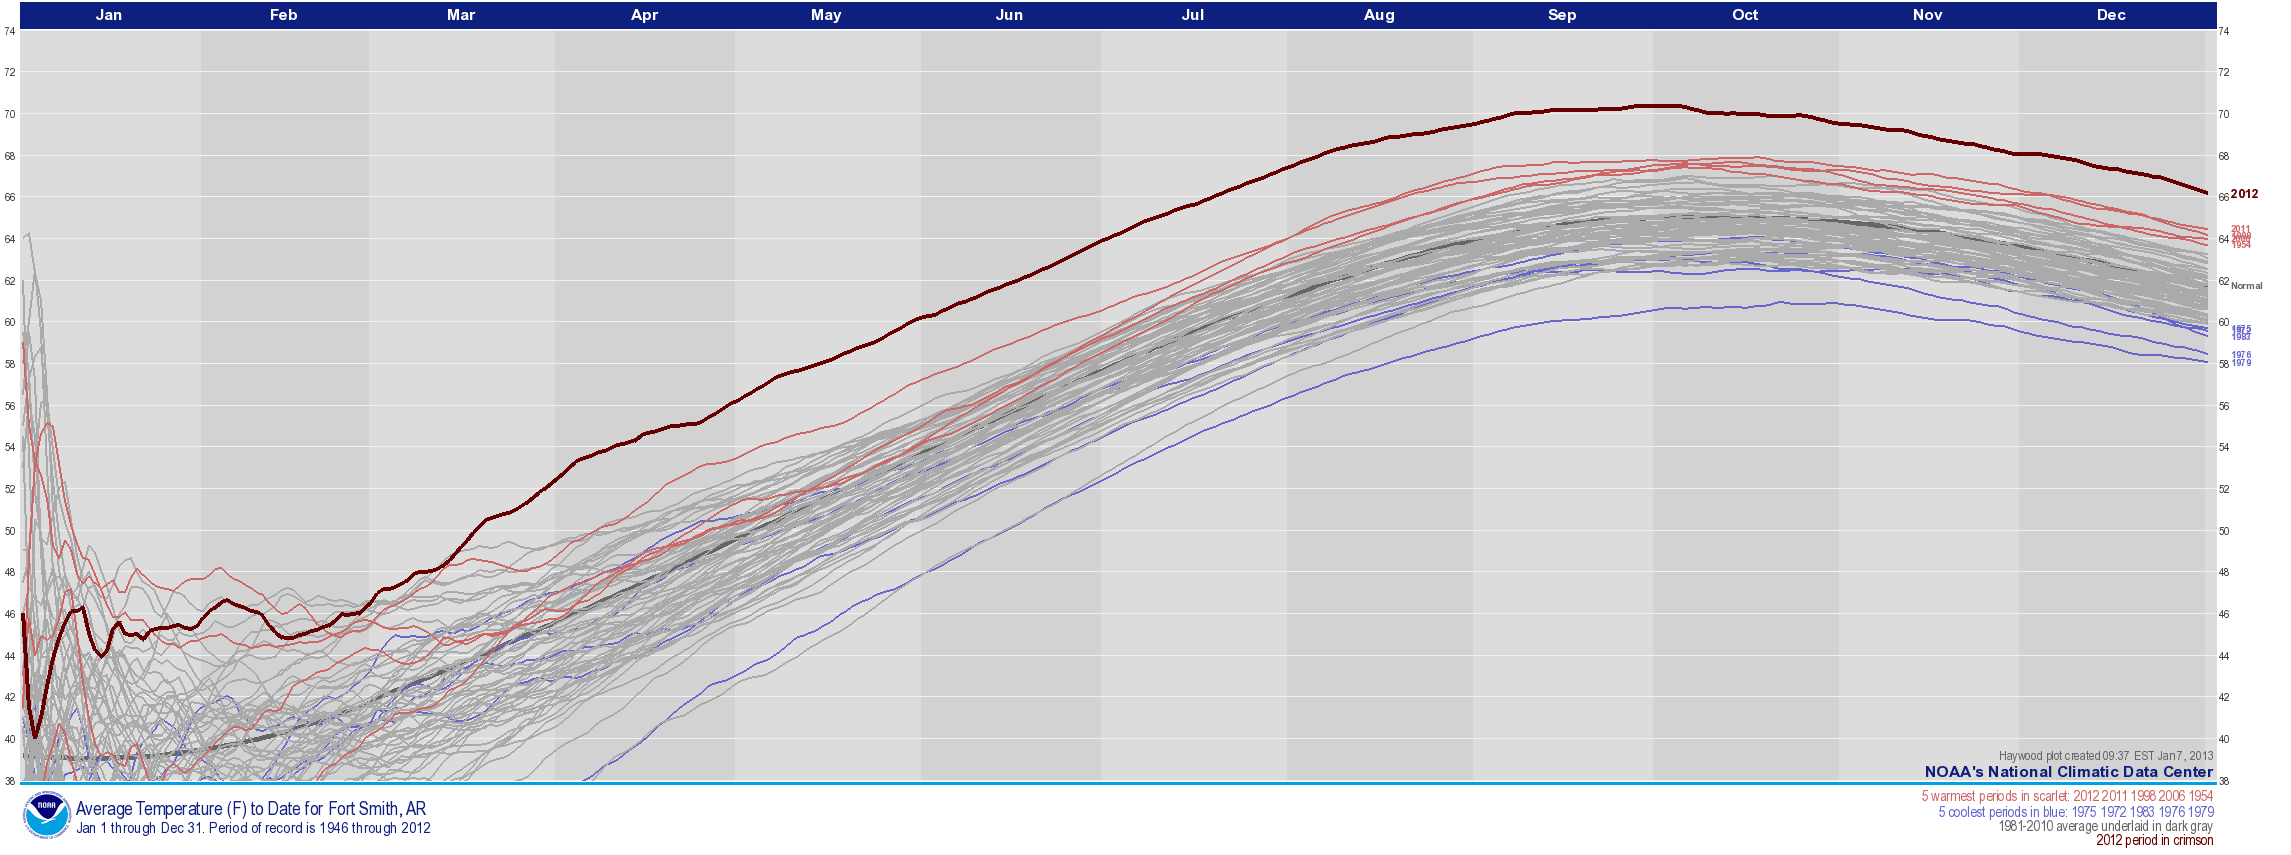
People across eastern Oklahoma and northwest Arkansas may recall the summer of 2012 as being especially hot, but above normal temperatures occurred every month except for one in 2012. As a result, Tulsa, OK, Fort Smith, AR, and Fayetteville, AR all recorded their warmest year in 2012 for their respective periods of record. March 2012 was the warmest March on record across the region, averaging around 10°F above normal, and several other months this year had average temperatures in excess of 5°F above normal.
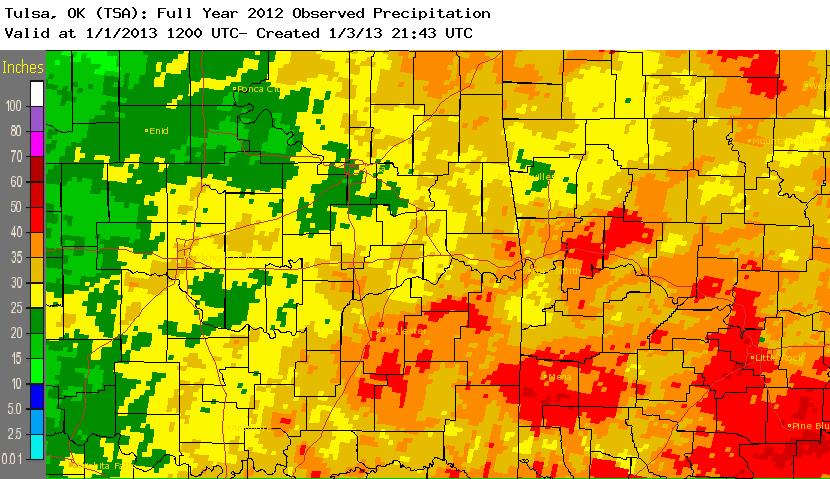
2012 was also defined by the Severe to Exceptional Drought that affected the region for much of the year. Despite a wetter winter 2011-12, the 2012 Drought was an extension of the drought conditions that began in October 2010. Rainfall totals for 2012 ranged from around 20” in Pawnee and western Osage Counties to around 45” in portions of southeast OK and west central AR. This represents 50%-90% the normal annual rainfall across eastern OK and northwest AR, though a few pockets of 25%-50% of normal were found in Pawnee, Tulsa, and Washington AR Counties.
| Jump to: | Top 10 Warmest Years | 2012 Temperature, Rainfall, Snowfall | 2012 Graphs | Monthly Breakdown | Additional charts/images |
Top 10 Warmest Years on Record
Click on the city name for a complete list of temperature rankings
|
|||||||||||||||||||||||||||||||||||||||||||||||||||||||||||||||||||||||||||||||||||||||||||||||||||||||||||||||||||||||||||||||||||||||||||||||||||||||||||||||||||||||||||||||||||
2012 Temperature, Rainfall, and Snowfall
Click on the city name for additional information, including the period of record for each element. 1981-2010 Normals
| 2012 - Annual |
Temperature |
Normal | Rank | Rainfall | Normal | Rank | Snowfall | Normal | Rank | ||
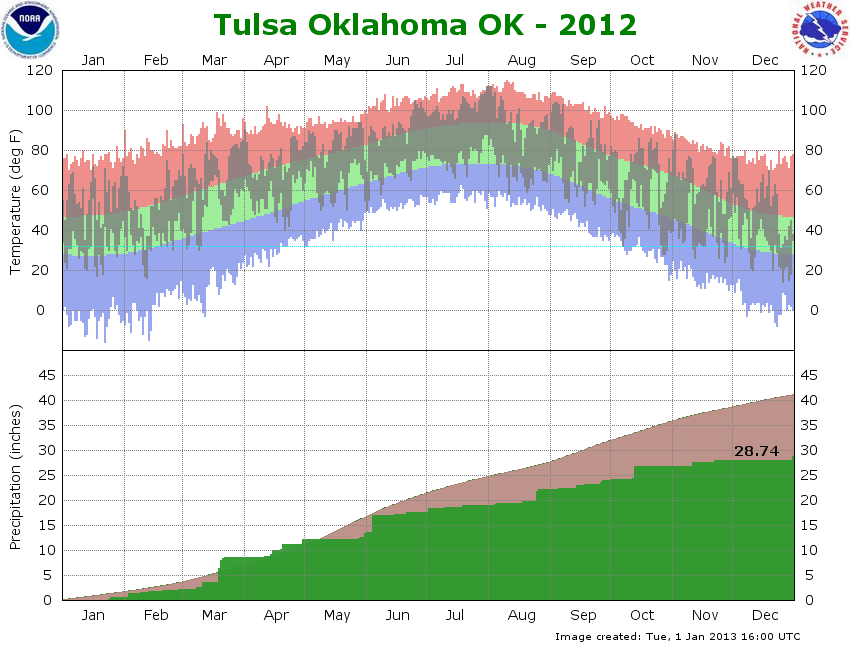
| Tulsa, OK | 64.7°F | 60.8°F | 1st warmest | 28.74" | 40.97" | 16th driest | 1.7" | 9.6" | 14th least snoweist | ||
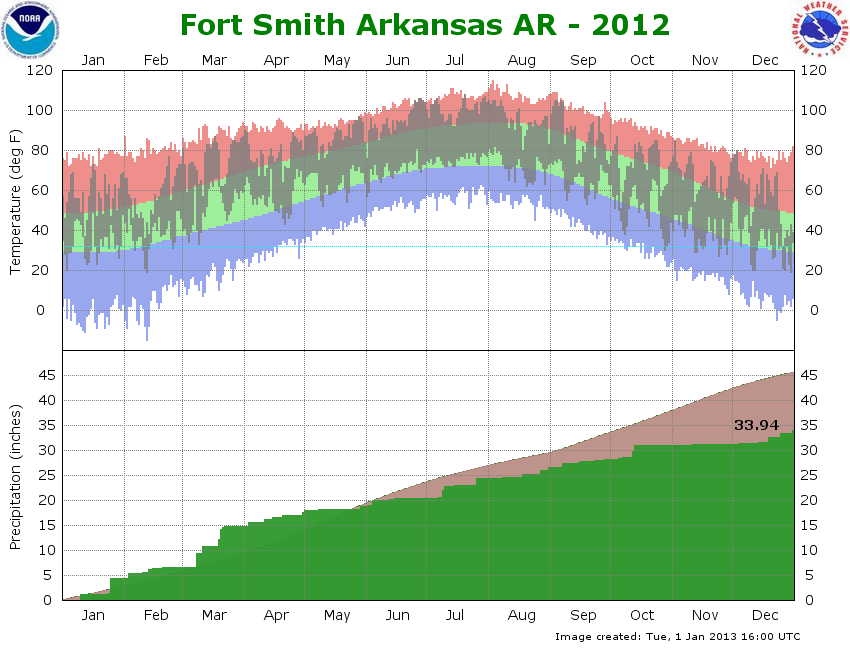
| Fort Smith, AR | 66.2°F | 61.7°F | 1st warmest | 33.94" | 45.46" | 33rd driest | 6.0" | 4.9" | 49th snowiest | ||
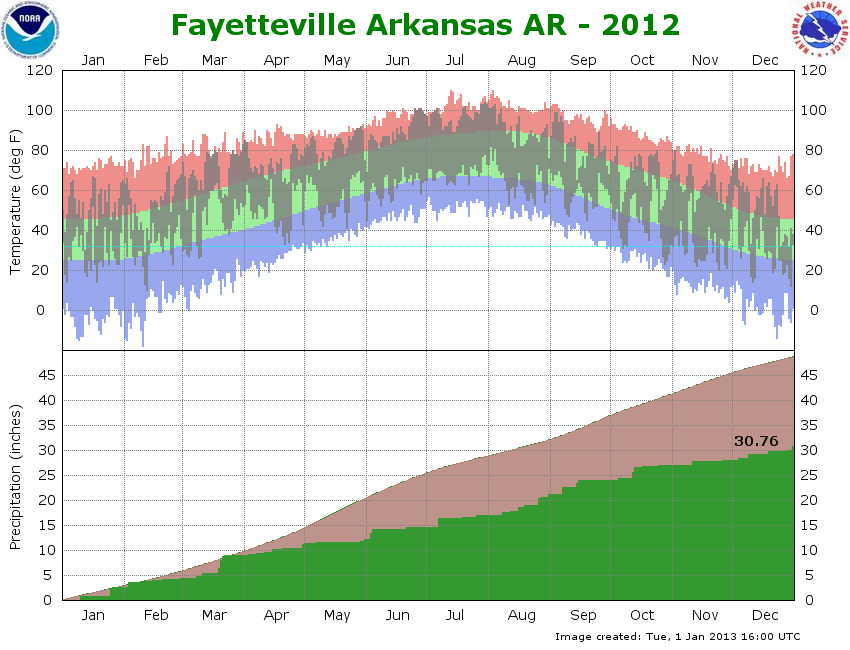
| Fayetteville, AR | 60.6°F | 57.1°F | 1st warmest | 30.89" | 48.51" | 4th driest | 1.4" | 7.0" | 7th least snowiest |
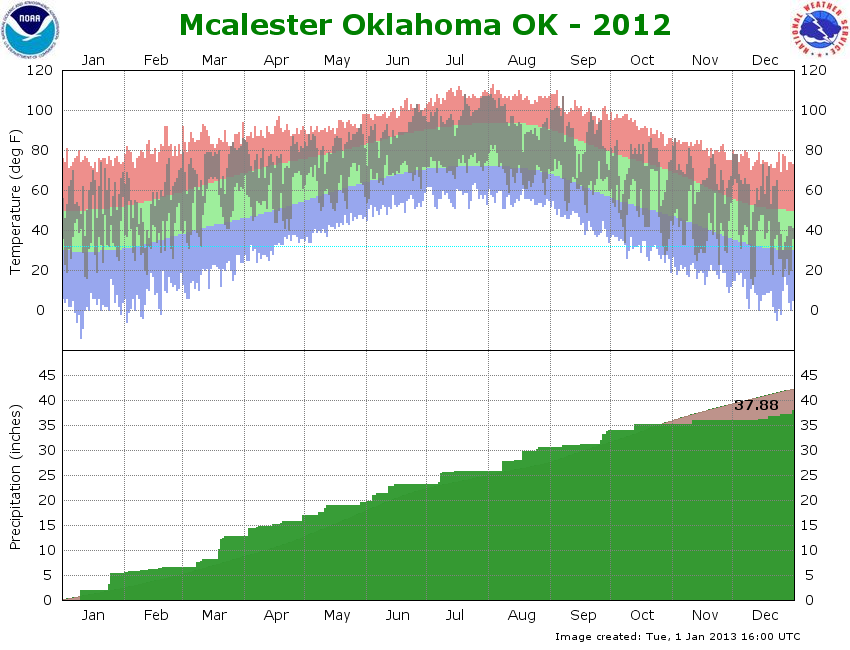
2012 Observed High/Low Daily Temperatures and Rainfall
Click on the image to open a larger version in a new window.
 |
 |
 |
 |
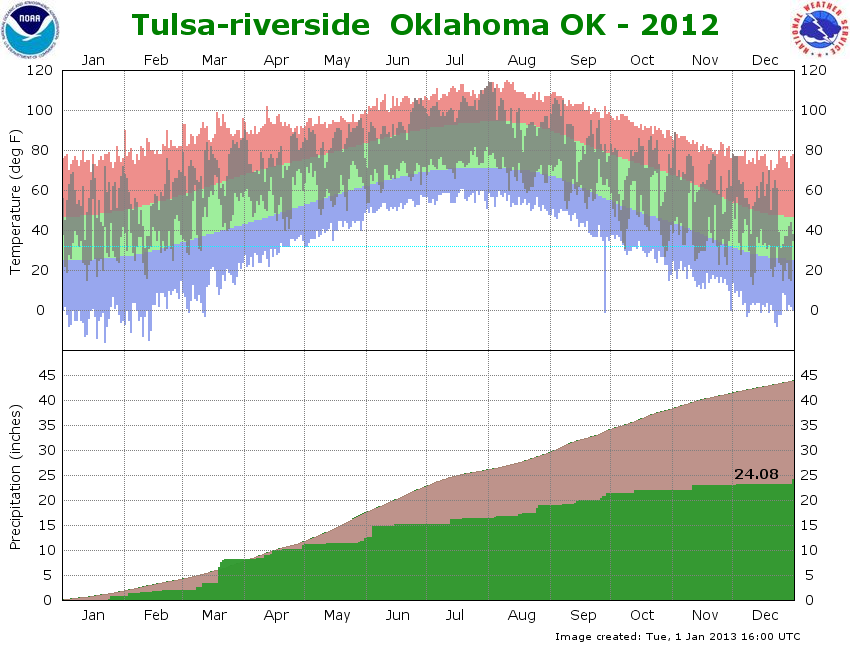 |
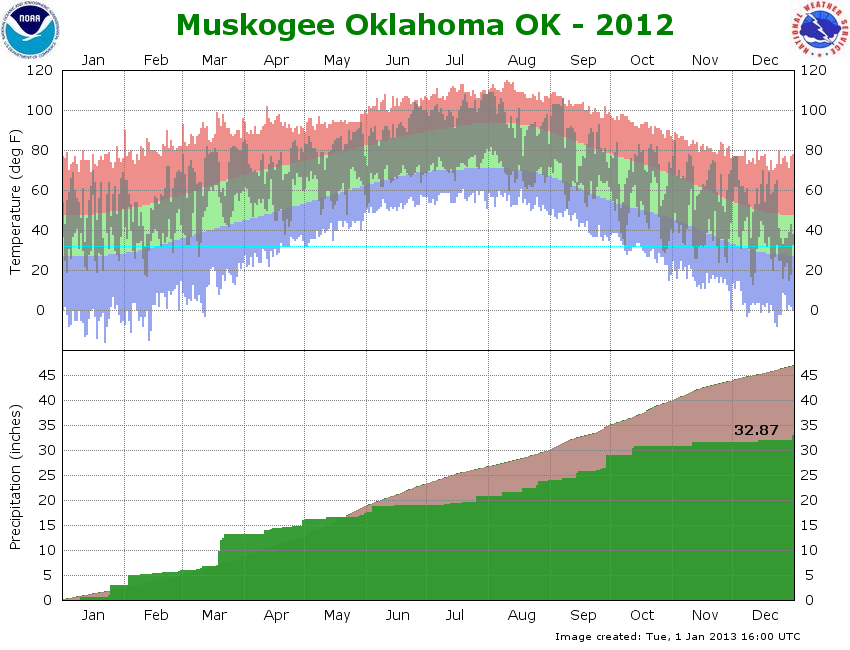 |
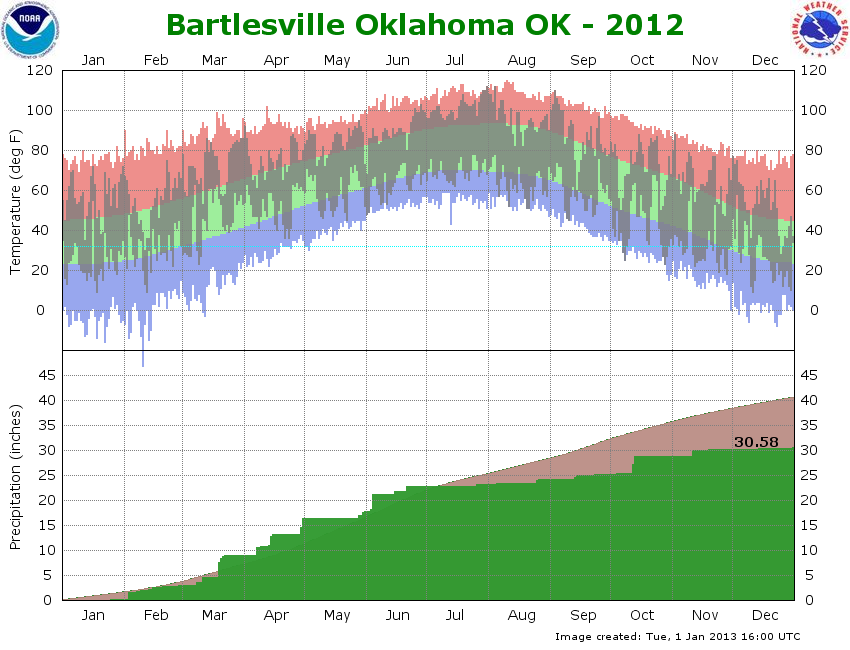 |
Monthly Temperature and Rainfall Departures from Normal for 2012
Click on month for additional monthly information. 1981-2010 Normals
| Tulsa, OK | Fort Smith, AR | Fayetteville, AR | ||||||||||||
| 2012 | Temperature | Depart from Normal | Rainfall | Depart from Normal | Temperature | Depart from Normal | Rainfall | Depart from Normal | Temperature | Depart from Normal | Rainfall | Depart from Normal | ||
| Jan | 44.2°F | +6.5°F | 0.61" | -1.05" | 45.8°F | +6.4°F | 4.42" | +1.61" | 41.2 | +5.6°F | 2.50" | -0.37 | ||
| Feb | 45.2°F | +2.9°F | 1.61" | -0.24" | 47.7°F | +3.5°F | 2.18" | -0.58 | 43.1 | +3.4°F | 1.79" | -1.02" | ||
| Mar | 61.5°F | +10.2°F | 6.24" | +2.95" | 63.6°F | +10.7°F | 8.06" | +4.21" | 57.9 | +9.8°F | 4.70" | +0.68" | ||
| Apr | 65.6°F | +5.0°F | 3.62" | -0.17" | 67.5°F | +5.9°F | 2.99" | -1.31" | 61.6 | +4.8°F | 2.15" | -2.45 | ||
| May | 74.3°F | +5.0°F | 1.18" | -4.69" | 75.8°F | +5.9°F | 1.15" | -4.32" | 69.6 | +4.5°F | 1.05" | -4.86" | ||
| Jun | 80.7°F | +3.1°F | 4.29" | -0.43 | 82.6°F | +4.8°F | 1.57" | -2.71" | 75.7 | +2.8°F | 2.29" | -2.66" | ||
| Jul | 88.9°F | +6.0°F | 1.38" | -1.98" | 88.0°F | +5.7°F | 3.91" | +0.61" | 82.8 | +5.2°F | 2.41" | -1.05" | ||
| Aug | 82.9°F | +0.7°F | 3.32 | +0.42" | 83.8°F | +1.7°F | 2.18" | -0.41" | 77.4 | +0.3°F | 4.32" | +1.08" | ||
| Sep | 75.9°F | +2.9°F | 1.78" | -2.48" | 77.3°F | +3.4°F | 1.79" | -2.26" | 70.7 | +2.2°F | 2.75" | -2.07" | ||
| Oct | 60.7°F | -1.1°F | 2.75" | -1.18" | 62.0°F | -0.8°F | 2.65" | -1.67" | 56.1 | -1.6°F | 2.98" | -1.35" | ||
| Nov | 52.6°F | +2.3°F | 1.11" | -1.70" | 53.1°F | +1.5°F | 0.29" | -4.15" | 48.0 | +0.6°F | 0.97" | -3.26" | ||
| Dec | 43.6°F | +4.1°F | 0.85" | -1.64" | 46.2°F | +4.9°F | 2.75" | -0.54" | 42.3 | +4.8°F | 2.85" | -0.39" | ||
Graphs of Average Temperature-to-Date for 2012
Click on the image for a larger version in a new window.
| Average Temperature to Date for Tulsa, OK (showing 1939-2012) Image courtesy of NCDC | ||
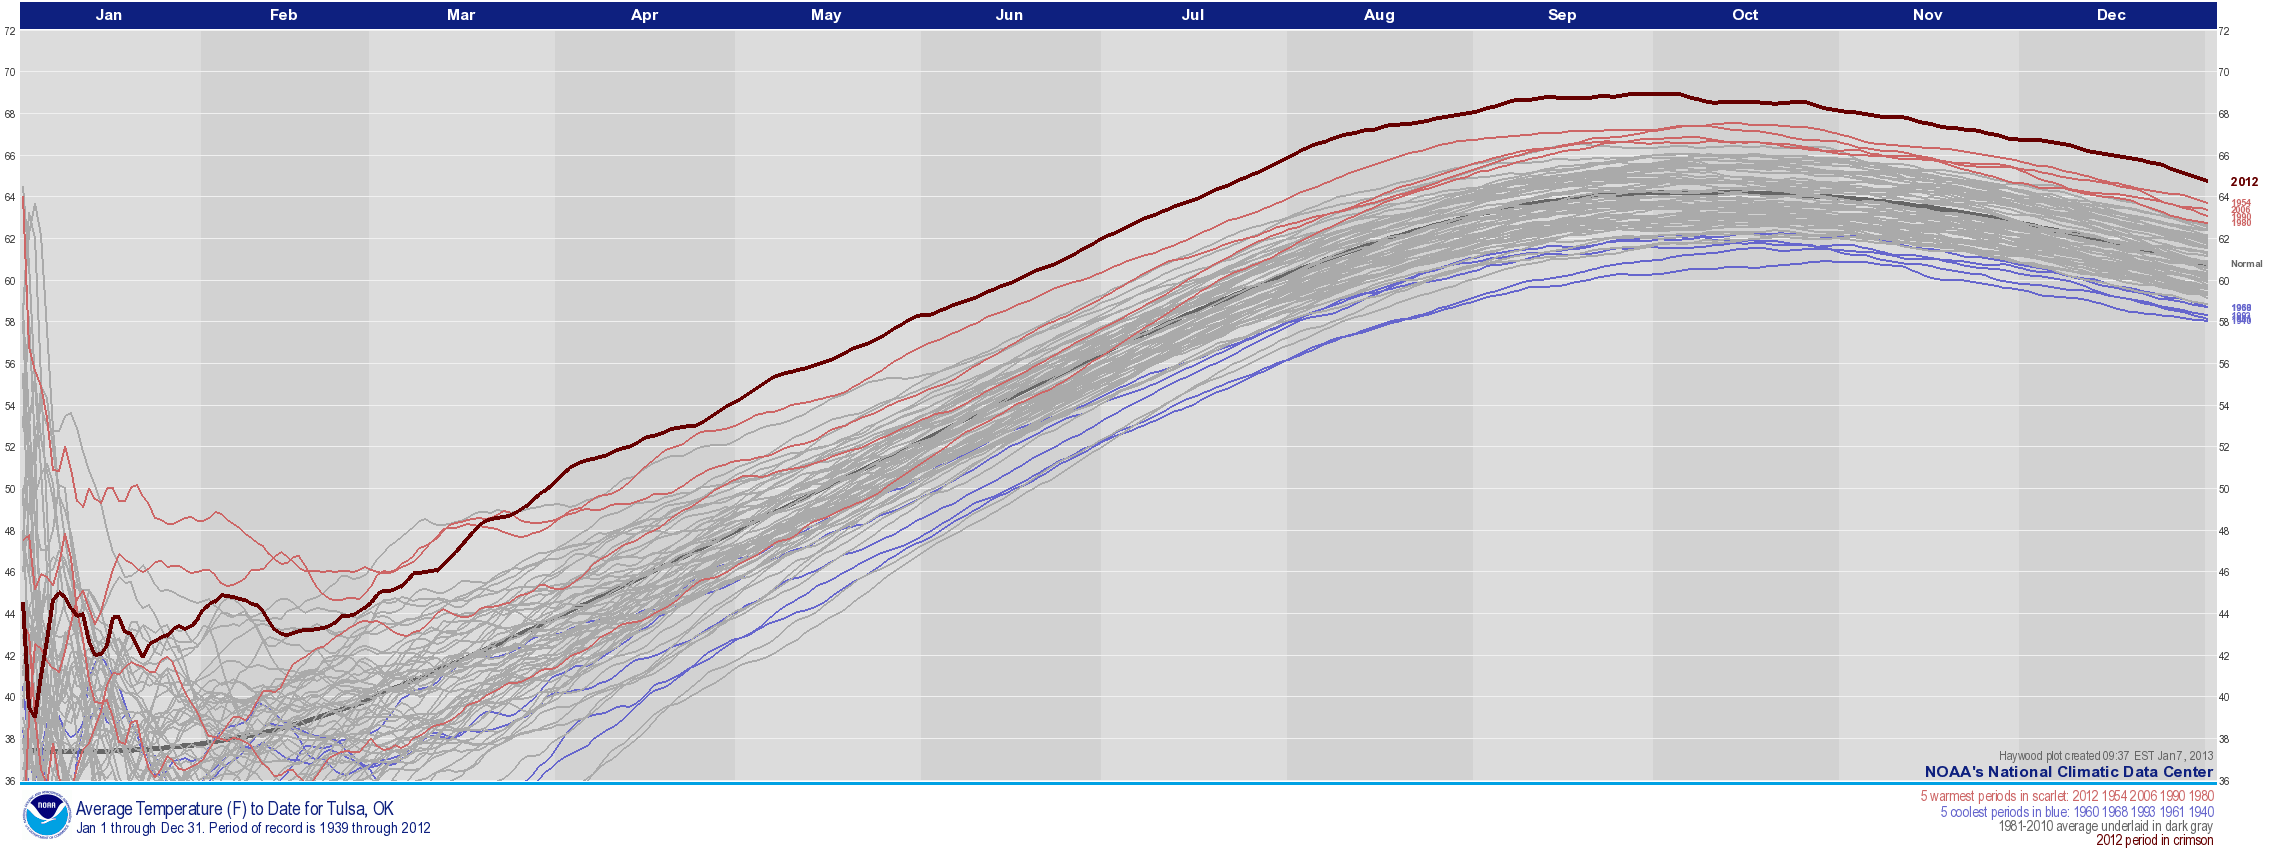 |
||
| Average Temperature to Date for Fort Smith, AR (showing 1946-2012) Image courtesy of NCDC | ||
 |
||
 |
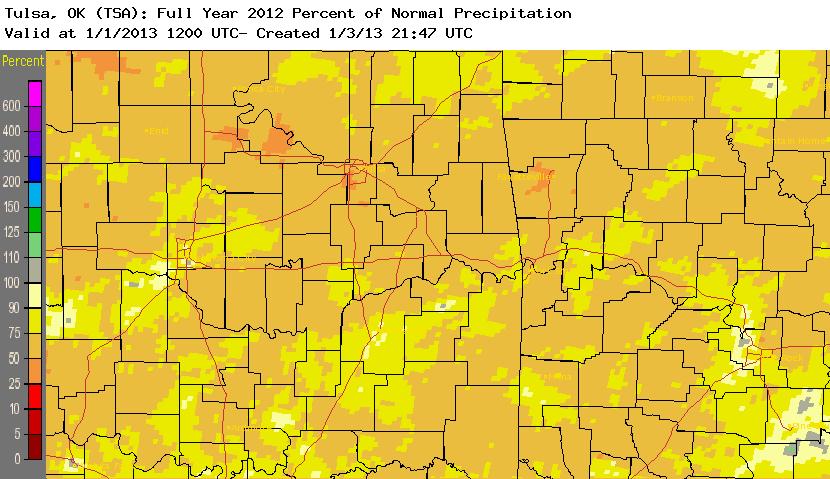 |
| 2012 Rainfall Total | 2012 Rainfall Percent of Normal |
Page last modified: January 9, 2013