From February 1-4, 1996, arctic temperatures overspread the Upper Mississippi River Valley (Table 1). The culprit was a frigid airmass which moved into the region in late January. With clear skies at night, temperatures plummeted into the 30s below zero over much of the area. This blast of arctic air set all-time record low temperatures for Iowa, Minnesota, and Wisconsin: Elkader, IA (tied the record at -47 on the 3rd); Courderay, WI (-55 on the 4th); and Tower, MN (-60 on the 4th).
The average four-day temperature in Wisconsin during the cold wave was -18.3 degrees, with an even colder -23.6 degree average in Minnesota. In Rochester, MN, temperatures stayed below zero from the morning of the 29th until midnight on the 5th (Fig. 1).
|
Location
|
2/1/1996 |
2/2/1996 |
2/3/1996 |
2/4/1996 |
|
High / Low |
High / Low |
High / Low |
High / Low |
|
|
Charles City, IA |
-5 / -23* |
-12* / -32* |
-13* / -30* |
0 / -25* |
|
Decorah, IA |
-5 / -25 |
-13* / -34 |
-13* / -41* |
1 / -36* |
|
Elkader, IA |
-5 / -23 |
-5* / -32 |
-13* / -47* |
0 / -38* |
|
Oelwein, IA |
-11* / -28* |
-20* / -31* |
-15* / -32* |
-1 / -22* |
|
Austin, MN |
-13* / -28 |
-19* / -34* |
-15* / -31* |
0 / -25* |
|
Rochester, MN |
-13* / -27 |
-20* / -35* |
-15* / -30 |
1 / -24 |
|
Winona, MN |
-4* / -20 |
-16* / -31* |
-11* / -31* |
4 / -31* |
|
La Crosse, WI |
-8 / -26 |
-13* / -34* |
-9 / -36* |
0 / -31* |
|
Prairie Du Chien, WI |
-1* / -17 |
-8* / -29 |
-11* / -36* |
0 / -31* |
|
Medford, WI |
-12* / -35* |
-5 / -37* |
-19* / -37* |
-12* / -37* |
Table 1. Listing of high and low temperatures (F) for February 1-4, 1996. The * denotes a record temperature.
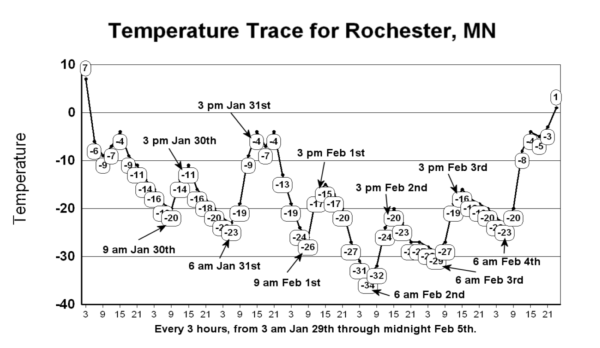 |
| Fig 1. Temperature trace (F) for Rochester, MN. |


 Weather Story
 Weather Map
 Local Radar