Upper Mississippi River Weather Summary for July 2025:
Temperatures - Near to Warmer than Normal
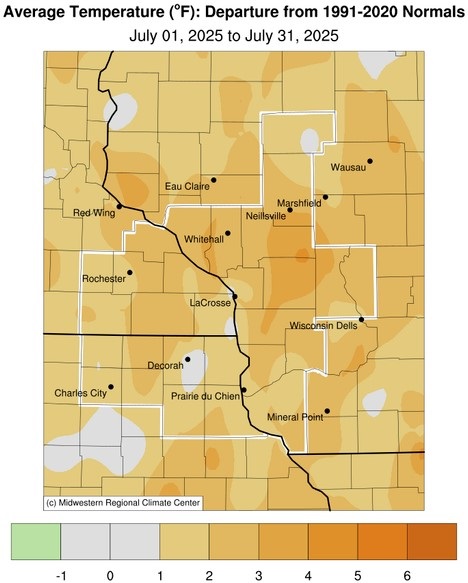
- During July 2025, average temperatures across the Upper Mississippi River Valley ranged from 69°F at Medford Taylor County Airport, WI (AWOS) to 75.8°F at Trempealeau Dam 6, WI (COOP).
- Temperature anomalies ranged from near-normal to 5°F warmer than normal.
- The hottest temperature was 94°F at La Crosse Regional Airport, WI (ASOS) on July 23 and the Black River Falls, WI (RAWS) on July 28. Meanwhile, the coldest temperature was 49°F near Steuben, WI (COOP) on July 14.
|
 |
Precipitation - Highly Variable
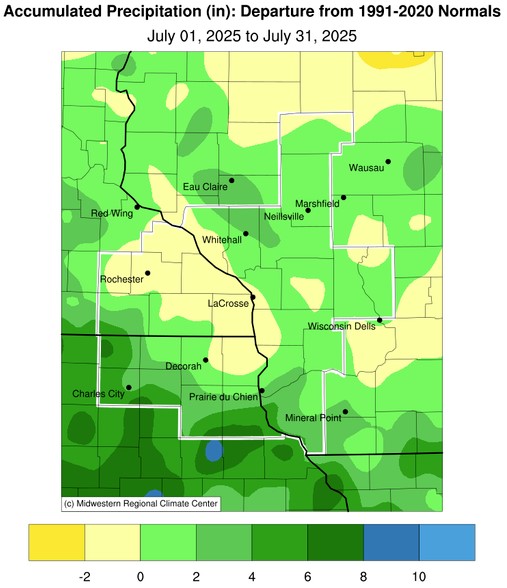
- Rainfall across the Upper Mississippi ranged from 2.43" near Elgin, MN (COOP) to 13.09" near Nashua, IA (COOP).
- Rainfall anomalies ranged 2" drier than normal to 8" wetter than normal.
- The highest 24-hour rainfall occurred near Dickeyville, WI when 5.58" of rain fell from July 11-12.
|
 |
|
Severe Weather - 11th Most Convective Warrnings (Tornado/Severe Thunderstorm/Flash Flood Warnings) for July
- During July 2025, there was 44 convective weather warnings. This was the 11th most in July. This was the most in a July since 2017 (61 warnings - 4th most). The greatest 78 warnings in 2008. The least was 1 in 1996. The long-term (1986-2025) average is 31.8 warnings.
- At least 1 convective warning was issued on 10 days in July. The greatest warnings on calendar day was 11 warnings on July 28. This was followed with 8 warnings on July 3, 7 warnings on July 2 and July 11, 4 warnings on July 27, 3 warnings on July 23, and 1 warning on July 19, July 22, July 29, and July 30.
|
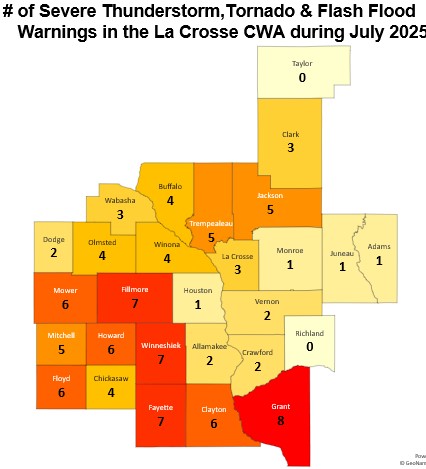 |
- There were 37 Severe Thunderstorm warnings. This was the 7th most in a July. This was the most in a July since 2023 (38 warnings). The greatest was 70 warnings in 2008. The long-term (1986-2025) average is 24.6 warnings.
- There was 1 Tornado warning. The least was 0 Tornado warnings in 1988, 1989, 1990, 1996, 2001, 2006, 2008, 2012, 2014, and 2023. The greatest was 16 warnings in 1997. The long-term (1986-2025) average is 3 warnings.
- There were 6 Flash Flood warnings. This was tied for the 9th most in a July with 1993 and 2024. The least was 0 waarnings in 1986, 1988, 1989, 1992, 1994-96, 1998, 2001, 2012-15, 2018, 2021, and 2023. The greatest was 19 warnings in 1999. The long-term (1986-2025) average is 4 warnings.
|
Below are the July 2025 climate summaries for La Crosse, WI, and Rochester, MN.
La Crosse, WI
July 2025 was Warmer and Wetter than Normal at La Crosse, WI
...July 2025 Highlights...
Temperatures - Slightly Warmer than Normal
- The average temperature at La Crosse Regional Airport was 75.7°F. This was 0.7°F warmer than the 1991-2020 normal of 75°F. 8 out of the last 10 Julys were among the warmest third of Julys. The other 2 were near normal.
- The average high temperature was 85°F. This was 0.4°F cooler than the 1991-2020 normal of 85.4°F.
- The average low temperature was 66.5°F. This was 2°F warmer than the 1991-2020 normal of 64.5°F. This was tied for the 15th warmest with 2002.
- The hottest temperature was 94°F on July 23.
- The coldest high temperature was 74°F on July 17.
- The warmest low temperature was 73°F on July 5 and July 22.
- The coldest low temperature was 55°F on July 17.
- The temperature was at or above 90°F on 6 days. The long-term average (1873-2025) is 6.2 days.
- A 31-day stretch with temperatures above 60-degrees ended on July 15. This streak began on the first day of summer (June 15). This was the 12th longest. The longest stretch was a 43-day stretch in 1921 (June 7-July 19) and 2018 (June 5-July 17).
|
Precipitation - Wetter than Normal
- A total of 4.64" of rain fell at La Crosse Regional Airport.
- This was 0.41" wetter than the 1991-2020 normal of 4.23".
- The wettest day was July 16 when 2.21" of rain fell.
- Rain fell on 15 days (measurable fell on 11 days and a trace fell on 4 days).
Mississippi River - 9th Highest 7 AM Average Stage
- During July 2025, the average 7 AM stage for the Mississippi River at La Crosse was 8.42 feet.
- This was 2.13 feet higher than the 1937-2025 long-term average of 6.29 feet.
- This was the 9th highest average for July.
- Last year, was the second highest for a July at 11.12 feet.
- The highest 7 AM July average was 11.61 feet in 1993.
- The highest daily 7 AM stage for this past month was 9.77 feet on July 3. Meanwhile, the lowest 7 am daily stage for this past month was 7.51 feet on July 22.
- The daily 7 AM stage was above the long-term average on all 31 days.
...June 2025 Records...
Daily Records...
...Looking ahead to August...
- The normal high temperature in La Crosse starts at 85°F on August 1st and falls to 81°F by the end of the month. The normal low temperature starts at 64°F on the 1st and falls to 60°F by the end of the month. The normal mean temperature for the month is 72.8°F. La Crosse’s hottest August occurred in 1947 with an average temperature of 78.3°F, and their coldest August happened in 1927 and 1915 with an average temperature of 64.8°F.
- For August, the hottest temperature recorded was 105°F on August 1, 1988, and the coldest temperature was 35°F on August 30, 1915. There are typically 4 days with temperatures at or above 90°F.
- The average precipitation for August is 3.90". The wettest August occurred in 2007 when 13.75" of rain fell, and the driest occurred in 1894 when 0.35" of rain fell. The wettest August day was 4.05" on August 18, 2007. Normally, there are 6 days with thunderstorms.
- Valley fog is quite prevalent in the area. On average, this fog reduces the visibility to a quarter-mile or less at the airport on 3 days.
Rochester, MN
July 2025 was Warmer and Drier than Normal at Rochester MN
...July 2025 Highlights...
Temperatures - Warmer than Normal
- The average temperature at Rochester International Airport was 72°F.
- This was 1.5°F warmer than the 1991-2020 normal of 70.5°F.
- 8 out of the last 10 Julys were near normal.
- The average high temperature was 81.1°F. This was 0.8°F warmer than the 1991-2020 normal of 80.3°F.
- The average low temperature was 63°F. This was 2.2°F warmer than the 1991-2020 normal of 60.8°F. This was tied for the 13th warmest with 1983.
- The hottest temperature was 88°F on July 23.
- The coldest high temperature was 71°F on July 17.
- The warmest low temperature was 72°F on July 4 and July 22.
- The coldest low temperature was 51°F on July 17.
- The temperature never reached or exceeded 90°F. The long-term average (1886-2025) is 4.2 days.
- A 23-day stretch with temperatures above 60-degrees ended on July 12. This streak began on the first day of summer (June 20). This was the 2nd longest. The only longer stretch of days was 26 days in 1955 (July 12-August 6).
|
Precipitation - Drier than Normal
- A total of 3.33" of rain fell at Rochester International Airport.
- This was 0.86" drier than the 1991-2020 normal of 4.19".
- The wettest day was July 23 when 0.99" of rain fell.
- Rain fell on 19 days (measurable fell on 15 days and a trace fell on 4 days).
...June 2025 Records...
...Looking ahead to August...
- The normal high temperature in Rochester falls from 79°F on August 1st to 76°F by the end of the month. The normal low temperature falls from 60°F on the 1st to 56°F by the end of the month. The normal mean temperature for the month is 68.2°F. Rochester’s hottest August occurred in 1947 with an average temperature of 77°F, and their coldest August occurred in 1992 with an average of 63.1°F.
- For August, the hottest temperature recorded was 100°F on August 3, 1930, August 15, 1936, August 4, 1947, August 23, 1948, and August 24, 1948, and the coldest temperature was 32°F on August 30, 1915. Normally, there is only 1 day with temperatures at or above 90°F.
- The average precipitation for August is 4.12". The wettest August occurred in 2007 when 14.07" of rain fell and the driest occurred in 1941 when 0.31" of rain fell. The wettest August day was 5.16" on August 18, 2007. Normally, there are 6 days with thunderstorms.

