Upper Mississippi River Climate Summary for Meteorological Summer 2025:
|
|
|
 |
Precipitation - Near to Wetter than Normal
|
 |
Below are the climate summaries for the 2025 meteorological summer in La Crosse, WI and Rochester, MN
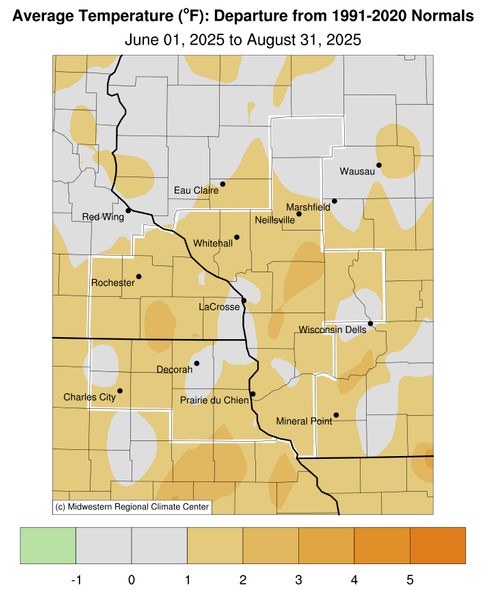
The 2025 meteorological summer (June 1 through August 31) was drier than normal with near normal temperatures. More details on these statistics can be found below.
|
Temperatures - Near Normal
|
The table below provides a breakdown of the temperature departures from normal for La Crosse WI this summer...
Summer 2025 Temperatures
in La Crosse WI
Departure from
Normal
--------------
June Avg Temp 71.6°F +0.6°F
Avg Max Temp 81.2°F -0.5°F
Avg Min Temp 62.0°F +1.6°F
July Avg Temp 75.7°F +0.7°F
Avg Max Temp 85.0°F -0.4°F
Avg Min Temp 66.5°F +2.0°F
August Avg Temp 71.0°F -1.8°F
Avg Max Temp 80.7°F -2.5°F
Avg Min Temp 61.4°F -0.9°F
Summer Avg Temp 72.8°F -0.1°F
Avg Max Temp 82.3°F -1.2°F
Avg Min Temp 63.3°F +0.9°F
Other temperature tidbits this summer...
Precipitation - Slightly Drier than Normal
The table below contains the monthly rainfall totals and their departures from normal for this summer.
Summer 2025 Rainfall
in La Crosse WI
Departure
Month Rain Total from Normal
----- ---------- -----------
June 6.27 inches +1.19 inches
July 4.64 inches +0.41 inches
August 2.83 inches -1.07 inches
Summer 13.74 inches -0.53 inches
Other rainfall tidbits this summer...
Measurable rain fell on 36 days (39.1%) and trace amounts fell on another 11 days (12%).
Sky...
Sea Level Pressure...
Winds...
The 2025 meteorological summer (June 1 through August 31) was warmer and wetter than normal for Rochester, MN. More details on these statistics can be found below.
|
Temperatures - Warmer than Normal
The table below provides a breakdown of the temperature departures from normal for Rochester MN this summer... Summer 2025 Temperatures Departure from July Avg Temp 72.0°F +1.5°F August Avg Temp 68.3°F +0.1°F Avg Max Temp 79.2°F +0.6°F |
Other temperature tidbits this summer...
Precipitation - 18th Wettest
During the meteorological summer, Rochester International Airport received 16.52" of rain.
This was 2.86" wetter than the 1991-2020 normal of 13.66".
This was the 18th wettest summer and wettest since 2019 (18 inches - 12th wettest). 8 out of the 18 wettest summers have occurred since 2000. Below are the 20 wettest meteorological summers in Rochester, MN.
Wettest Meteorological Summers
in Rochester MN
1886-2025
Rank Rainfall Year
---- -------- ----
1 23.34 inches 2000
2 22.86 inches 1990
3 20.36 inches 1981
4 19.87 inches 1978
5 19.54 inches 2024
6 19.32 inches 1993
7 19.14 inches 2007
8 18.90 inches 1942
9 18.70 inches 1999
10 18.23 inches 1938
11 18.20 inches 1951
12 18.00 inches 2019
13 17.84 inches 2002
14 17.04 inches 1935
15 16.80 inches 1952
16 16.58 inches 2016
17 16.56 inches 2004
18 16.52 inches 2025
19 16.49 inches 2010
20 16.24 inches 1914
The table below contains the monthly rainfall totals and their departures from normal for this summer.
Summer 2025 Rainfall
in Rochester MN
Departure
Month Rain Total from Normal
----- ---------- -----------
June 6.38 inches +1.03 inches
July 3.33 inches -0.86 inches
August 6.81 inches +2.69 inches - 7th wettest
Summer 16.52 inches +2.86 inches - 18th wettest
Other rainfall tidbits this summer...
Measurable rain fell on 40 days (43.5%) and trace amounts fell on another 11 days (12%).
Sky...
Sea Level Pressure...
Winds...


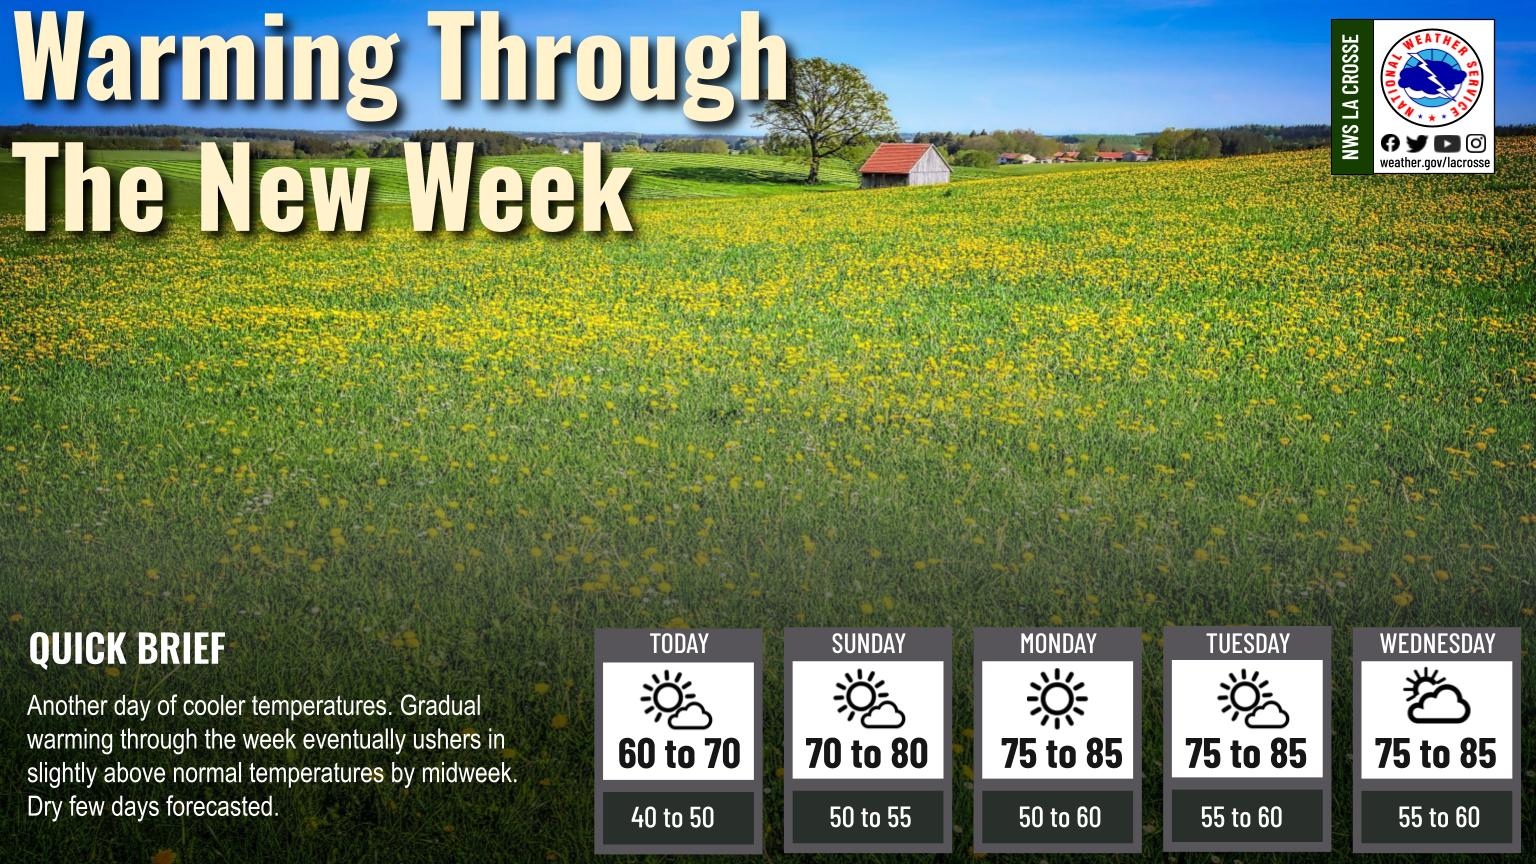 Weather Story
 Weather Map
 Local Radar