EF0 Tornado Southwest of Richfield, Wisconsin (far southern Washington County) on Wednesday, May 9, 2018
|
A thunderstorm moved through far southern Washington County during the middle afternoon hours on Wednesday, May 9, 2018. The storm developed strong low level rotation, which prompted a Tornado Warning for southeastern Washington County at 4:54 PM CDT. Reports of a tornado were received at 4:58 PM CDT 3 miles southwest of Richfield in far southern Washington County. Public Information Statement National Weather Service Milwaukee/Sullivan WI 349 PM CDT Thu May 10 2018 ...NWS DAMAGE SURVEY FOR 05/09/2018 TORNADO EVENT... OVERVIEW...A tornado devleoped near Richfield Wisconsin on Wednesday evening. It tracked from west to east across southern Washington County. The tornado primarily caused tree damage. There was minimal structural damage observed. .Richfield Tornado... Rating: EF-0 Estimated peak wind: 80 mph Path length /Statute/: 5.27 miles Path width /Maximum/: 50 yards Fatalities: 0 Injuries: 0 Start date: May 9 2018 Start time: 450 PM CDT Start location: 5 NNW Merton Start Lat/Lon: 43.2091 / -88.3449 End date: May 9 2018 End time: 501 PM CDT End location: 1 S Richfield End_lat/lon: 43.2217 / -88.2427 NOTE: The information in this statement is PRELIMINARY and subject to change pending final review of the event and publication in NWS Storm Data. $$ |
|
Tornadoes:
|
Tornado - Merton to Richfield, WI
Track Map   |
||||||||||||||||||||||||||||||||||||||||
|
||||||||||||||||||||||||||||||||||||||||
The Enhanced Fujita (EF) Scale classifies tornadoes into the following categories:
| EF0 Weak 65-85 mph |
EF1 Moderate 86-110 mph |
EF2 Significant 111-135 mph |
EF3 Severe 136-165 mph |
EF4 Extreme 166-200 mph |
EF5 Catastrophic 200+ mph |
 |
|||||
Radar:
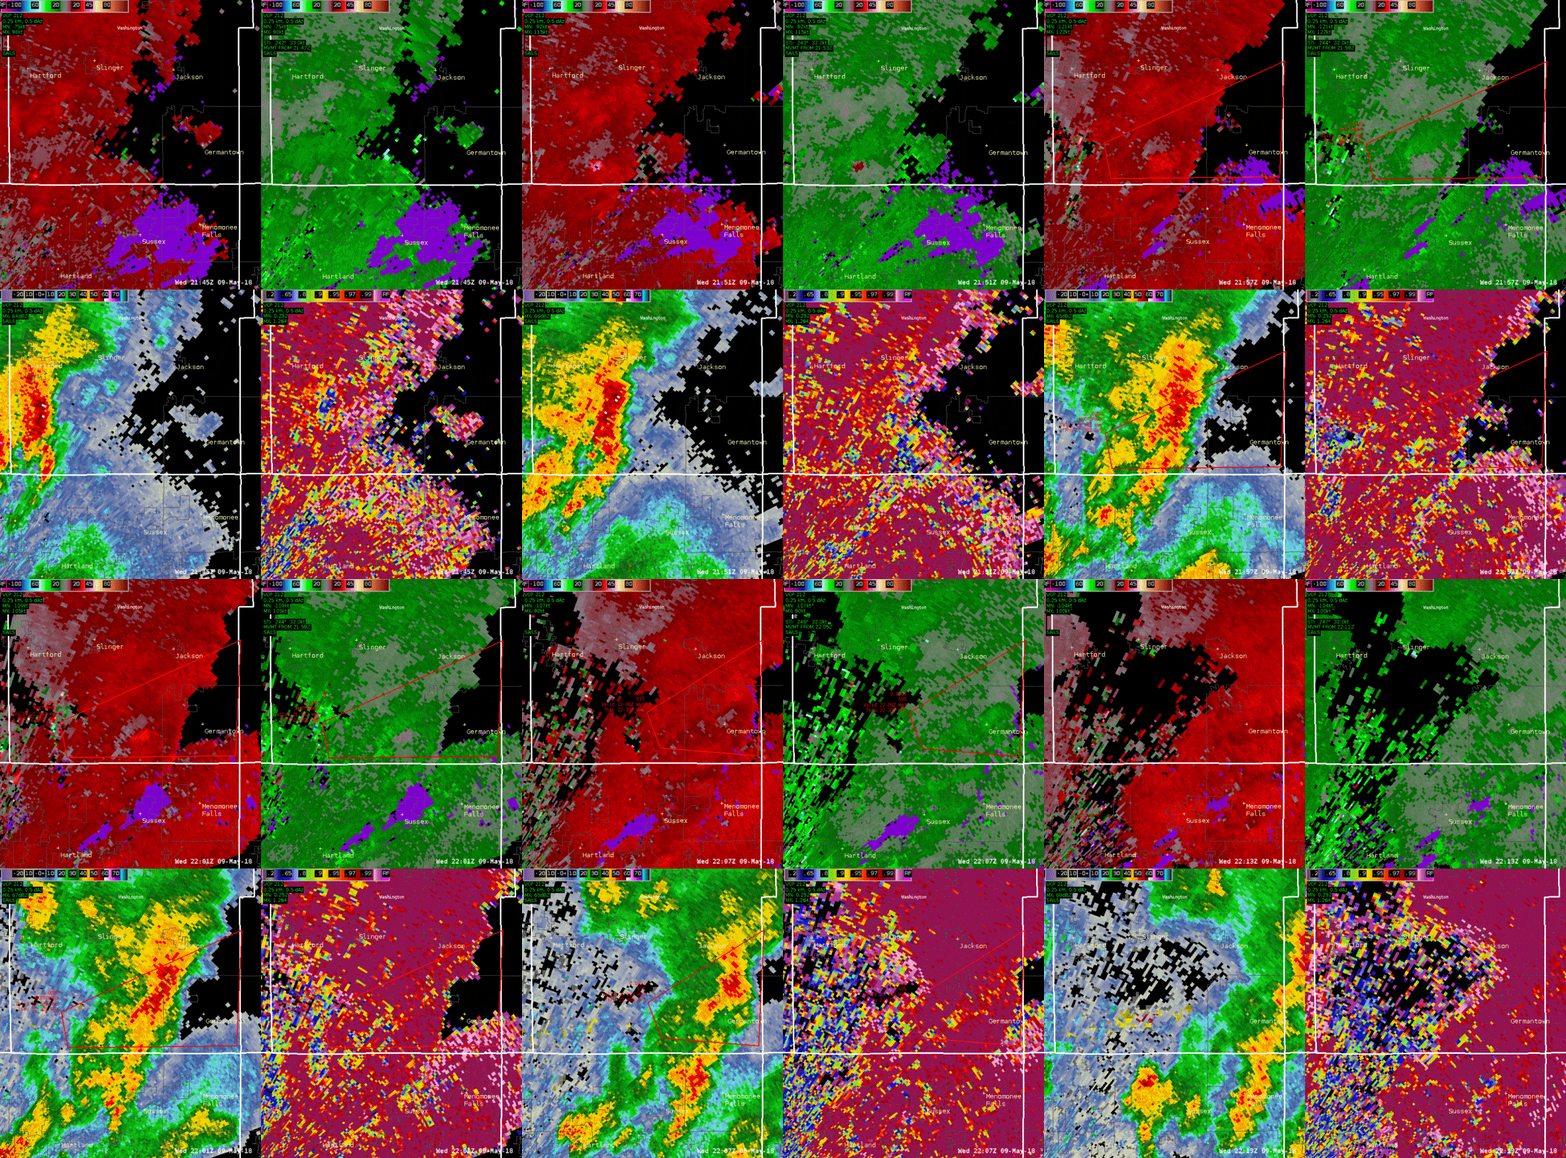
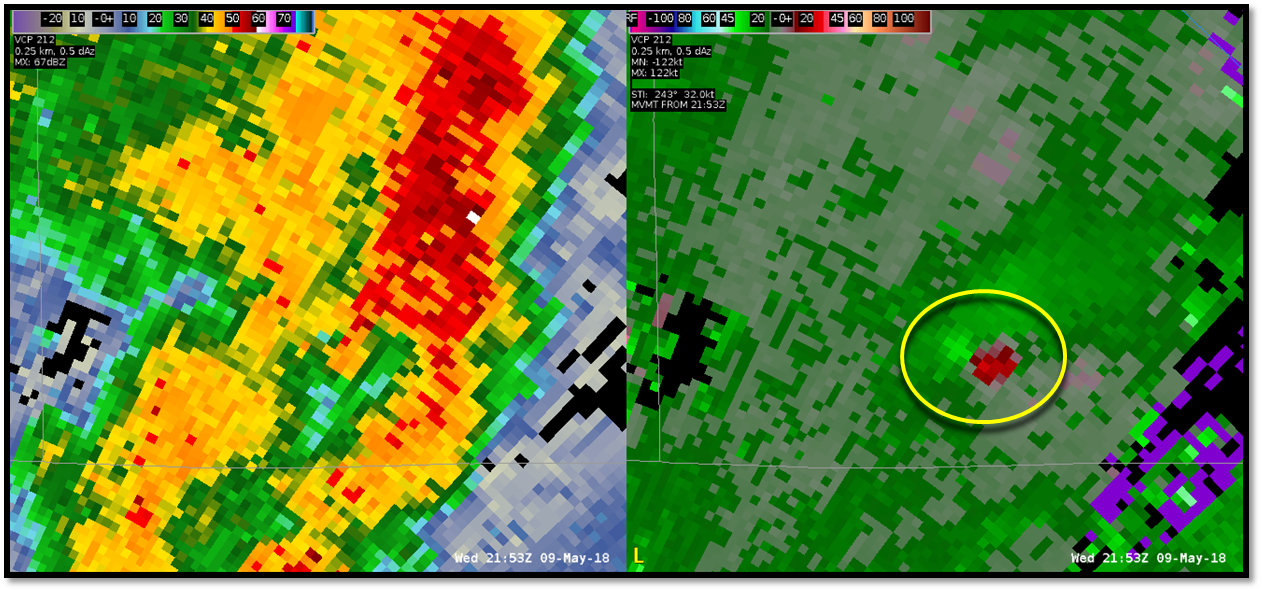
Here is an animated 4 panel radar image, and a still image at 4:53 PM CDT, for the tornado in far southern Washington County from Wednesday, May 9, 2018:
 |
 |
| Here is an animated 4 panel radar image, between 4:45 PM CDT and 5:13 PM CDT, of the storm that produced the tornado in far southern Washington County on Wednesday afternoon, May 9, 2018. The top left image is base velocity, the top right image is storm relative velocity, the bottom left image is base reflectivity, and the bottom right image is correlation coefficient. Note the circled areas at 4:55 PM CDT in each image. The top two images show the rotation in the storm that produced the tornado. Note the brighter greens and reds next to each other in those images, indicating the rotation. The bottom left image shows the small "hook" in the base reflectivity, indicating possible rotation. The bottom right image shows that there is debris being lofted by the tornado, as shown by the blues and yellows in the circle. This is called a Tornado Debris Signature, or TDS, and is confirmation that a tornado producing damage is occurring! This is a great tool for meteorologists to confirm that tornado damage is occurring, as the event unfolds. |
This image at 4:53 PM CDT shows base reflectivity on the left, and storm relative velocity on the right. Note the small "hook" on the reflectivity image, indicating possible rotation. In the same area, note the brighter greens and reds next to each other in the storm relative velocity image (circled). This indicates the rotation within the storm. This circulation was about 1,300 feet above ground level, in far southern Washington County. The Tornado Warning was issued at 4:54 PM CDT. |
 |
Media use of NWS Web News Stories is encouraged! Please acknowledge the NWS as the source of any news information accessed from this site. |
 |