Precipitation Departures From Normal Along the Northwest Gulf Coast During Several Strong El Niño Events
by
Robert Darby* and Ray Sondag*
WFO Lake Charles, Louisiana
Introduction:
During a normal non-El Niño year the trade winds blow east to west over the equatorial Pacific. With this wind field orientation, warm surface water in the equatorial region is transported to the western Pacific. (The sea surface is about ½ meter higher at Indonesia than at Ecuador). This creates a "warm pool" over the western Pacific ocean. To compensate for this water transport, colder water from beneath the ocean surface up-wells in the eastern Pacific. With the warmer water located over the western Pacific and colder water over the eastern Pacific, a large scale atmospheric circulation is produced (Figure 1). Descending air occurs over the colder eastern waters and subsequently, rising air is observed in the western Pacific. Rainfall occurs frequently in the western Pacific due to the rising air and conversely, the eastern Pacific receives limited rainfall due to atmospheric subsidence. This is evident by the arid conditions experienced over equatorial South America during a non-El Niño year.
An El Niño / ENSO event is characterized as the warming of ocean temperatures in the eastern and central equatorial Pacific. ENSO is short for El Niño Southern Oscillation. During an El Niño / ENSO event, the trade winds weaken and during a strong El Niño may reverse direction. This change in the wind field pattern greatly reduces or stops the westward transport of water and thus the degree of cold water up-welling over the eastern Pacific (Figure 2). With the lack of up-welling, waters over the central and eastern Pacific begin to warm. Now with the relatively warmer waters, the large scale atmospheric circulation shifts eastward, causing rainfall to increase across the eastern Pacific.
This disruption in the ocean-atmosphere system can have significant meteorological consequences across the globe. In the winter months, the northern tier of the United States experiences significantly warmer than normal temperatures, while the southern portion has slightly cooler temperatures. One of the most pronounced effects of El Niño is the increased rainfall experienced along the gulf coast states from Texas to Florida. Precipitation departures from normal will be examined specifically along the northwest gulf, for Lake Charles, Louisiana and Beaumont, Texas.
El Niño / ENSO Events:
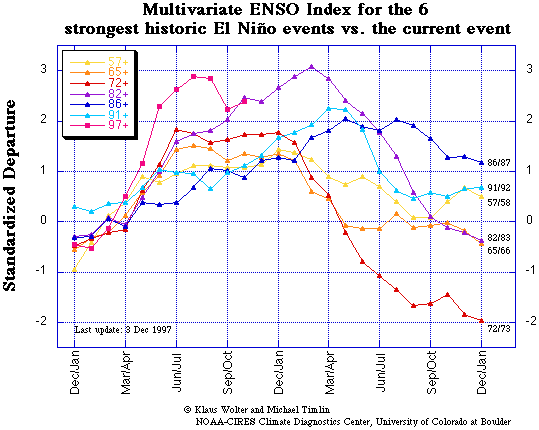
Since 1951, six strong El Niño events have occurred: 1957-58, 1965-66, 1972-73, 1982-83, 1986-87 and 1991-92. Figure 3 graphs the multi-variate ENSO Index (MEI) for each of the six El Niño events over a two year period (Wolter and Timlin, 1997). The MEI is a good indicator of the strength of an El Niño / ENSO event. It not only takes into account sea surface temperature, but also other variables that help drive the coupled ocean-atmospheric system. Other variables include, sea-level pressure, the east-west and north-south components of the surface wind, surface air temperature, and the total amount of cloudiness. The index uses a weighted average for the six variables with positive MEI values indicating an El Niño event.

figure 3
Each of the six El Niño events started in the months of January / February, strengthening throughout the first year and then peaking the following year. Some events began to decline by the first part of the second year (1957-58, 1965-66 and 1972-73), while the most recent events continued into the spring (1982-83, 1986-87 and 1992-93). The current El Niño increased in strength very rapidly over the first part of the 1997 and has rivaled the 1982-83 event. As of late, this rapid intensification seen earlier has peaked and has now made a downward turn to +2.84 on the MEI. It is still uncertain what the overall trend will be through the winter months, but it is becoming increasing less likely that it will re-strengthen to surpass the 1982-83 El Niño to become the overall strongest on record.
Lake Charles and Beaumont Precipitation Departures From Normal:
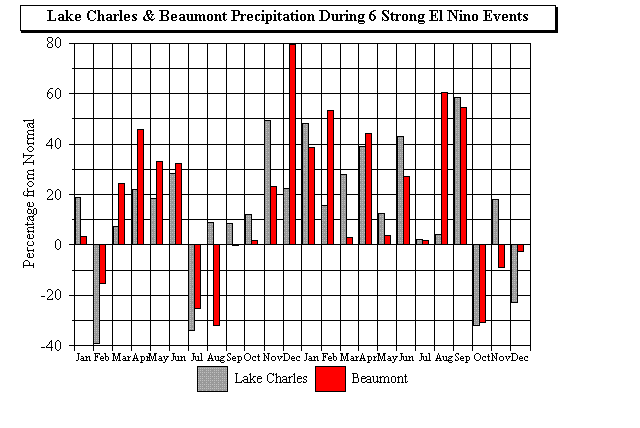
Monthly precipitation totals for Lake Charles and Beaumont were examined for each of the six El Niño events. The totals were averaged and then compared to the 30 year normal for each month (Figure 4). Above normal precipitation occurred for a large majority of the two year period, with only a few months showing below normal precipitation. The 12 month period, starting in September (first year), all showed precipitation anomalies ranging from 5% to 80% above normal. During this time period the El Niño events on average were at their strongest, suggesting a correlation between the strength of the El Niño event and above normal precipitation. Overall, during the 24 month period, Lake Charles had approximately 14% above normal precipitation, while Beaumont had 17% above normal precipitation.

figure 4
By the end of the second year, most of the El Niño events had already declined, with some events trending toward the beginning of a La Niña (the opposite of an El Niño). During this time period precipitation at Lake Charles and Beaumont began to decrease, with the months of October and December receiving below normal precipitation.
Conclusions:
There is a possible correlation between precipitation along the northwest gulf coast and strong El Niño events. Lake Charles and Beaumont have historically observed a significant increase in precipitation from normal, especially during the strongest periods of an El Niño event. If the current El Niño holds true to form, residents living in southeast Texas and southern Louisiana should expect above normal precipitation through the remainder of the winter months into the spring and summer of 1998.
It should be noted this study only examined precipitation amounts for these two specific sites. Other locations along the gulf coast may show different results for these cases. Also, only the strongest EL Niño events from the past 50 years were used for this study.
Scientists are now able to better measure the strength of the El Niño / ENSO through satellite data, ocean buoys and ship reports, but there are still large uncertainties in forecasting the strength, duration and frequency of these events and their effects globally. Further research on the El Niño / ENSO and its influence on climate will need to be carried out in the future.
REFERENCES
Wolter, K., and M.S. Timlin, 1997: A multi-variate ENSO index in COADS. NOAA-CIRES Climate Diagnostics Center, University of Colorado at Boulder. To be submitted.
ACKNOWLEDGMENTS
Figures 1& 2 provided by The Tropical Atmospheric-Ocean (TAO) Project office - NOAA / Pacific Marine Environment Laboratory
*Authors' current affiliation: National Weather Service, Tulsa OK
|