|
Upper Mississippi River Valley Temperatures - Near to Above Normal
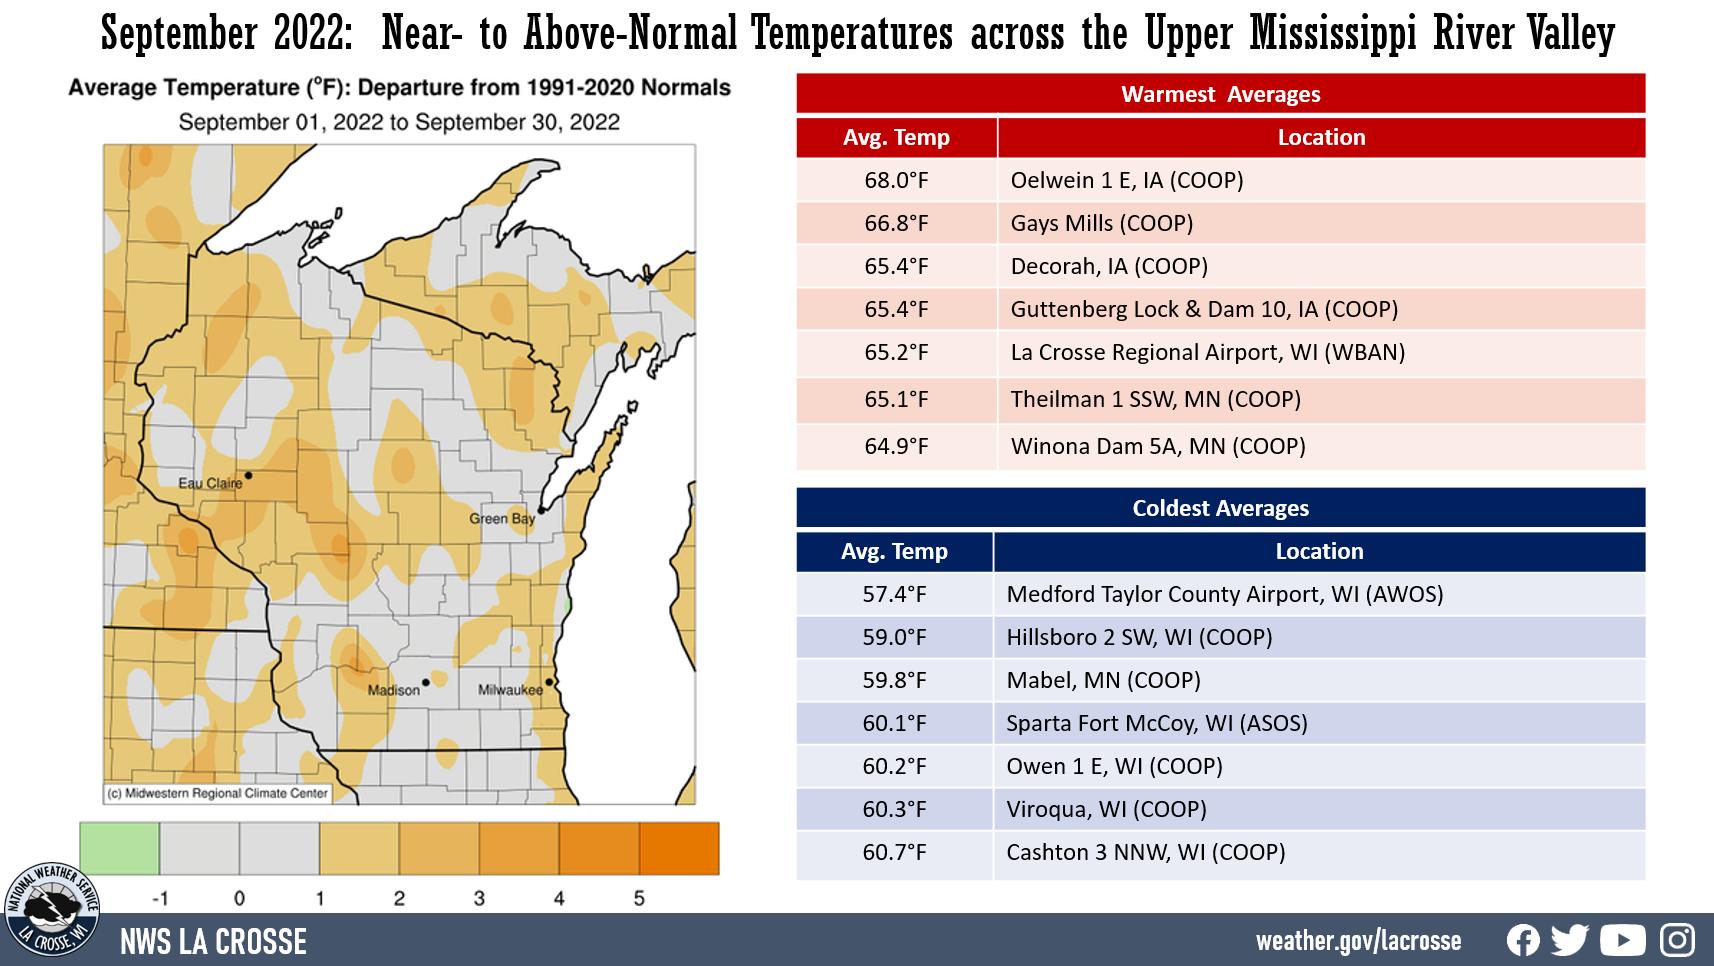
During September 2022, temperatures averaged near- to above-normal across the Upper Mississippi River Valley. Monthly average temperatures ranged from 57.4°F at Medford Taylor County Airport, WI (AWOS) to 68°F near Oelwein, IA (COOP). Temperature anomalies ranged from near normal to 4°F warmer-than-normal. The hottest temperature was 98°F near Oelwein, IA (COOP) on September 21 and the coldest temperature was 24°F at Medford Taylor County Airport, WI (AWOS) on September 28.
|
 |
|
Upper Mississippi River Valley Precipitation Summary - Mainly Drier-than-Normal
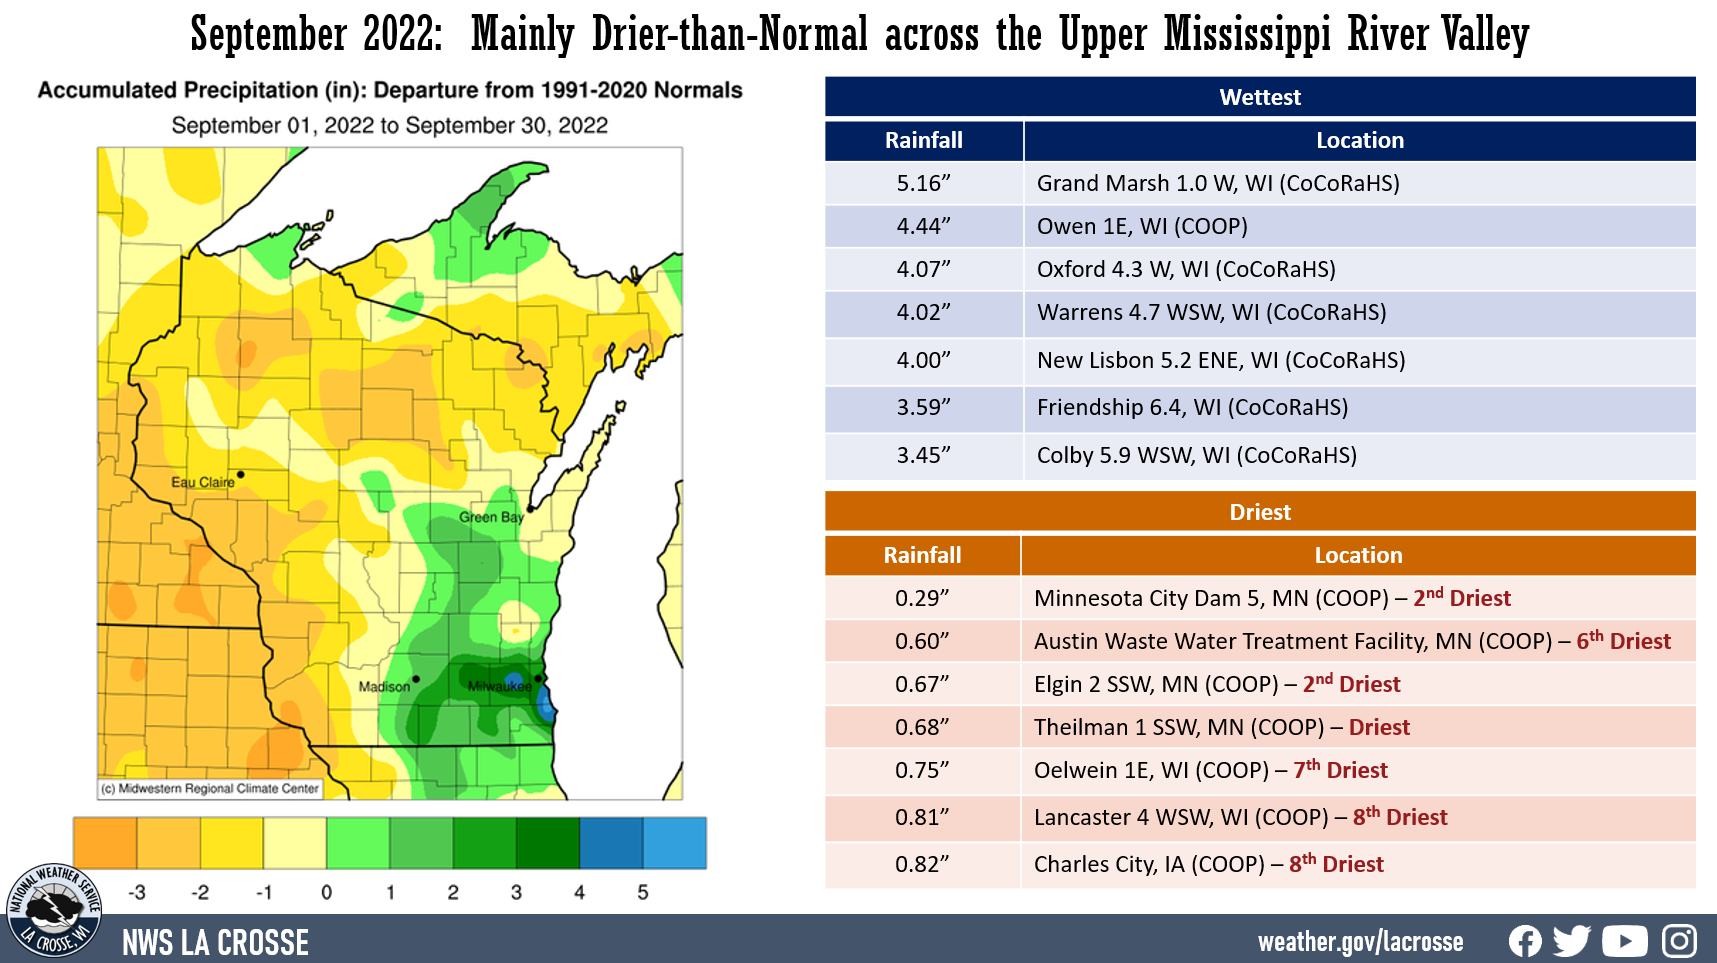
September was mainly drier-than-normal across the Upper Mississippi River Valley. Rainfall anomalies ranged from near normal to 4” drier-than-normal across the Upper Mississippi River Valley. Rain totals ranged from 0.29” at Minnesota City Dam 5, MN (COOP) to 5.16” just west of Grand Marsh, WI (CoCoRaHS). The greatest 1-day rainfall was 3.88" near Owen, IA (COOP). This rain fell from 7 AM on September 19 to 7 AM on September 20.
|
 |
Several COOP observers’ rainfall totals were among their 10 driest for the month of September. This included Theilman 1SSW, MN which had their driest September with just 0.68” of rain. Their previous record was 0.78” in 1953. Their precipitation records date back to 1938. The following table contains those COOP stations that had one of their driest Septembers.
|
COOP Stations in which September 2022 was One of Their Driest Septembers
|
|
Location
|
2022 Rainfall
|
Rank
|
Driest
|
Records Began
|
|
Minnesota City Dam 5A, MN
|
0.29”
|
2nd
|
0.18” in 1952
|
1939
|
|
Austin Waste Water Treatment Facility, MN
|
0.60”
|
6th
|
0.39” in 1940
|
1937
|
|
Elgin 2 SSW, MN
|
0.67”
|
2nd
|
0.48” in 1979
|
1939
|
|
Theilman 1 SSW, MN
|
0.68”
|
1st
|
Previous Record 0.78” in 1953
|
1938
|
|
Oelwein, IA*
|
0.75”
|
7th
|
0.39” in 1953
|
1923
|
|
Lancaster 4 WSW, WI
|
0.81”
|
8th
|
0.09” in 2004
|
1893
|
|
Charles City, IA
|
0.82”
|
8th
|
0.32” in 1952
|
1893
|
|
Guttenberg Lock & Dam 10, IA
|
0.91”
|
10th
|
0.20” in 1979
|
1937
|
|
Prairie du Chien, WI
|
0.97”
|
10th
|
0.13” in 2004
|
1893
|
|
Fayette, IA
|
1.00”
|
6th
|
0.48” in 1979
|
1893
|
|
* Oelwein 1E and Oelwein 2S were threaded together to extend records back from 2006 to 1923.
|
It was a relatively quiet severe weather month. There were 5 severe thunderstorm warnings. The long-term average is 8. The least in September was 0 in 1987, 1993, 1999, and 2003. On the evening of September 2 and the early morning hours of September 3, a line of thunderstorms moved across the area. There were 3 Severe Thunderstorm Warnings issued between 9:58 PM and 12:45 AM. They covered all or parts of Allamakee and Winneshiek counties in northeast Iowa; Winona County in southeast Minnesota; and Buffalo and Trempealeau counties in west-central Wisconsin. The other 2 Severe Thunderstorm Warnings were issued for a couple of supercell thunderstorms that moved southeast across Buffalo and Trempealeau counties between 9:54 pm and 11 PM on September 20 and across Juneau and Adams counties in central Wisconsin between 12:10 AM and 1 AM on September 21. The first storm produced 1” hail in Mondovi and Eleva. The second storm produced 2” hail just north of Finley and 3” hail just east of Finley and west of New Rome.
Below are the September 2022 climate summaries for La Crosse, WI, and Rochester, MN.
La Crosse, WI
September 2022 was Drier and Slightly Warmer than Normal in La Crosse, WI
...September 2022 Highlights...
|
Temperatures - Tied for 26th Warmest September
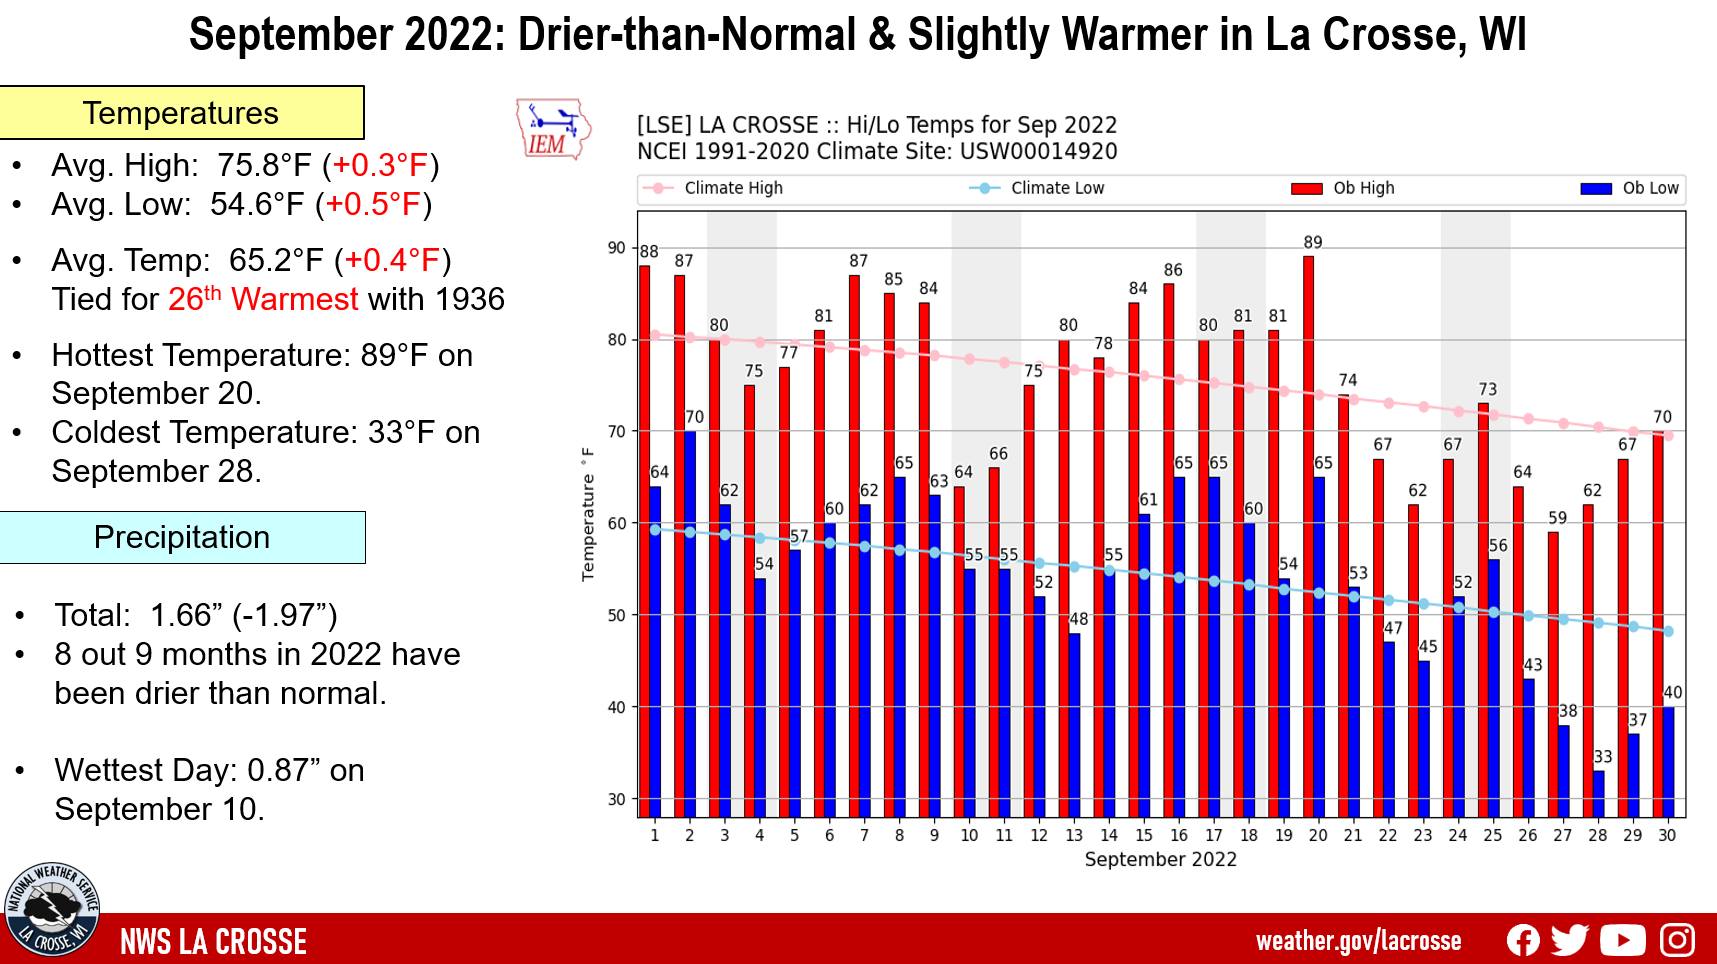
- The average temperature at La Crosse Regional Airport was 65.2°F. This was 0.4°F warmer than 1991-2020 normal of 64.8°F.
- This September was tied with 1936 for the 26th warmest September.
- 13 out of the 30 warmest Septembers have occurred since 2000.
- Within the last 8 years, we have had the warmest September (2015), 2nd warmest September (2019), 3rd warmest September (2017), 8th warmest September (2016), 11th warmest (2021), 21st warmest September (2018), and tied for 26th warmest September (2022).
|
 |
- The average high temperature was 75.8°F. This was 0.3°F warmer than 1991-2020 normal of 75.5°F.
- The average low temperature was 54.6°F. This was 0.5°F warmer than 1991-2020 normal of 54.1°F.
- The hottest temperature was 89°F on September 20.
- The coldest temperature was 33°F on September 28.
Rainfall - Drier than Normal
September 2022 Records...
Looking Ahead to October...
- The normal high temperature in La Crosse starts off at 69°F on October 1st and falls to 54°F by the end of the month. The normal low temperature starts off at 47°F on the 1st and falls to 36°F by the end of the month. The warmest October temperature on record is 93°F on October 6, 1963, and the coldest is 6°F on October 25, 1887.
- The normal mean temperature for October is 51.7°F. La Crosse’s warmest October occurred in 1963 with an average temperature of 61.2°F, and their coldest October occurred in 1917 with an average temperature of 39.4°F.
- The normal October precipitation is 2.49". The wettest October occurred in 1881 with 12.09" of precipitation (the second wettest month - only August 2007 was wetter with 13.75") and the driest October occurred in 1952 with only 0.02" of precipitation (third driest month - only November 1976 with a trace and December 1943 with 0.01" were drier). The wettest October day occurred on October 28, 1900, when 4.89" of rain fell (4th wettest calendar day). Normally, there are 2 days with thunderstorms.
- The normal October snowfall is 0.3". The snowiest October occurred in 1917 with 7" of snow. The snowiest October day occurred on October 28, 1917, when 4.7" of snow fell.
Rochester, MN
September 2022 was Drier and Slightly Warmer than Normal in Rochester, MN
...September 2022 Highlights...
|
Temperatures - 30th Warmest
- The average temperature at Rochester International Airport was 61.6°F. This was 0.5°F warmer than 1991-2020 normal of 61.1°F.
- This was the 30th warmest September.
- 15 out of the 30 warmest Septembers have occurred since 2000.
- Within the last 8 years, we have had the 2nd warmest September (2015), 5th warmest September (2019), 7th warmest September (2016), 18th warmest September (2018 and 2021), and 30th warmest (2022).
|
 |
- The average high temperature was 72.4°F. This was 0.6°F warmer than 1991-2020 normal of 71.8°F.
- The average low temperature was 50.8°F. This was 0.4°F warmer than 1991-2020 normal of 50.4°F.
- The hottest temperature was 90°F on September 20.
- The coldest temperature was 33°F on September 28.
Rainfall - Drier than Normal
September 2022 Records...
Looking Ahead to October...
- The normal high temperature in Rochester starts off at 66°F on October 1st and falls to 50°F by the end of the month. The normal low temperature starts off at 44°F on the 1st and falls to 32°F by the end of the month. The warmest October temperature on record is 93°F on October 3, 1997, and the coldest is -6°F on October 25, 1887.
- The normal mean temperature for October is 47.9°F. Rochester’s warmest October occurred in 1963 with an average temperature of 58.1°F, and its coldest October occurred in 1917 with an average temperature of 37.6°F.
- The normal October precipitation is 2.43". The wettest October occurred in 1911 with 9.11" of precipitation and the driest October occurred in 1952 with only 0.01" of precipitation. The wettest October day occurred on October 6, 1911, when 2.85" of precipitation fell. Normally, there are 2 days with thunderstorms.
- The normal October snowfall is 0.9". The snowiest October occurred in 2009 with 7.9" of snow. The snowiest October day occurred on October 22, 1979, when 5" of snow fell.