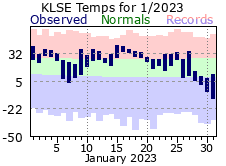
A winter storm would kick off 2023, with a mix of rain, freezing rain and snow making for an icy, slippery mess. Temperatures would warm moving into the middle part of January, topping out around 40 degrees on the 14th and 15th. It was warm enough for another rain event with almost ½” falling on the 16th (only a trace of snow fell with this storm system). A colder and more snowy winter storm then took aim on the area dropping over 5 inches of snow from the 18th through 19th. Temperatures for the month finished 5 ½ degrees above normal (14th warmest January on record at 24.4 degrees). Lows only dropped below zero twice (and at the very end of month), which is well below the 10 times that occurs on average. Precipitation was about an inch above normal while snowfall was about 1 ½ inches below normal.
|
 |
| |
|
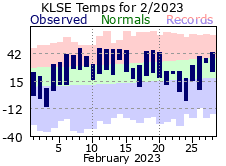
Milder conditions prevailed in February with high temperatures reaching, or exceeding, 40 degrees on 14 days. This was 8 days above the average and 10th most in a February for La Crosse. The month would finish almost 3 degrees above normal. It was a very dry start to the month with only 1 day recording 0.02” inches through the 13th. It was also warm enough that the first 3 days with precipitation fell as rain. Snow finally came with a storm system on the 20th, with more measurable snow falling over the next 4 days. While it took a while to get snow, it did pile up over the last week plus of February, amounting to 11.5 (almost 2 inches above normal).
|
 |
| |
|
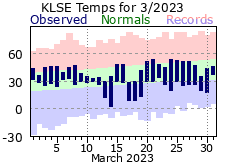
It was a mild start to March with the first 8 days recording above normal temperatures. Temps would cool after that, staying at or below normal on 70% of the remaining days. While highs managed to reach of exceed 50 degrees on 6 days, it never warmed past 53 degrees. In an average year, highs exceed that 5 times in a March. Overall, the month rounded out around 2 degrees below normal. Precipitation, on the other hand, finished above normal. Measurable precipitation fell on 12 days, highlighted by thunderstorms dropping 1.67” on the 31st . Not only was this a record for the 31st, but also made it the 4th wettest March day on record for La Crosse. Snowfall was plentiful at the start of the month, with measurable snows falling on half of the first 16 days. After that, there was only one more day with snow, and that only amounted to 0.2” (on the 28th). The 12.2” total was well above the normal of 7.3”
It was a wet first quarter of the year for La Crosse as precipitation from January through March added up to 7.84” – making it the 2nd wettest start on record.
|
 |
| |
|
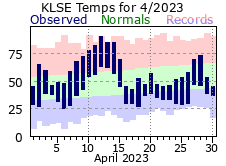
April finished right at its normal for average temperature, but accomplished that by large swings in warm to cold conditions. The month started a bit cool for its first week, but quickly warmed to much above normal for the 8th through 15th. Highs topped 80 degrees on the 11th through 14th, reaching 90 on the 12th. The 4 days above 80 tied for 7th most in an April while the 90-degree day on the 12th tied for the 2nd earliest occurrence of that kind of warmth. Further, that string also placed as the 5th warmest 4 day stretch in an April for La Crosse. Those hoping for an early spring, or perhaps an early summer, would be disappointed after that period of warmth as temperatures returned to below normal readings for much of the remaining month. The last freezing temperature would come on the morning of the 26th (30 degrees), which is the average for La Crosse. April’s precipitation was over ½ below normal, the bulk of which fell in the middle part of the month with the 15th through 20th accounting for 80% of the 3.12” total. There was one snow storm of note, dropping 9.5” over the 16th-17th. The 7.0” on the 16th set a record for that day and was the 3rd snowiest day on record in an April at La Crosse. That storm accounted for nearly the entire April total (one additional day with only 0.1”), but helped make it the 8th snowiest April on record (9.6”).
With the last snowfall for the 2022-23 winter season falling in April, La Crosse’s snow total topped out at 63.7” – marking it as the 15st snowiest winter on record.
|
 |
| |
|
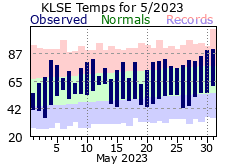
May would experience a fair amount of fluctuations when it came to day-to-day temperatures, ranging from a high of 55 on the 1st to 91 on the 31st. Temps reached or exceed 80 degrees 13 times in May, well above the average of 6 and tied for 9th most in a May. On the whole, May would average around 2 degrees above normal. After a relatively wet start to the year, May dried it out. There were only 7 days with measurable precipitation (average is 12), with nothing falling after the 18th. The 1.75” total was over 2 ½” below normal.
|
 |
| |
|
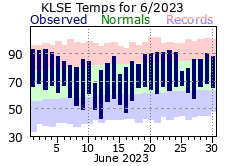
June got off to a very warm start, exceeding 90 degrees from the 1st through the 4th. Temperatures would cool down after that, mostly staying within 5 degrees, plus or minus, of the June normals. That said, there were 10 days with 90 degree or greater warmth, well above the average of 3 and tied for 6th most in a June. Like May, it was a very dry June. Measurable rain fell on only 7 days, well below the average of 12 and tied for 6th least in a June. Of the 2.40” monthly total, the bulk of that fell on the 18th with 1.81”. Overall, the month would finish over 2 ½ inches below normal.
In stark contrast to the first 3 months of 2023, the following 3 were exceedingly dry. So much so, the meager 7.27” total was almost 6 inches below normal (for this period), and ranked as the 20th driest April-May-June for La Crosse.
|
 |
| |
|
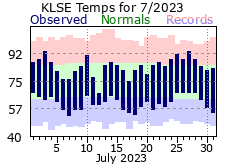
Compared to the previous 2 months, July was cooler and near normal for precipitation. Highs still reached 90 degrees or greater on 4 days, but also never warmed out of the 70s on 6 days (with a chilly high of 67 on the 12th). July brought some relief from the dry conditions with measurable rains falling on almost half the days (14), with only a max of 3 days between rainfalls
|
 |
| |
|
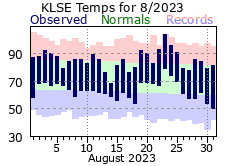
Mother Nature put the clamps on the rain as we moved into August. There would only be 5 days with measurable rains, half of what occurs on average and tied for 7th least. 75% of the month’s total fell on the 11th (1.04”) while only a trace of rain was recorded after the 17th. The 1.38” total was 2 1/2 “below normal. The first, and only 100 degree day occurred in August, topping out at 104 on the 23rd, not only setting a record for that day but also tying it for the 7th hottest day on record in La Crosse.
The summer was very dry by La Crosse standards. Only 8.2” inches fell from June through August, almost 4 inches below average.
|
 |
| |
|
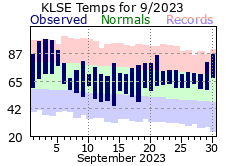
September got the traditional fall months off to a very warm start, heating up into the 90s on 4 of the first 5 days of the month, setting records on the 3rd and 4th. Temps nosedived after that as highs would drop back into the 70s on 22 of the remaining 25 days, not warming out of the 60s on two of them. Despite that, it was warm enough for September to not just finish close to 4 degrees above normal, but also make it the 5th warmest September on record. The dry trend persisted in September. There were 10 days with measurable rainfall, which is the monthly average, but on 7 of those days amounts failed to crack 2/10” of an inch. The month finished 1 ¼” below normal.
|
 |
| |
|
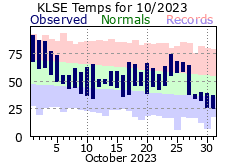
Like September, it was a warm start to October. The last 90-degree day of 2023 was recorded on the 1st (91), over a month later than the average last 90 degree day in a year for La Crosse (August 27th). A couple 80+ degree days followed, with a couple more days then topping out in the 70s. The average temp over that stretch made it the 3rd warmest start to an October on record. Temperatures would fall back to, or below, the monthly normal, with just one more 5 day stretch of warmer days near the end of the month. On the whole, October finished 1 ½ degrees above normal. The month started dry with only 0.02” of rain falling through the 11th. After that, precipitation would be more common, falling on half of the remaining days. 5 of those days would record more than ¼”. In addition, the first measurable snow of the 2023-24 winter season would fall on Halloween (1.1”). Not only was this over a week earlier than the average first measurable snow(11/11) but was tied for 7th first inch or more on record for La Crosse.
|
 |
| |
|
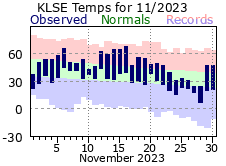
November brought a variety of temperatures to La Crosse with highs topping out at 62 but also never warming to 25 degrees on a couple days. Similar to October, despite the swings in temperatures, November would finish almost 1 ½ degrees above normal. Unlike the wet conditions of October, November would turn very dry. It took until the 25th to record any measurable precipitation, and even then, there would only be 3 such days. The monthly total of 0.14” tied this November for the 5th driest on record.
It was a relatively warm fall for La Crosse with September through November averaging 53.6 degrees, making it the 9th warmest on record.
|
 |
| |
|
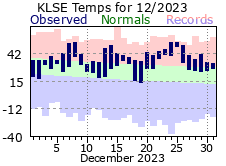
December would end 2023 in La Crosse much like it began with very mild temperatures. Aside from a couple below normal days on the 1st and 2nd, temperatures soared well above normal through the rest of the month. Highs reached or exceeded 50 degrees on 6 days, tied for 4th most in a December and well above the average of 1. In fact, it never dropped below 50 degrees on Christmas day. Further, low temperatures only cooled under 20 degrees on 4 days – 3rd least in a December and well, well under the average of 18 such days. Additionally, lows never even dropped into the single digits (an average December has 10 such days) which has only occurred in 5 other Decembers. A very mild December indeed. Precipitation was fairly sparse for the month with less than 1 inch falling, approximately ½” below normal. Snowfall suffered even more with only 1 ½” falling for the entire month, marking it as the 9th least snowy December on record (tied with previous years).
|
 |
| |
|
|
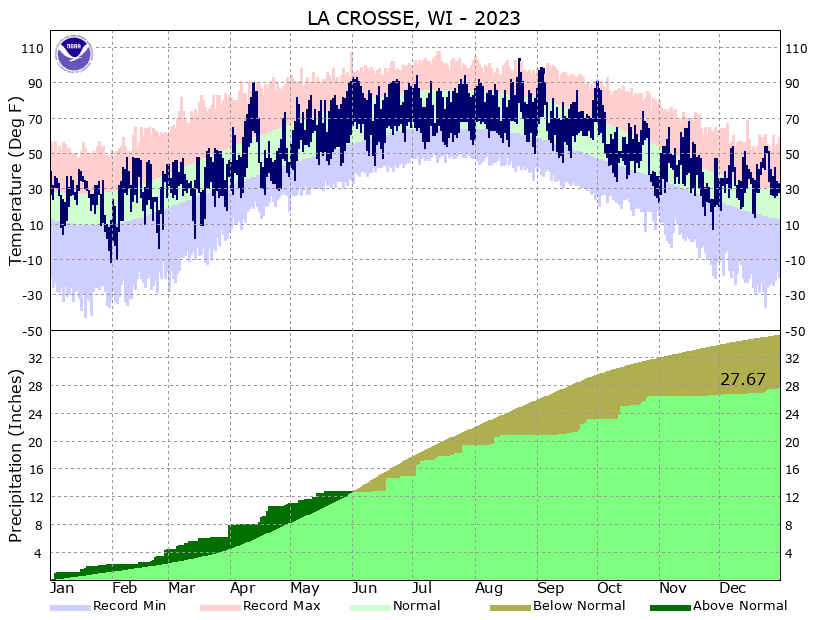
La Crosse’s 2023 would go down as one of it’s warmest on record with the 51.0 degree average making it the 4th warmest. The highest daily temp was 104 on August 23rd, only the 12th time that a temperature that hot has been achieved. Additionally, highs reached or exceeded 90 degrees 30 times (tied for 12th most in a year) while not warming above freezing on only 37 days (7th least in a year for La Crosse). Low temperatures chilled to zero or below 5 times (tied for 4th least in a year).
It was a wet start to 2023 with one of the soggiest starts to any year on record for La Crosse. The above normal precipitation, along with late season snow melt, resulted in top 5 record flooding on the Mississippi River at La Crosse. Dryer conditions moved in for April and would persist for the rest of the year. It was so dry that drought conditions developed quickly in the spring months, continuing to build through the summer. The lack of moisture pushed the local area into “severe” drought for several months – conditions that haven’t been experienced locally since the early 2000s.
|
 |
