|
Local Weather History For July 22nd...
|
|
In 1990, lightning ignited a fire in Billings of Roane County. Lightning struck a 80 by 70 foot barn
around 2:30 pm. The barn was completely destroyed by fire. Contents of the barn included 1,500 bales
of hay and a new bailor.
|
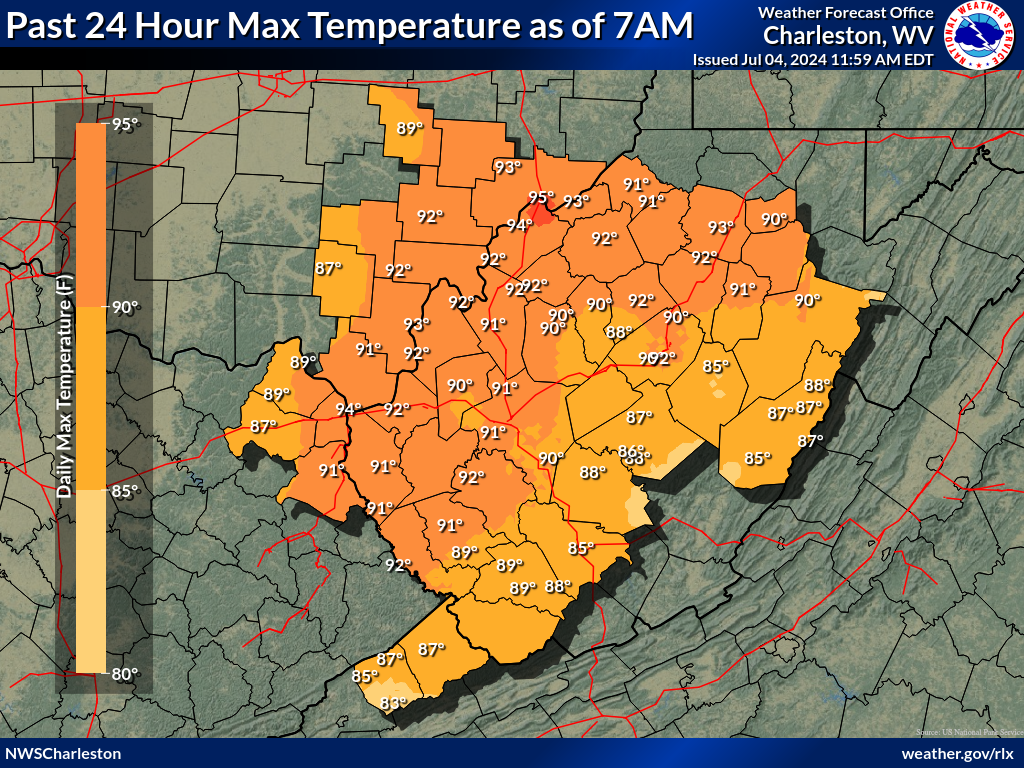
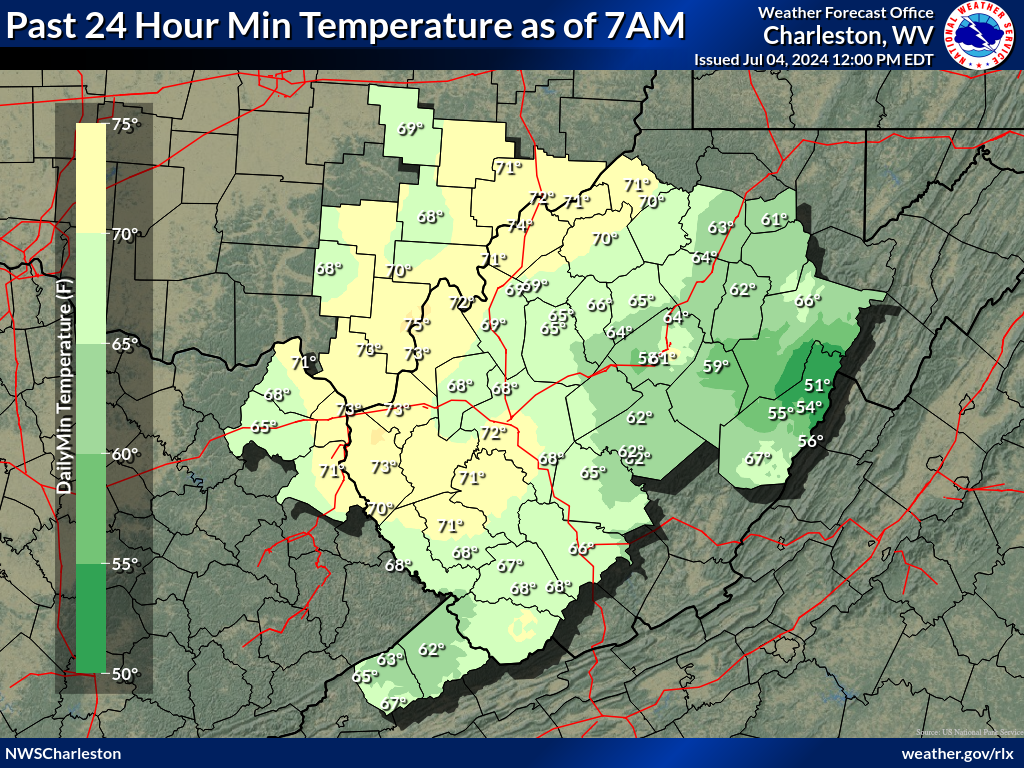
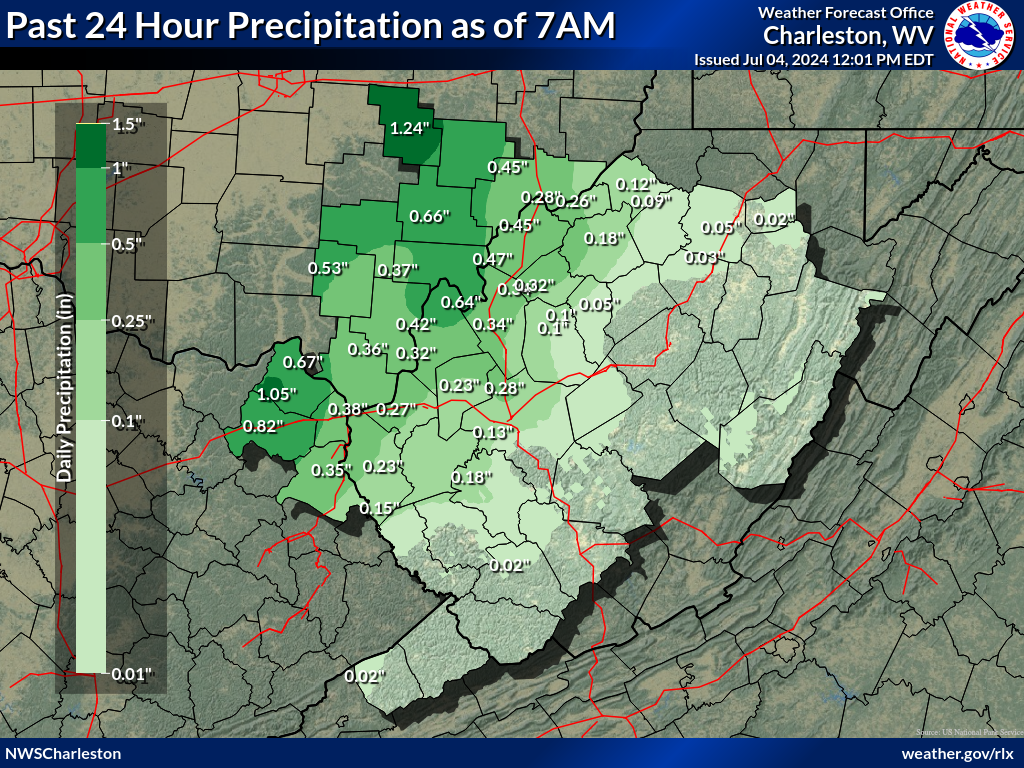
Daily temperature and
precipitation maps covering the past 24 hours from 7 A.M. to 7 A.M.
EST/EDT. Snow depth is based on measurement at 7 A.M. of the day
shown. Maps are generally updated around 10:30 A.M. each day. Ranked
listings by state of the individual station reports is provided on our
full climate maps page at http://www.weather.gov/rlx/climatemaps.
| Max Temp | Min Temp | Precip | Snowfall | Snow Depth |
 |
 |
 |
 |
 |
Select drop-down menu for other sites and months
|
|
Huntington, WV |
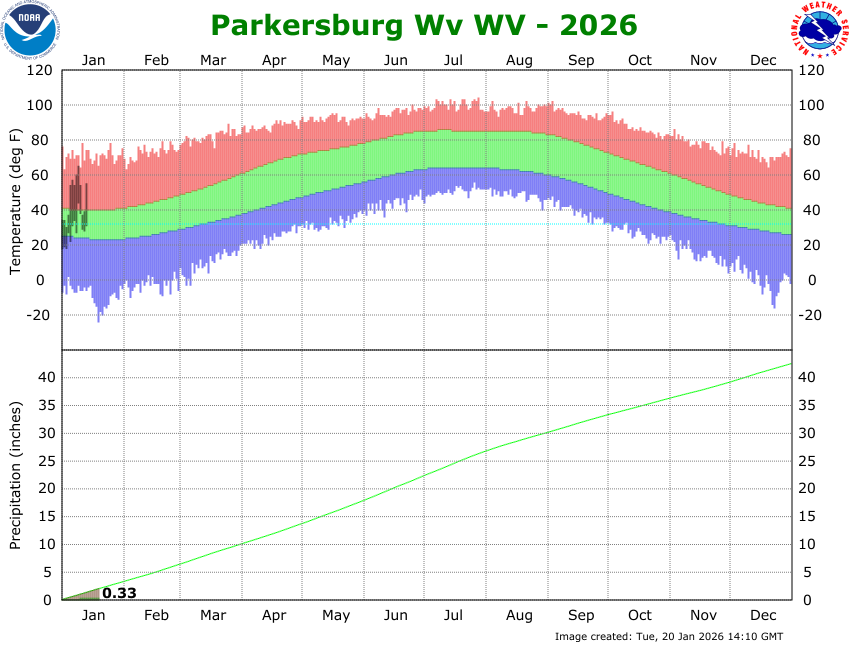
Parkersburg, WV |
|
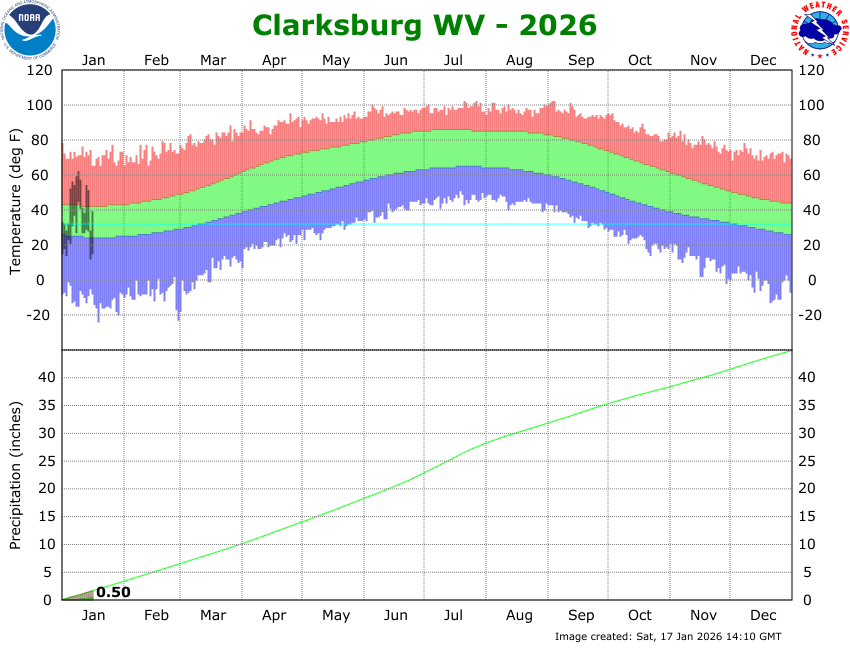
Clarksburg, WV |
Elkins, WV |
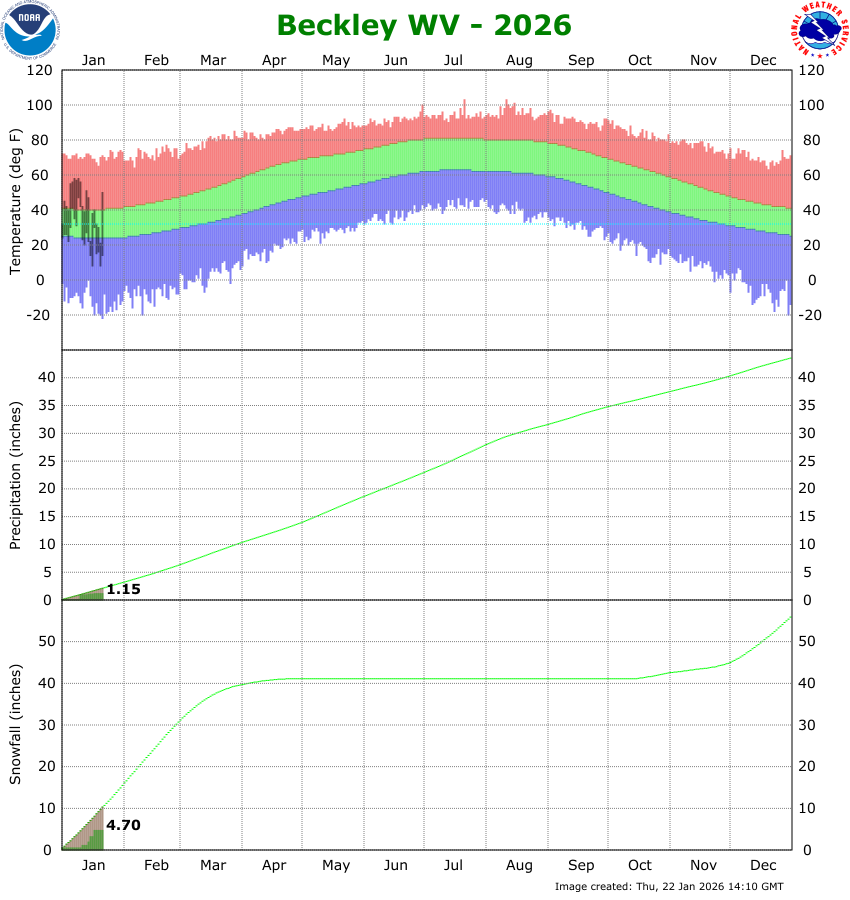
Beckley, WV |