
Bitter cold temperatures and dangerous wind chills will persist from Florida to the Northeast through Monday. Daily record low temperatures are forecast across the Southeast and Florida, with some all-time February low temperature records possible across Florida. An Alberta clipper will spread wintry precipitation across the Northern Plains today and into the upper Great Lakes into tonight. Read More >
Wet Bulb Globe Temperature
The Wet Bulb Globe Temperature (WBGT) is an indicator of heat related stress on the human body at work (or play) in direct sunlight. It takes into account multiple atmospheric variables, including: temperature, humidity, wind speed, sun angle, and cloud cover.
Today's Forecast Maximum Wet Bulb Globe Temperature
|
|
|
|||||||||||||||||||||||||||||||||||||
Map, calculator courtesy National Weather Service - Tulsa
Forecast Wet Bulb Globe Temperature Maps for Minnesota
Wet Bulb Globe Temperatures
Northern Area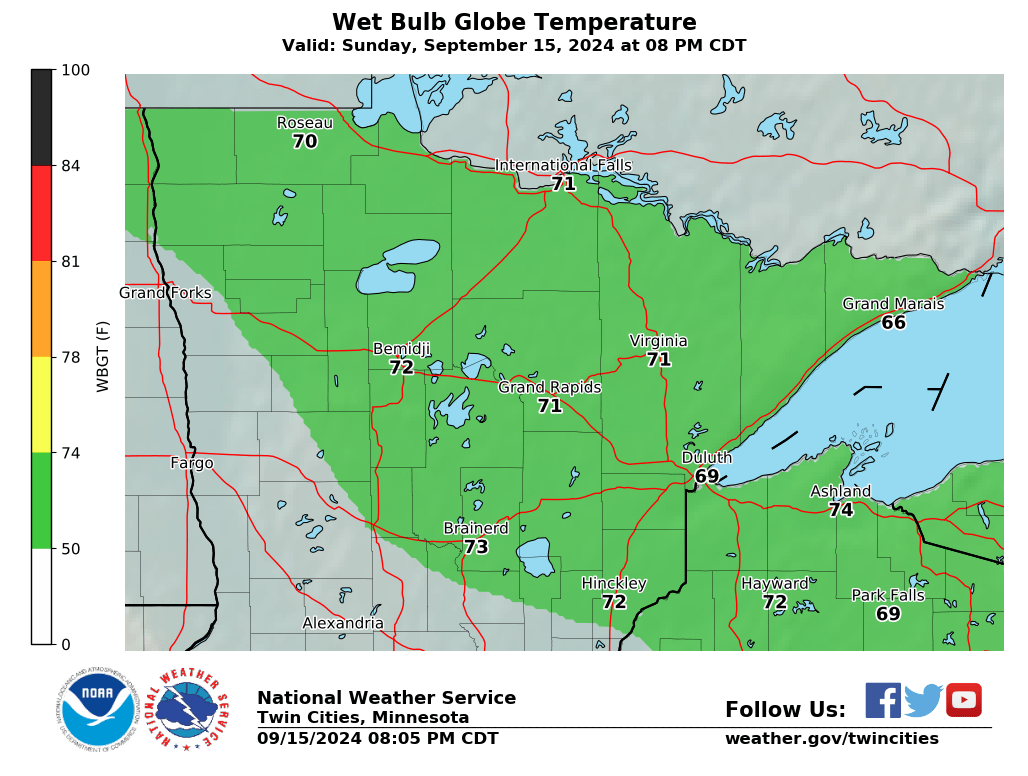 This Hour |
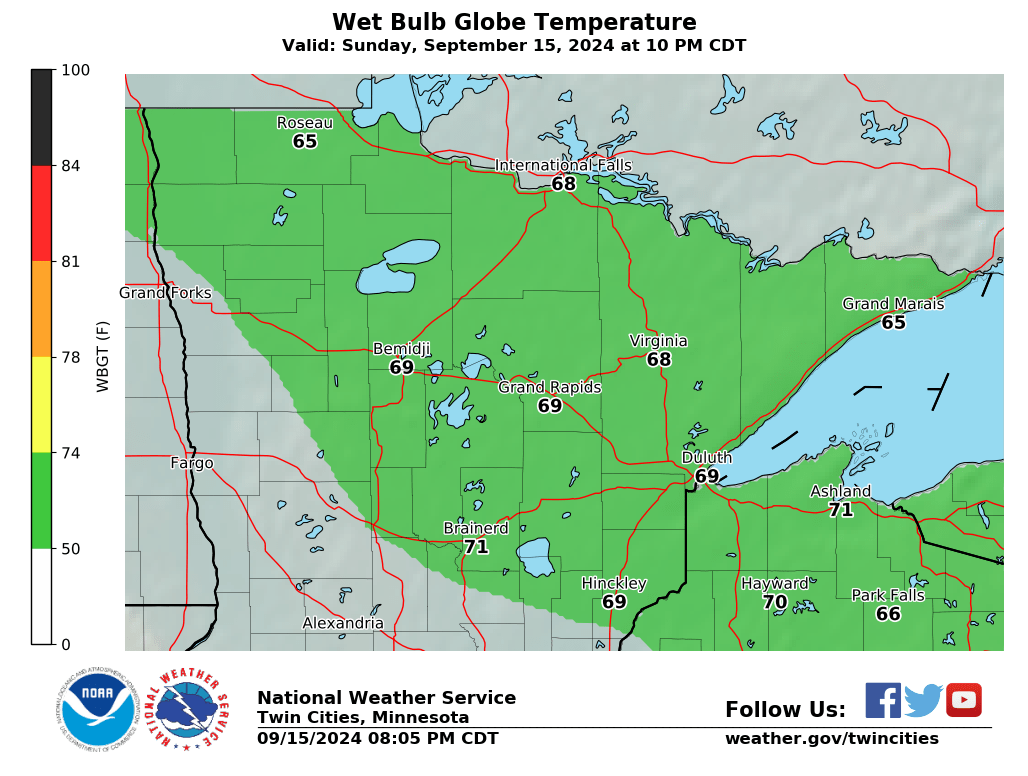 +2 Hours |
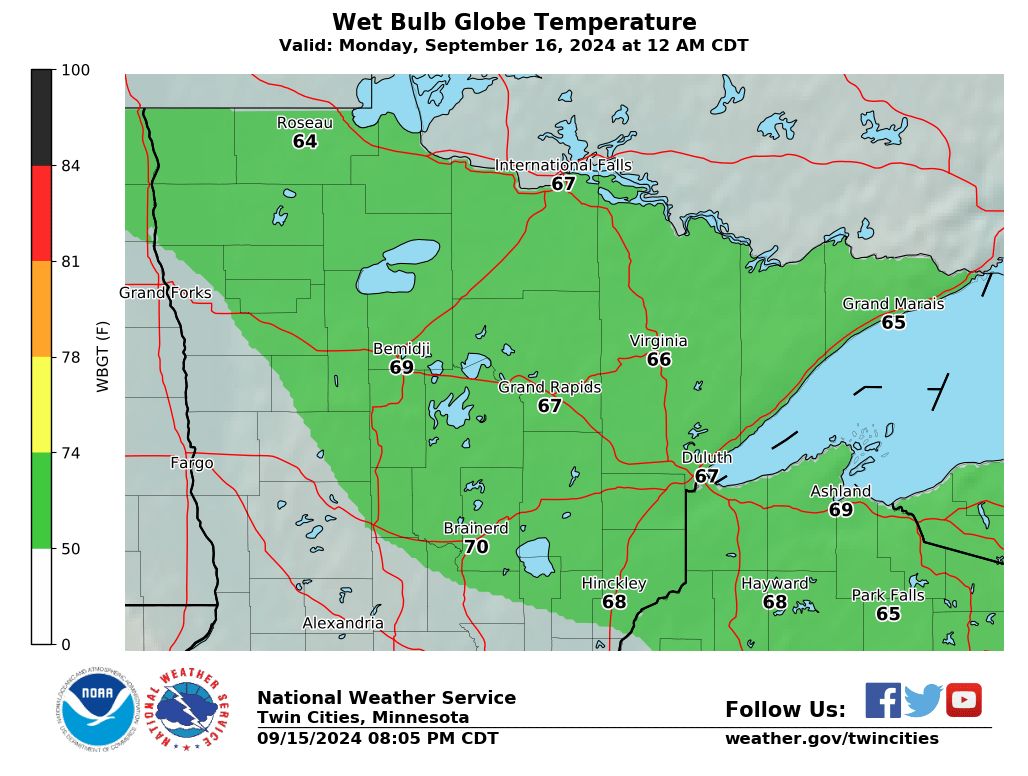 +4 Hours |
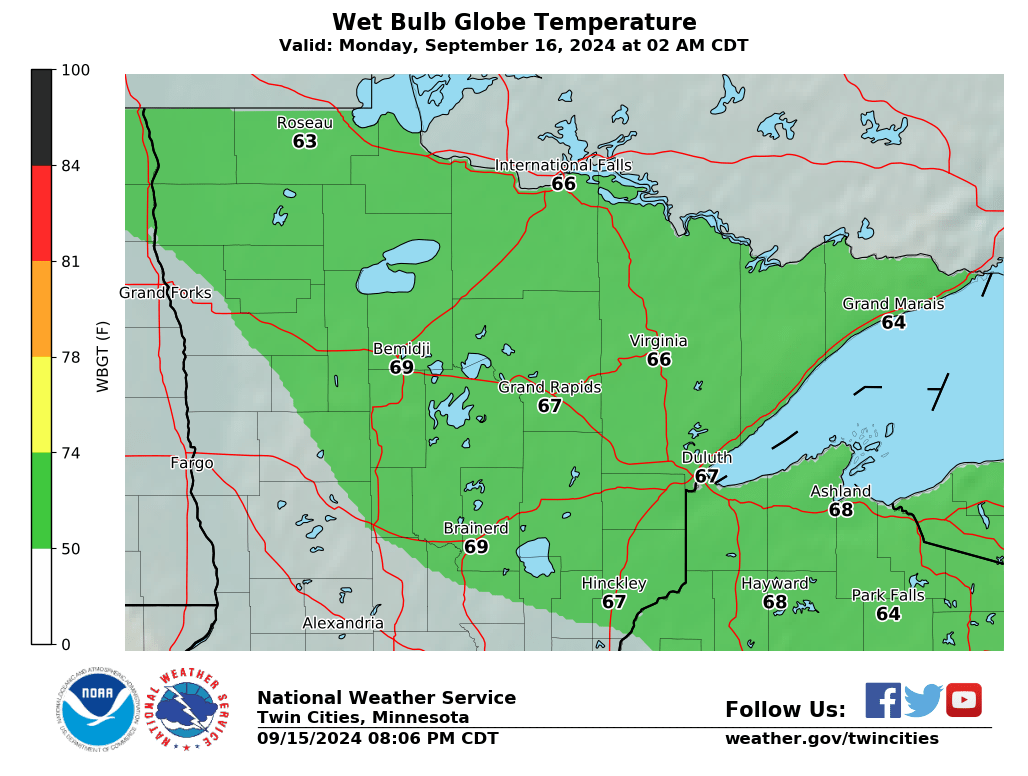 +6 Hours |
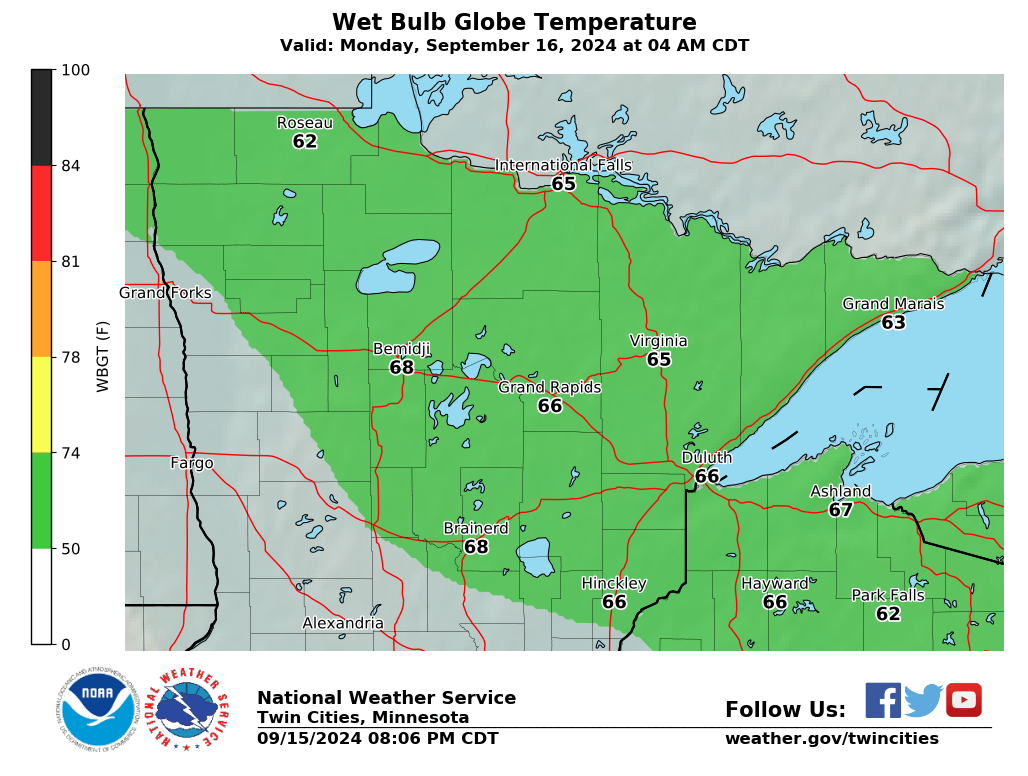 +8 Hours |
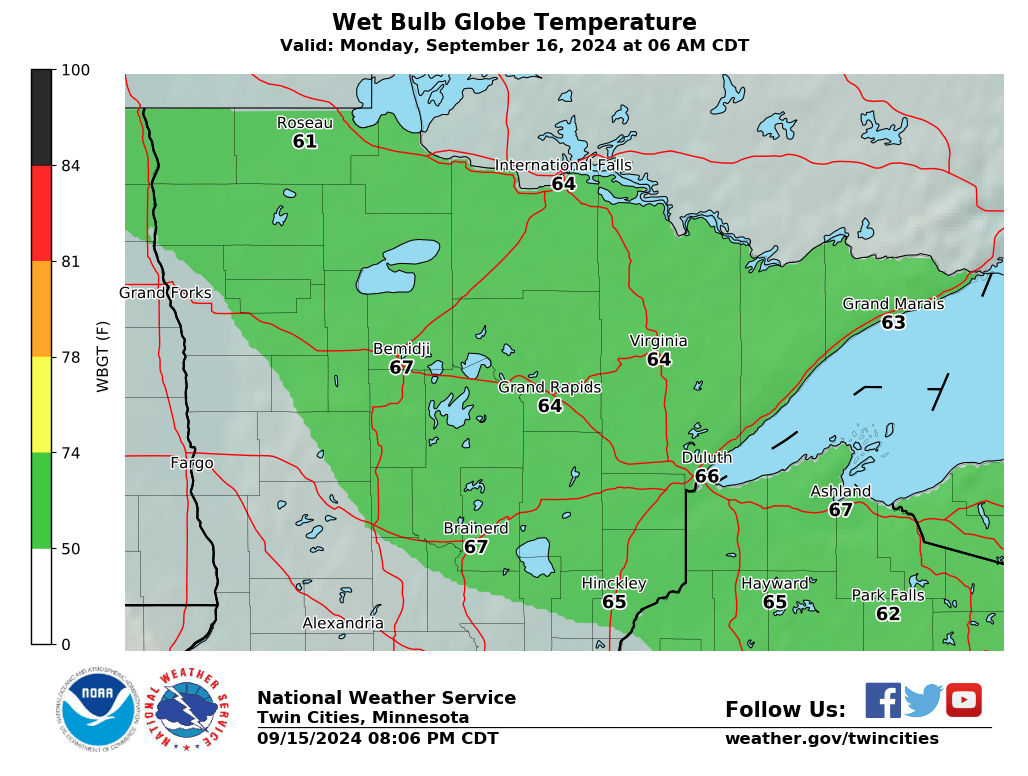 +10 Hours |
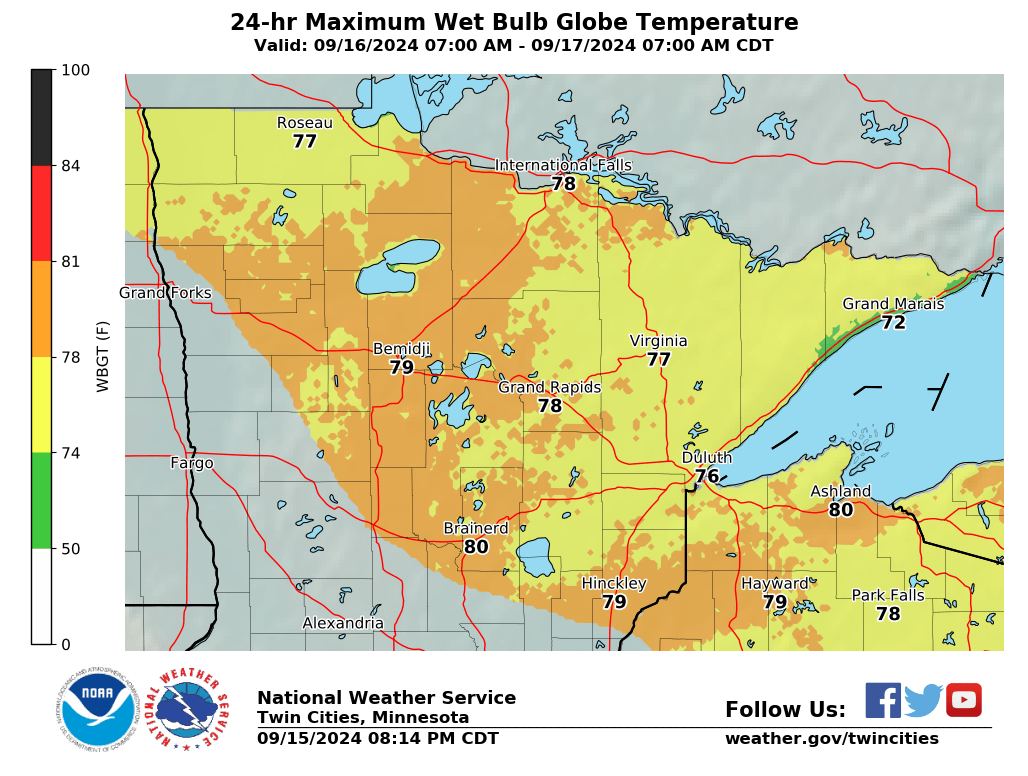 Max Day 2 |
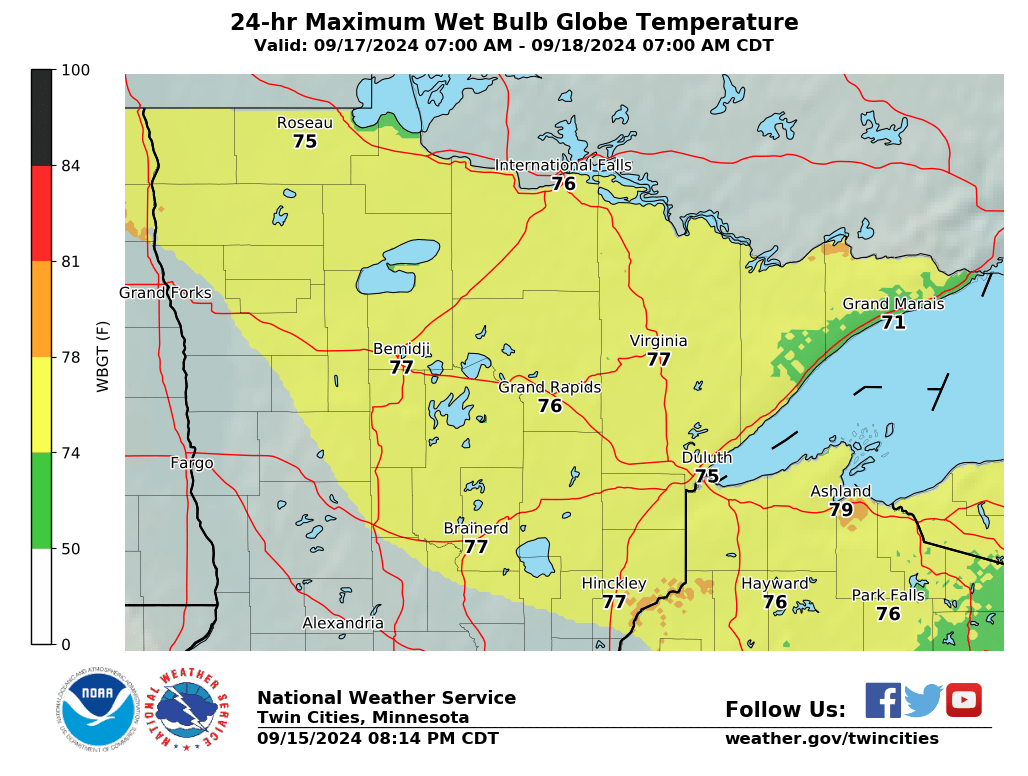 Max Day 3 |
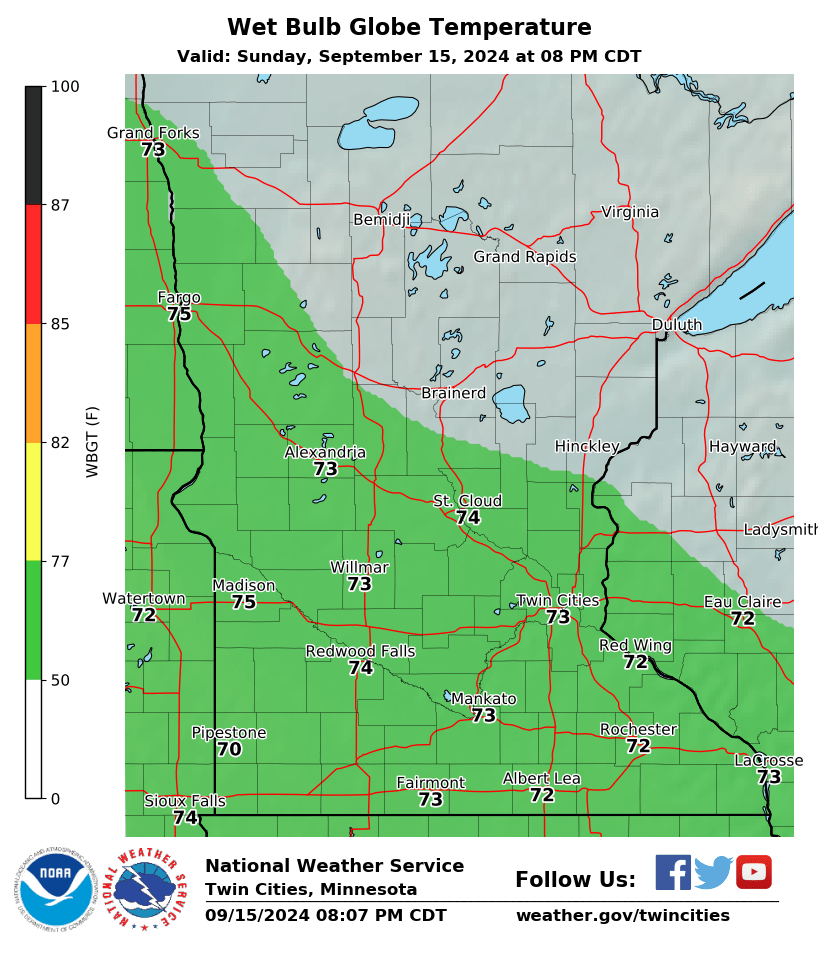 This Hour |
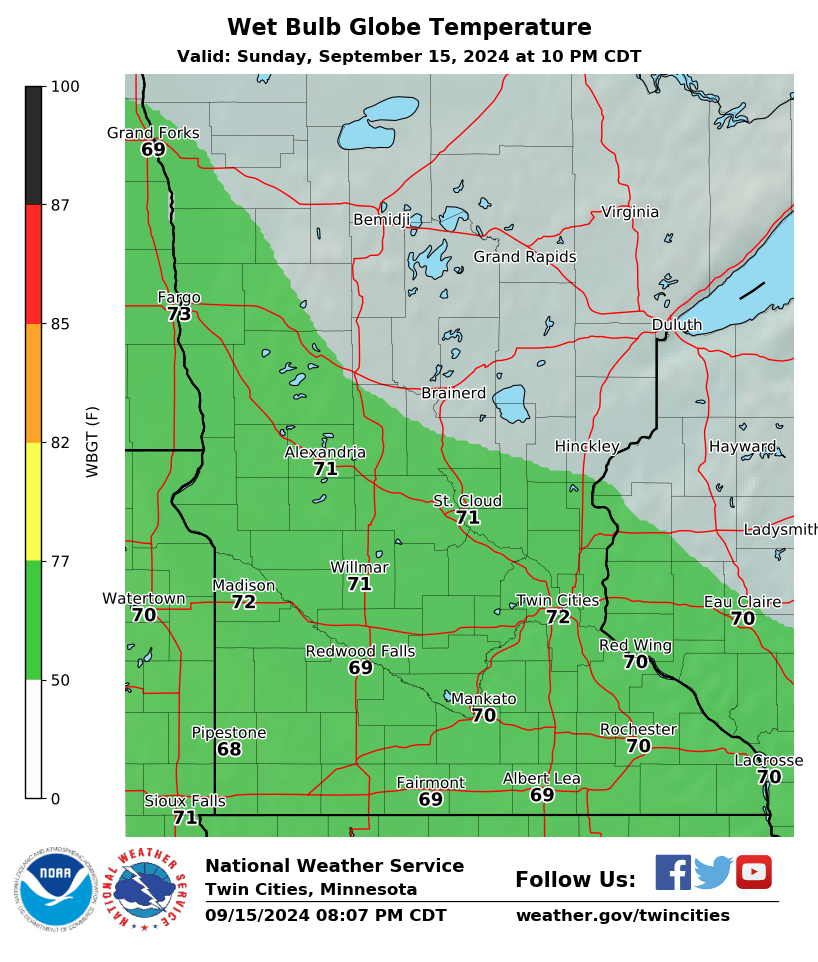 +2 Hours |
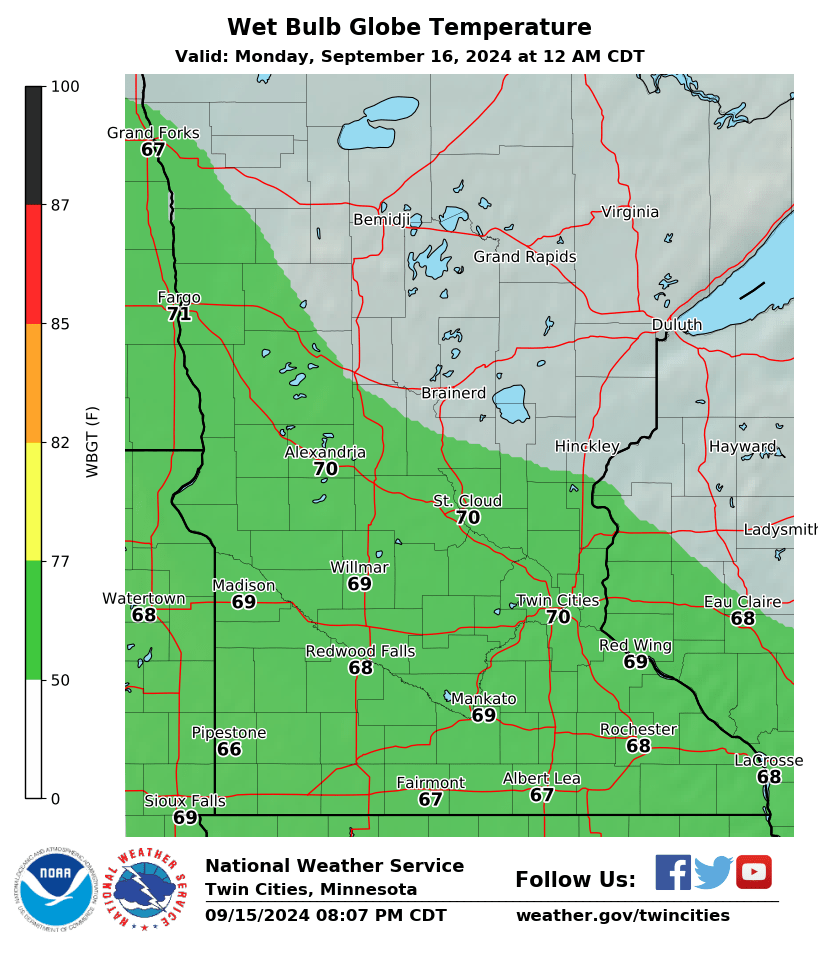 +4 Hours |
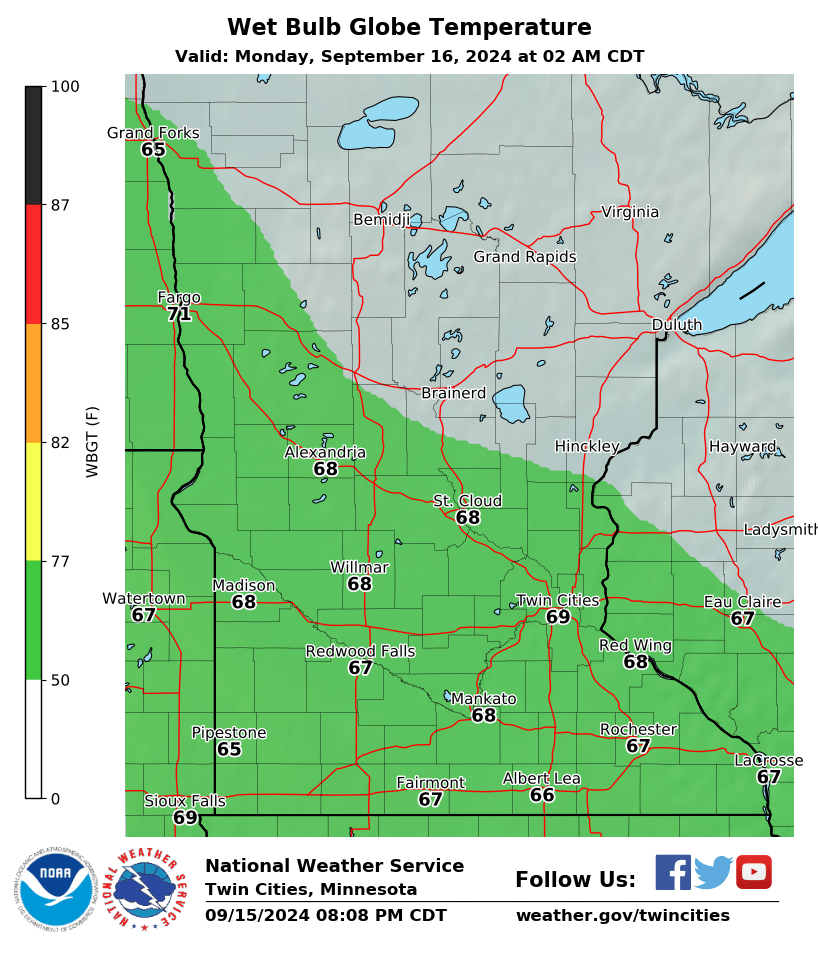 +6 Hours |
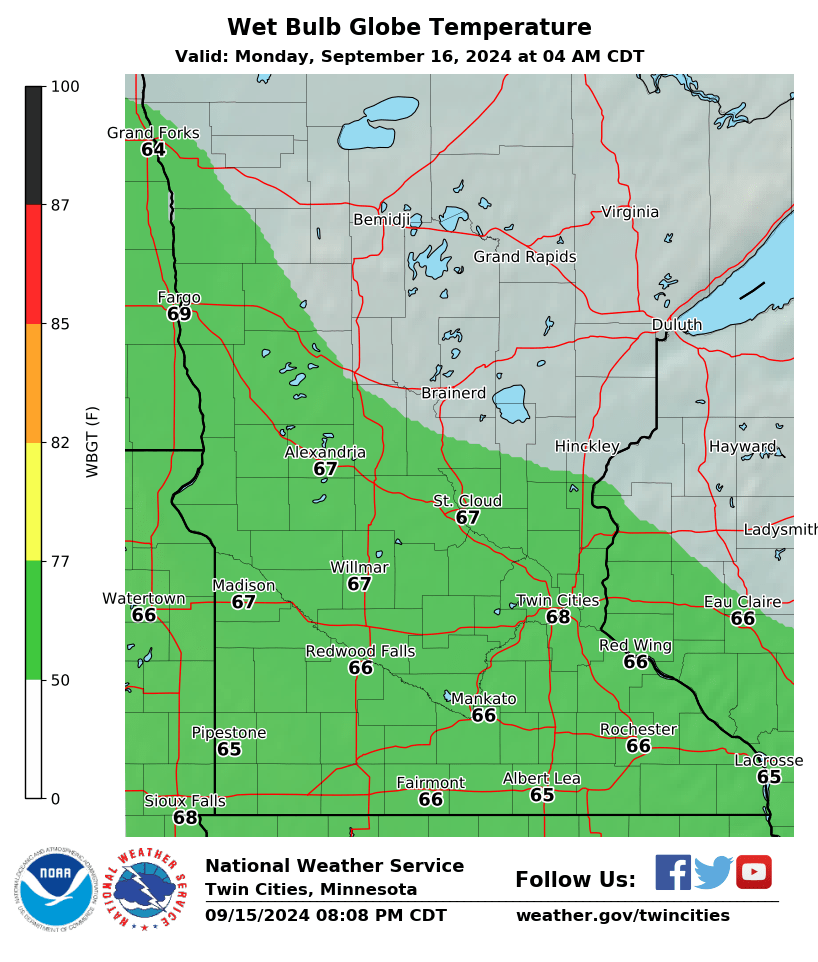 +8 Hours |
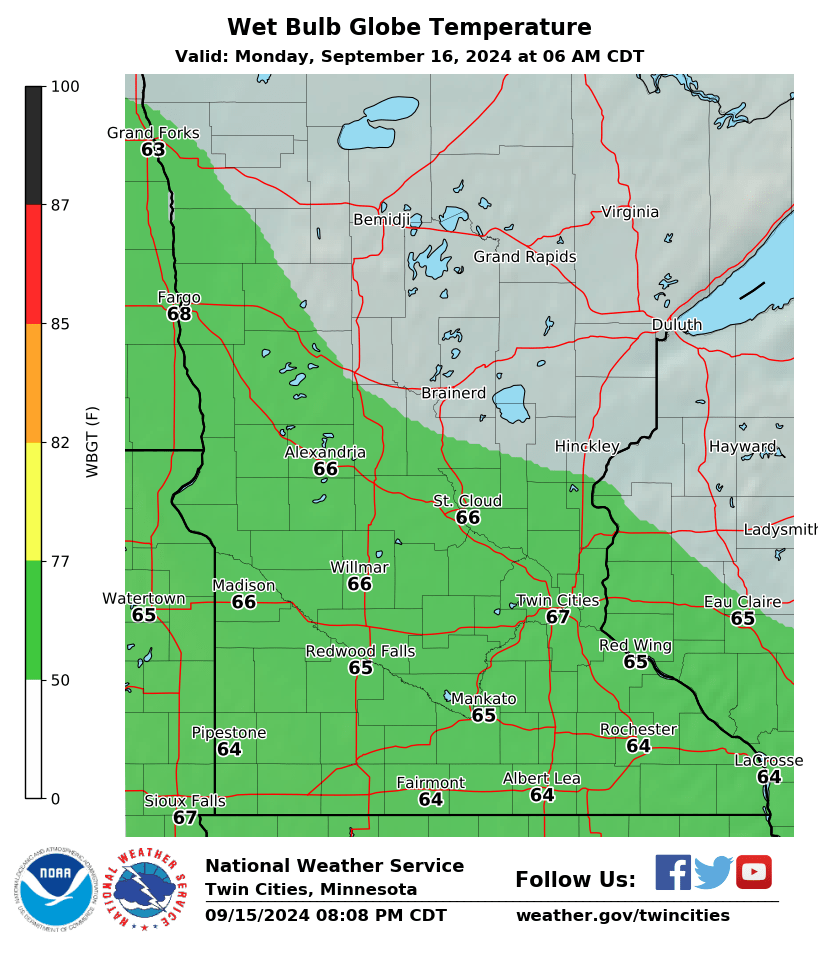 +10 Hours |
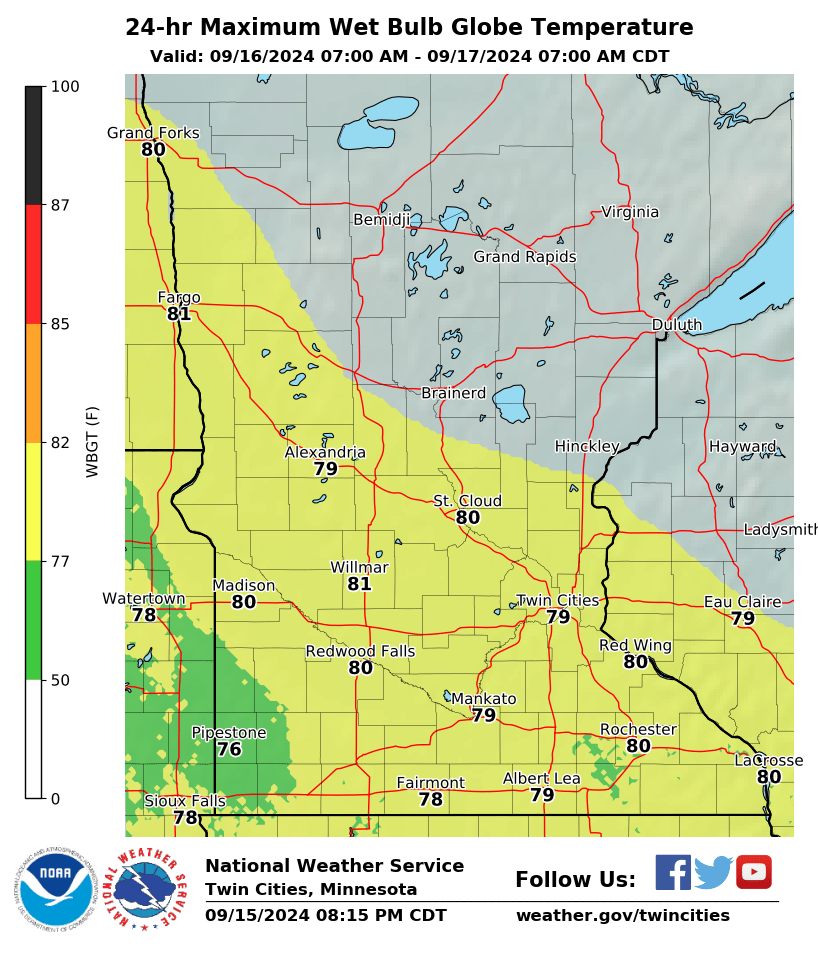 Max Day 2 |
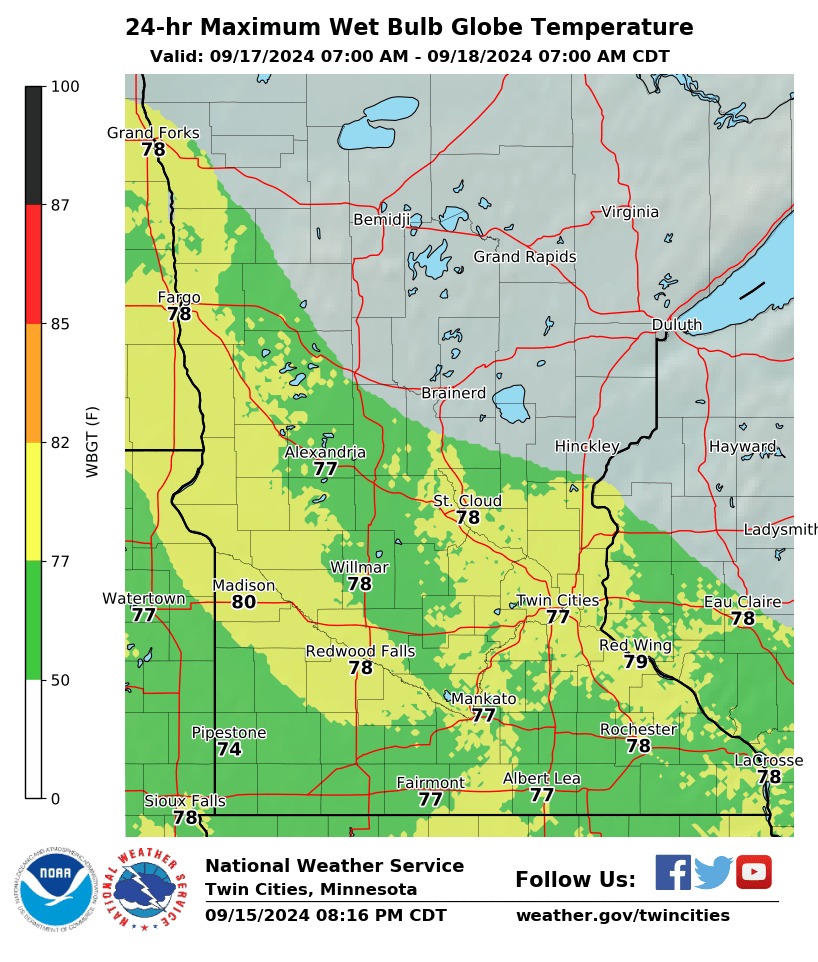 Max Day 3 |
Wet Bulb Globe Temperature vs Heat Index
While the WBGT and Heat Index both attempt to describe how "hot" it is and the potential for heat related stresses, they go about it in different ways.
â–º Heat Index is more commonly used and understood by the general public - the higher the values the hotter it's going to feel and the higher the threat for heat related illnesses. It's calculated from the temperature and relative humidity. What's not commonly known is that Heat Index assumes you are in the shade.
â–º WBGT also uses the temperature and humidity in its calculation, but temperatures are measured in direct sunshine. It also factors in wind speed, sun angle, and cloud cover.
Bottom-line upfront >>>> what value should you use? For day-to-day activities, heat index will serve you well. If you work outside or plan on any sort of vigorous outdoor activity in the full sun, use the WBGT.
Comparing WBGT and Heat Index
|
Examples Assuming temperature and dew point are constant, notice how increases in
|
| WGBT | Heat Index | |
|
Origins: The WBGT date back to the 1950s - specifically the United States Marine Corp Recruit Depot on Parris Island, SC. There, recruits were required to perform high intensity exercise in a high humidity, high temperature environment. Many solders succumbed to heat related illness. In response, a joint effort between the Department of the Navy and Army doctors studied the effects of heat on exercise performance. The result was the WBGT. WGBT uses several atmospheric variables for its calculations: temperature, humidity, wind speed, sun angle, and cloud cover. Temperatures are measured in the sunlight. The military uses the WBGT to gauge the potential for heat related stresses to this day. OSHA and many nations also use the WBGT as a guide to managing workload in direct sunlight, as do athletic departments (college and high school) and events. If you work or exercise in direct sunlight, this is a good element to monitor. |
Origins: The Heat Index is based on work carried out by Robert G. Steadman in 1979 ("An Assessment of Sultriness, Parts I and II") where he discussed factors that would impact how hot a person would feel under certain conditions. The National Weather Service developed a "simplified" formula from this work using air temperature and relative humidity as the two inputs. This formula became the "heat index". It is important to note that the heat index is calculated for shady areas. Direct sunlight can add as much as 15 degrees to the heat index. |
|
Inputs:
|
Inputs:
|
|
|
Equation: WBGT=0.7Tw+0.2Tg+0.1Td
|
Equation: Heat Index = -42.379 + 2.04901523T + 10.14333127R – 0.22475541TR – 6.83783(10-3T2) – 5.481717(10-2R2) + 1.22874(10-3T2R) + 8.5282(10-2TR2) – 1.99(10-6T2R2)
|
PREPARE - SAFETY - RESOURCES
Prepare
Before:
During:
Resources
Guidelines - Charts
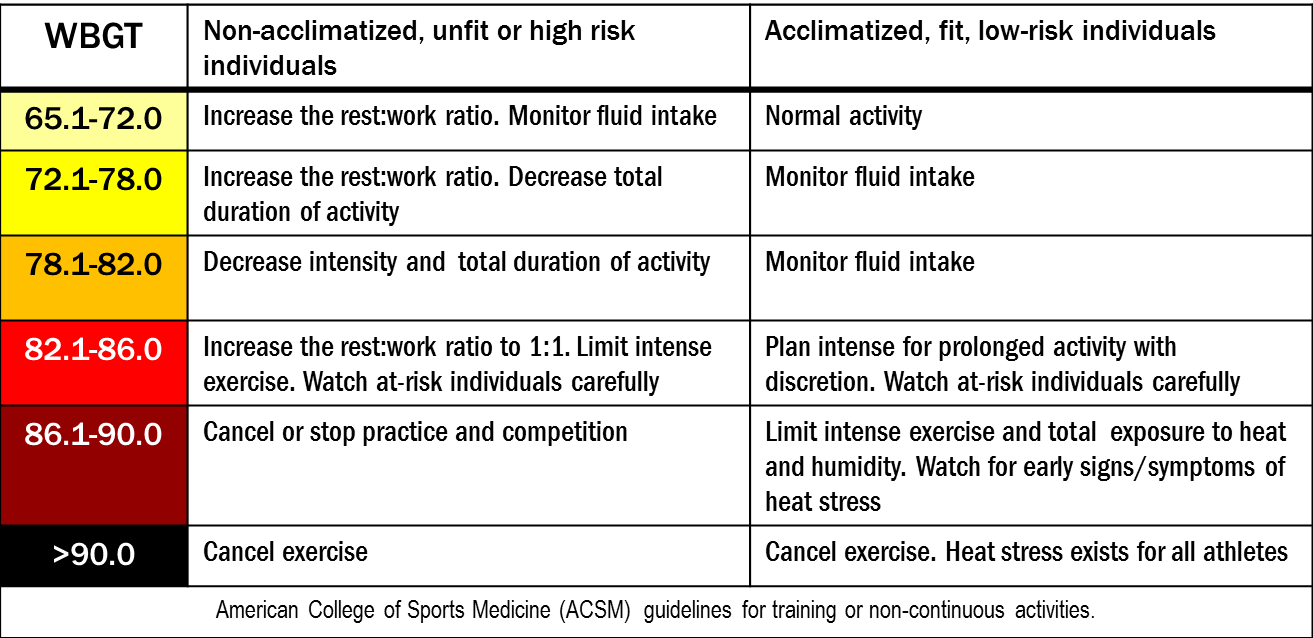
While there is not set criterion for WBGT temperatures and related risks/impacts, the American College of Sports Medicine (ACSM) has developed a set of values that have been accepted as a standard to follow. Their original guidelines were developed for running events, but have since been expanded to include intermittent (non-continuous) activities [Medicine & Science in Sports & Exercise: March 2007 - Volume 39 - Issue 3 - p 556-572] . The guidelines are not based on location.
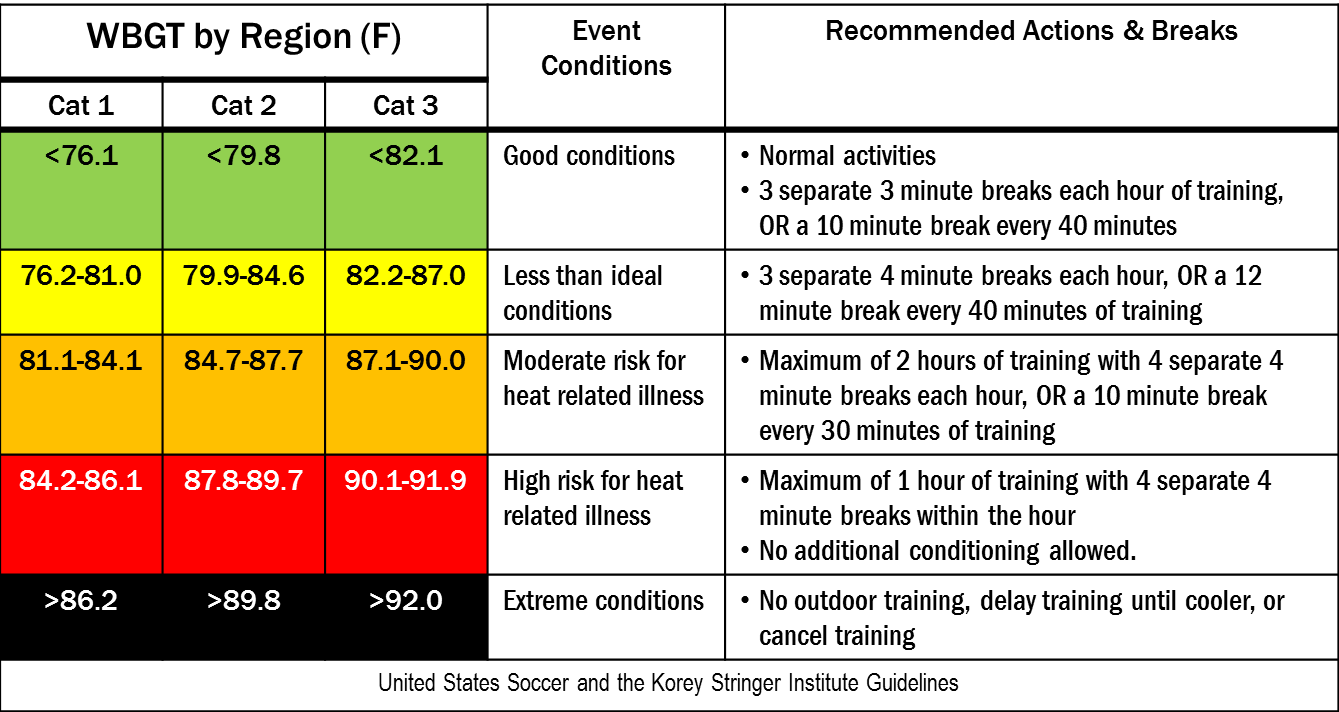
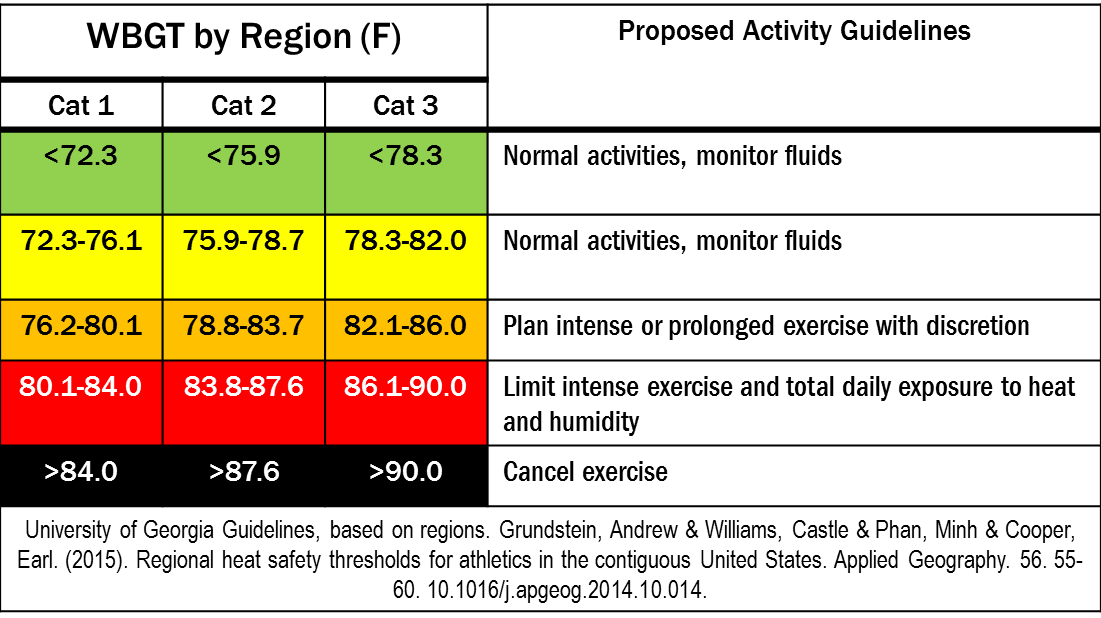
Using ACSM as a starting point, further research by the University of Georgia (UGA) factored in climatology and regional differences in an effort to incorporate acclimatization* into the guidelines. The Korey Stringer Institute and USA Soccer used the regional categories developed by UGA to provide another set of recommend actions.
The military and OSHA also have devised recommendations, as do many university and high school athletic departments.
Below you will find several of these guidelines/recommendations.
It should be noted that while WBGT will provide solid guidelines, other factors such as an individual’s physical fitness, acclimatization, medical condition, and age also have an impact.
* Acclimatization: the body's natural adaptation to heat/cold. The process usually takes 10 to 14 days.
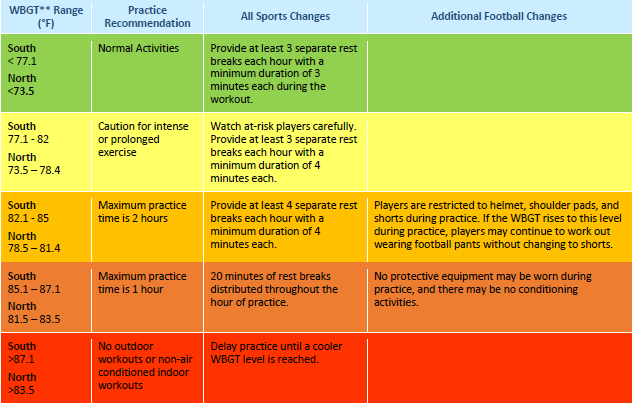
Minnesota State High School League (MSHSL)
 |
Based On Location
| The following recommendations use similar criteria as the ACSM, but modified for location and climatology. This adjustment factors in the acclimatization that occurs for those that consistently work and exercise in hot environments. | 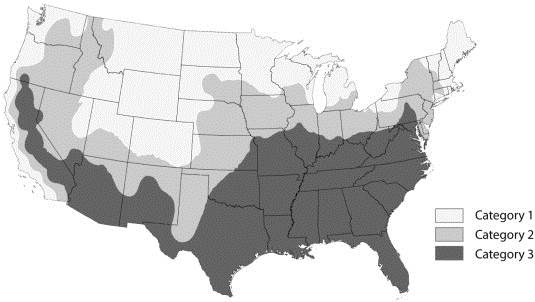 Regional Categories |
 |
 |
|
|
Guidelines from USA Soccer and the Korey Stringer Institute (KSI) |
Guidelines from the University of Georgia |
NOT based on location - American College of Sports Medicine
| Continuous Activities | Intermittent Activities | |
|
Activities with little if any break, such as cross country running, 5K runs, and marathons. |
Activities that generally have breaks between bursts of high intensity movements/actions, such as football, soccer, lacrosse, etc. |
|
 |
 |
|
|
Guidelines from the American College of Sports Medicine - not based on location |
Guidelines from the American College of Sports Medicine - not based on location |
Other Charts For Reference
|
|
|
|