 |
| For Your Information |
| If there is something that may be of interest to you, we will try to make that information available. |
|
|
 |
Enhanced Fujita Scale |
 |
| |
| When storm damage is reported, and tornadoes are the culprit, the National Weather Service is tasked with determining the strength of the tornadoes based on the damage surveyed. Since 1971, the Fujita Scale (developed by Dr. T. T. Fujita) was used as a guide. |
| The Fujita Scale |
| Rating |
Description |
Wind Speed |
| F0 |
Gale tornado |
40-72 mph |
| F1 |
Moderate tornado |
73-112 mph |
| F2 |
Significant tornado |
113-157 mph |
| F3 |
Severe tornado |
158-206 mph |
| F4 |
Devastating tornado |
207-260 mph |
| F5 |
Incredible tornado |
261-318 mph |
|
Ratings on the scale ranged from F0 for the weakest tornadoes (light damage) to F5 for the most violent (incredible damage), with estimated wind speeds for each rating. However, for affected structures, little consideration was given to the quality of construction. Given this, results were often based on appearance, with wind speeds subject to bias and sometimes overestimated (especially with stronger tornadoes). In the end, on a case by case basis, findings were inconsistent.
In 2001, work began on the development of a new scale. This effort was pioneered by Texas Tech University's Wind Science and Engineering Center, along with a forum of nationally renowned meteorologists and wind engineers from across the nation.
After extensive research, a new Enhanced Fujita (EF) Scale was unveiled. Similar to its counterpart, it has ratings from EF0 to EF5. What is "enhanced" is the process used to evaluate damaged structures/objects or "indicators", with less reliance on appearance.
|
| The Enhanced Fujita Scale |
| Rating |
Description |
Wind Speed |
| EF0 |
Gale tornado |
65-85 mph |
| EF1 |
Moderate tornado |
86-110 mph |
| EF2 |
Significant tornado |
111-135 mph |
| EF3 |
Severe tornado |
136-165 mph |
| EF4 |
Devastating tornado |
166-200 mph |
| EF5 |
Incredible tornado |
> 200 mph |
| Ironically, the process starts with a visual assessment of the degree of damage to several indicators. This is done to get a ballpark rating and range of wind speeds that caused the damage. Next, the construction of the indicators is evaluated to determine how well they were built compared to code (standard building practices). The better the construction, the higher the winds within the assigned rating. Finally, the highest rated indicator determines the rating for the tornado. |
| A Quick Example of How the EF Scale Works |
| |
| Future surveys will focus on 28 damage indicators, such as houses, mobile homes, barns, etc. In cases when there are no structures available (such as in rural areas), trees, towers and light poles are used. |
 |
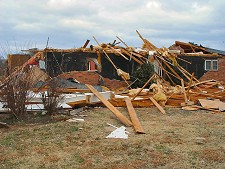
In this case, we will focus on a family residence...which is heavily damaged by a tornado. |
| In the picture: A tornado removed most of the roof and removed brick from outer walls near Chickalah (Yell County) on 01/12/2006. Click to enlarge. |
| The degree of damage consists of a heavily damaged roof and some brick removed from the outside of the home. However, the walls are left standing. |
 |
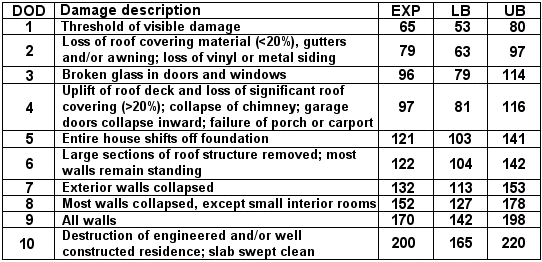
| In the picture: A DOD (degree of damage) list for a one and two family residences. Number 6 on the list fits the damage in this case. |
| Referring to a DOD (degree of damage) guide, it would appear that expected (EXP) winds reached 122 mph (an initial guess for "typical construction"). If construction is worse/better than average, lower bound (LB)/upper bound (UB) winds would be used. |
| Assuming other indicators were surveyed with similar results, the tornado would be rated as "EF2". |
 |
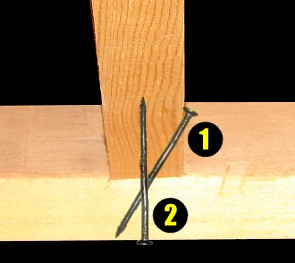
| In the picture: Toenailing (1), or driving nails in at an angle to fasten boards, would be viewed as typical construction. End nailing (2) might qualify as below average, with above average status for the use of hurricane clips. |
|
|