1991-2020 Frost/Freeze Climatology of Eastern Kentucky
Farmers and gardeners are always interested in the average dates of the first and last frost and freeze for an area. This information allows them to plant the proper crops for their area and to know when to plan for planting and harvesting of their crops. These dates vary depending on location and topography, and in some cases they can differ a great deal. The varied terrain of eastern Kentucky causes quite a bit of variation in the average frost/freeze dates and in the article below, we will describe the climatology of the first and last frost and freeze of eastern Kentucky using a statistical approach.
Methodology
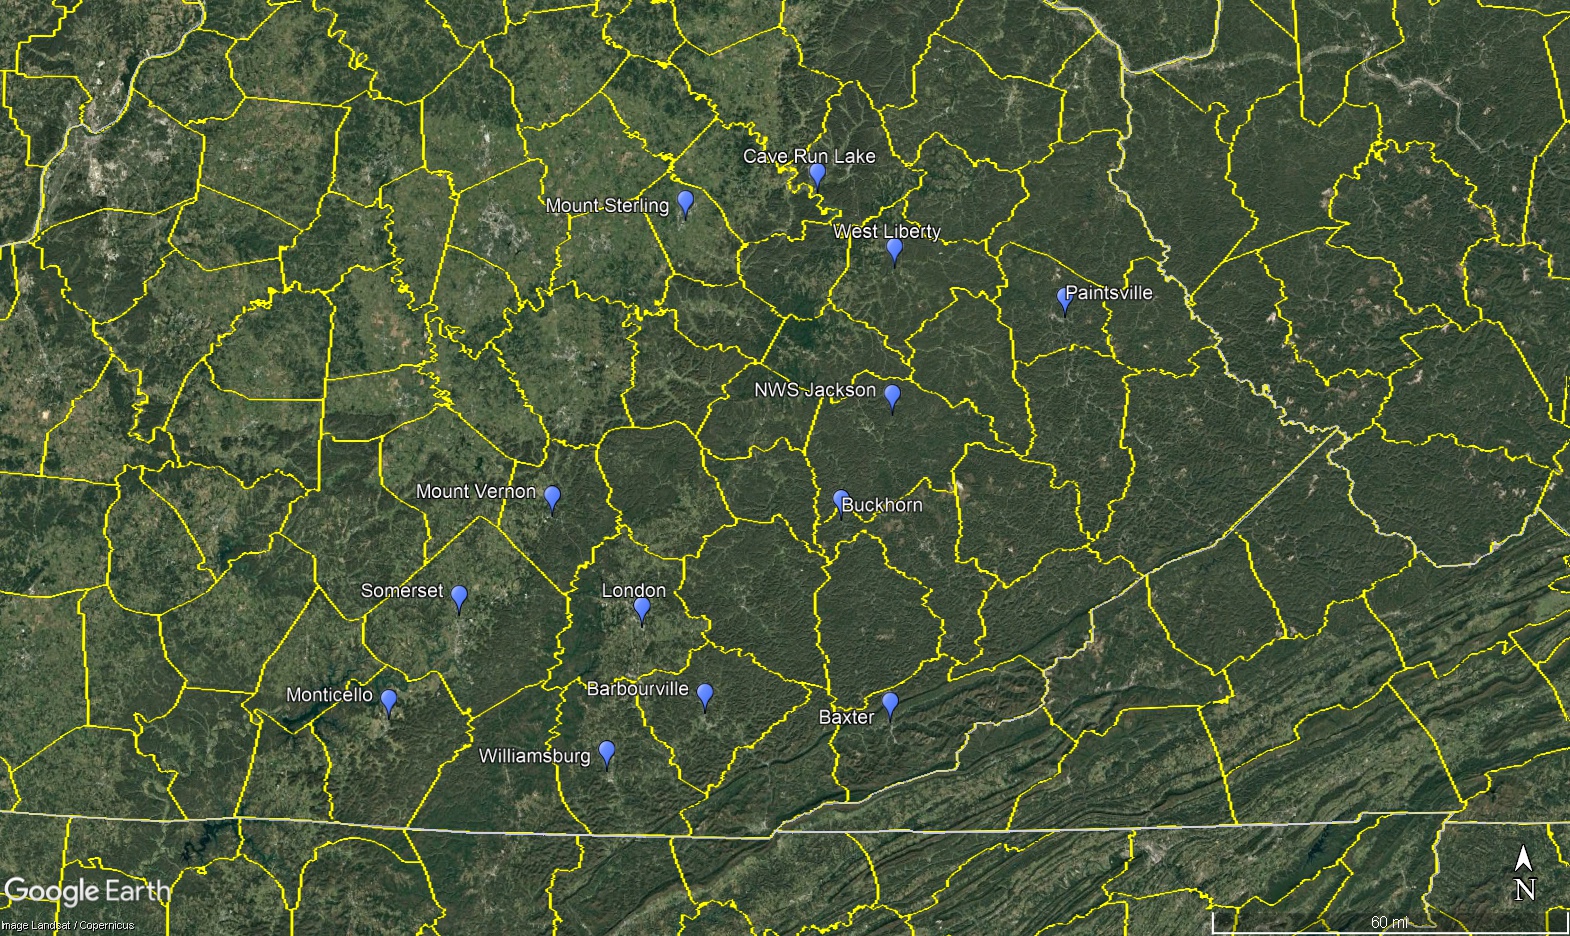
Dates of the last 28ºF, 32ºF and 36ºF temperatures each spring and the first 36ºF, 32ºF and 28ºF temperatures each fall were analyzed using a percentile rank analysis for several surface observing sites over east Kentucky. The observing sites include first-order reporting stations, such as the Jackson National Weather Service Office and the London-Corbin Airport as well as several long-running cooperative weather observing stations.
Stations Used in Frost/Freeze Climatology Study
 |
The first/last 36ºF temperature was used to approximate the date of first/last frost for the growing season, 32ºF being the date of first/last freeze and 28ºF approximating the date of first/last hard (killing) freeze for the growing season.
|
|
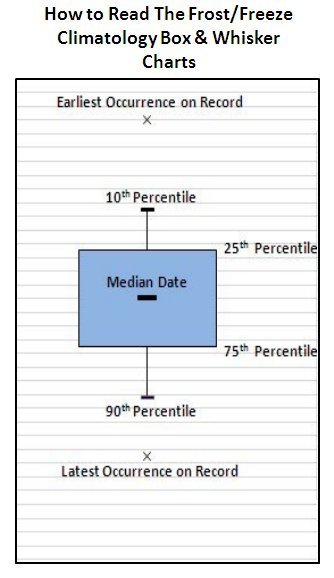
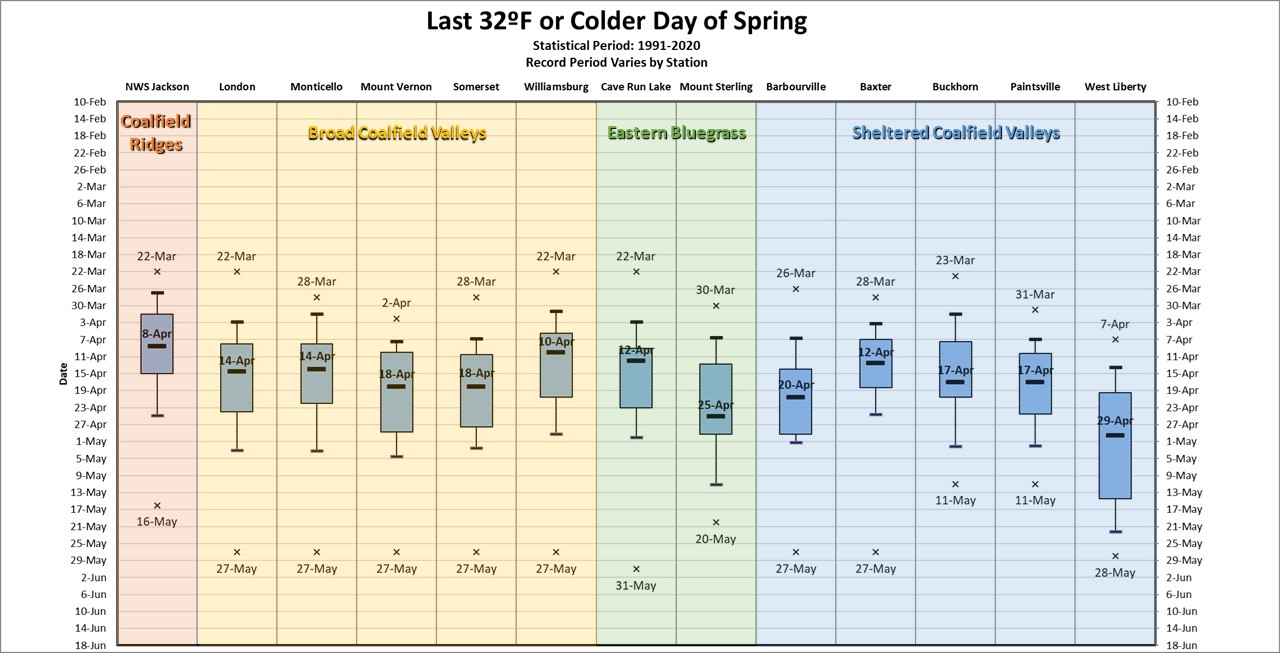
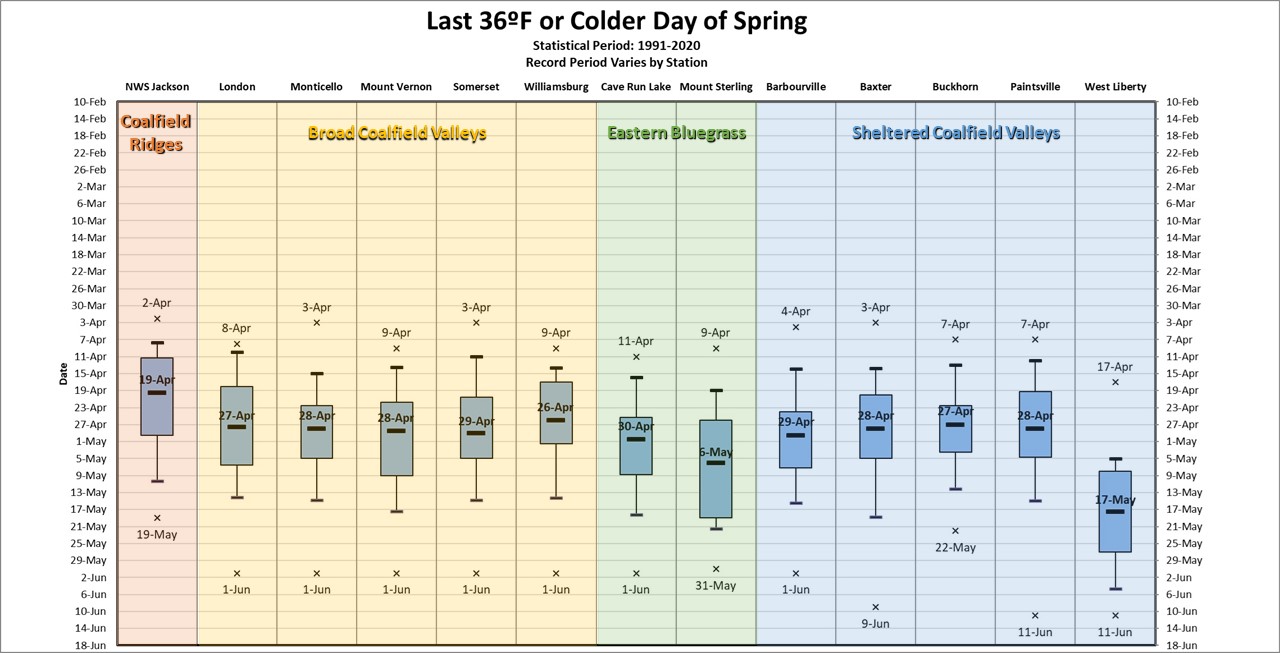
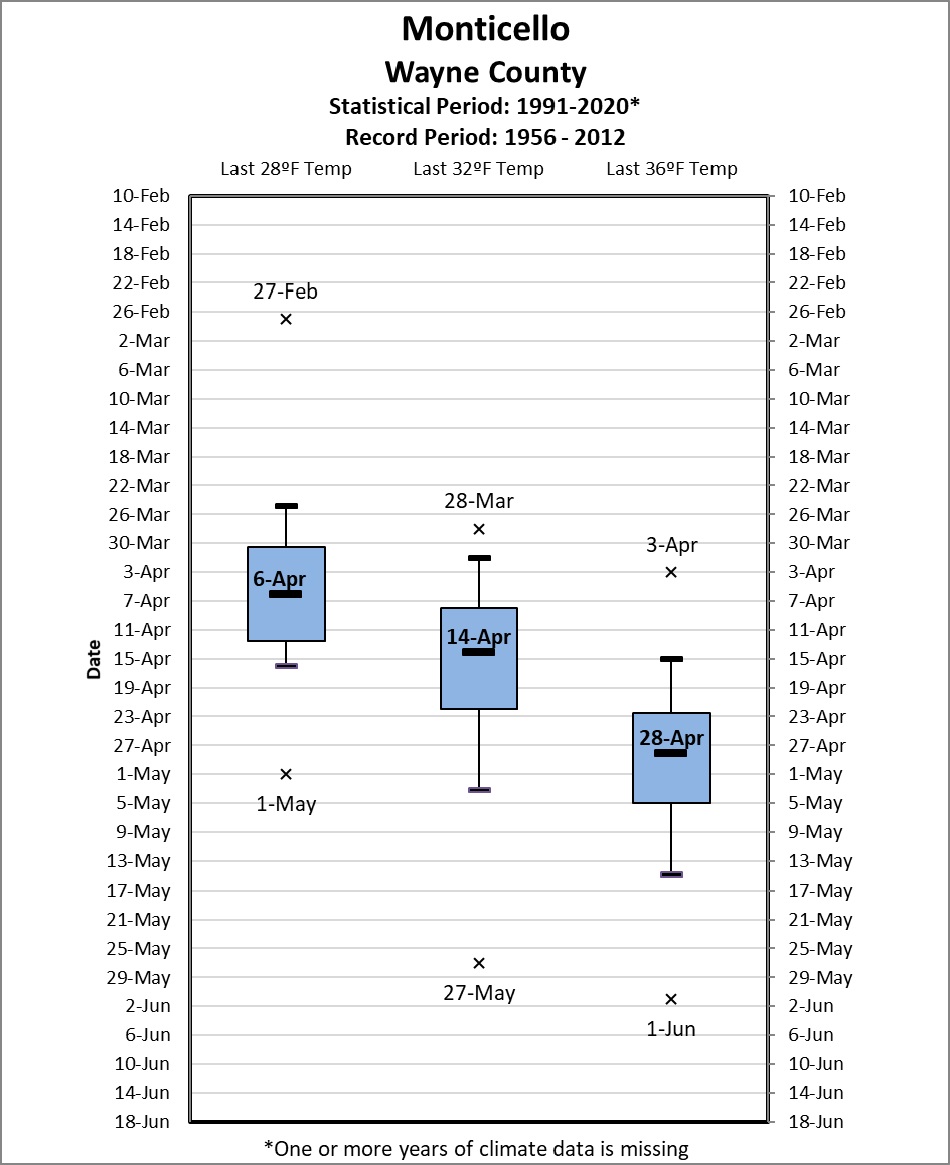
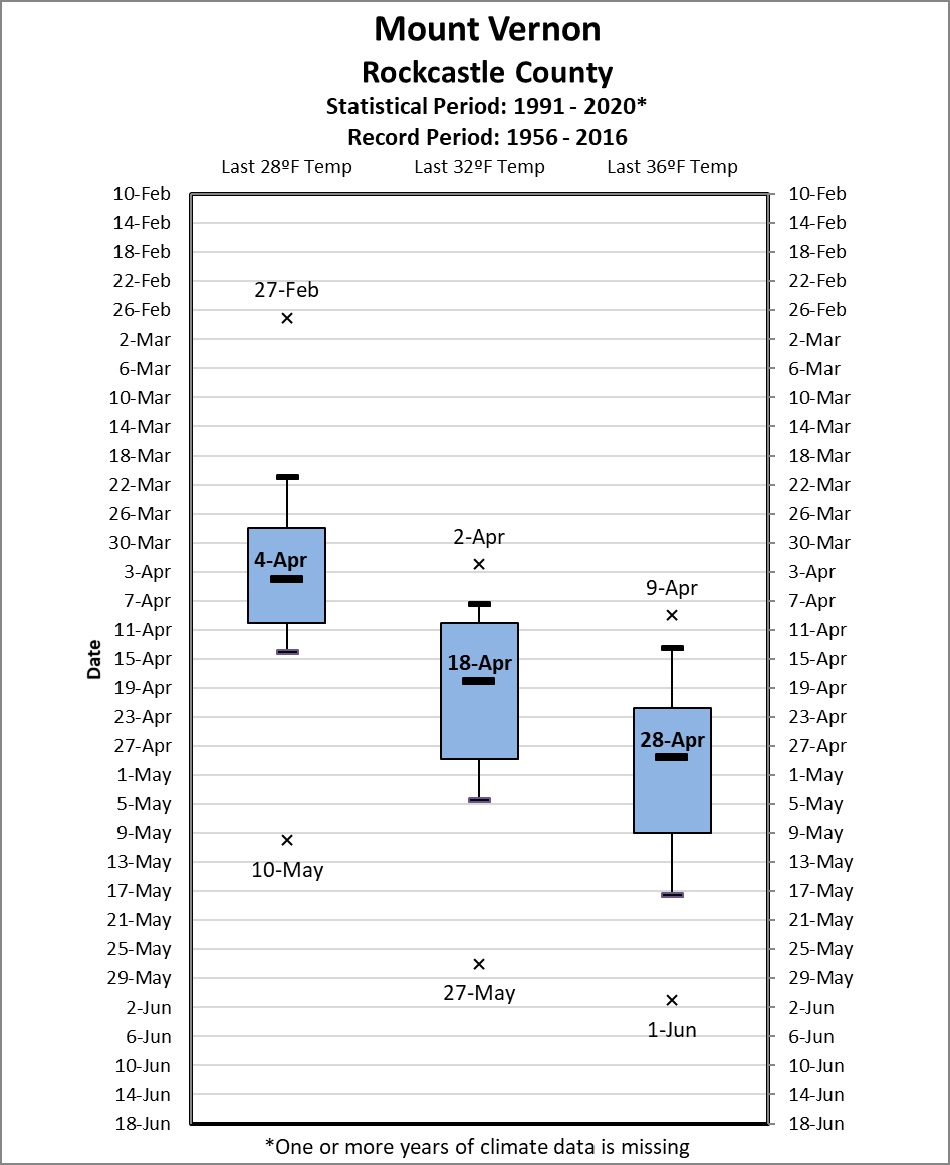
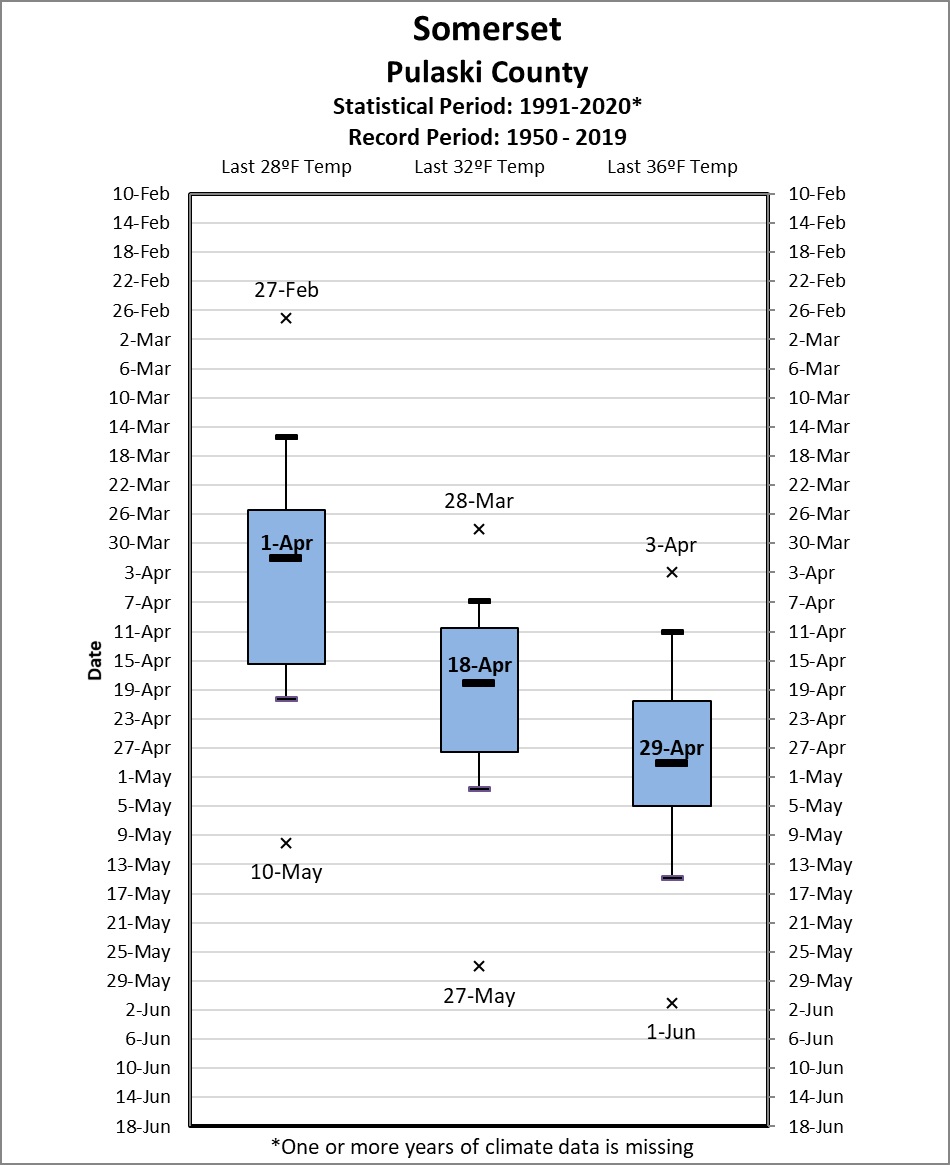
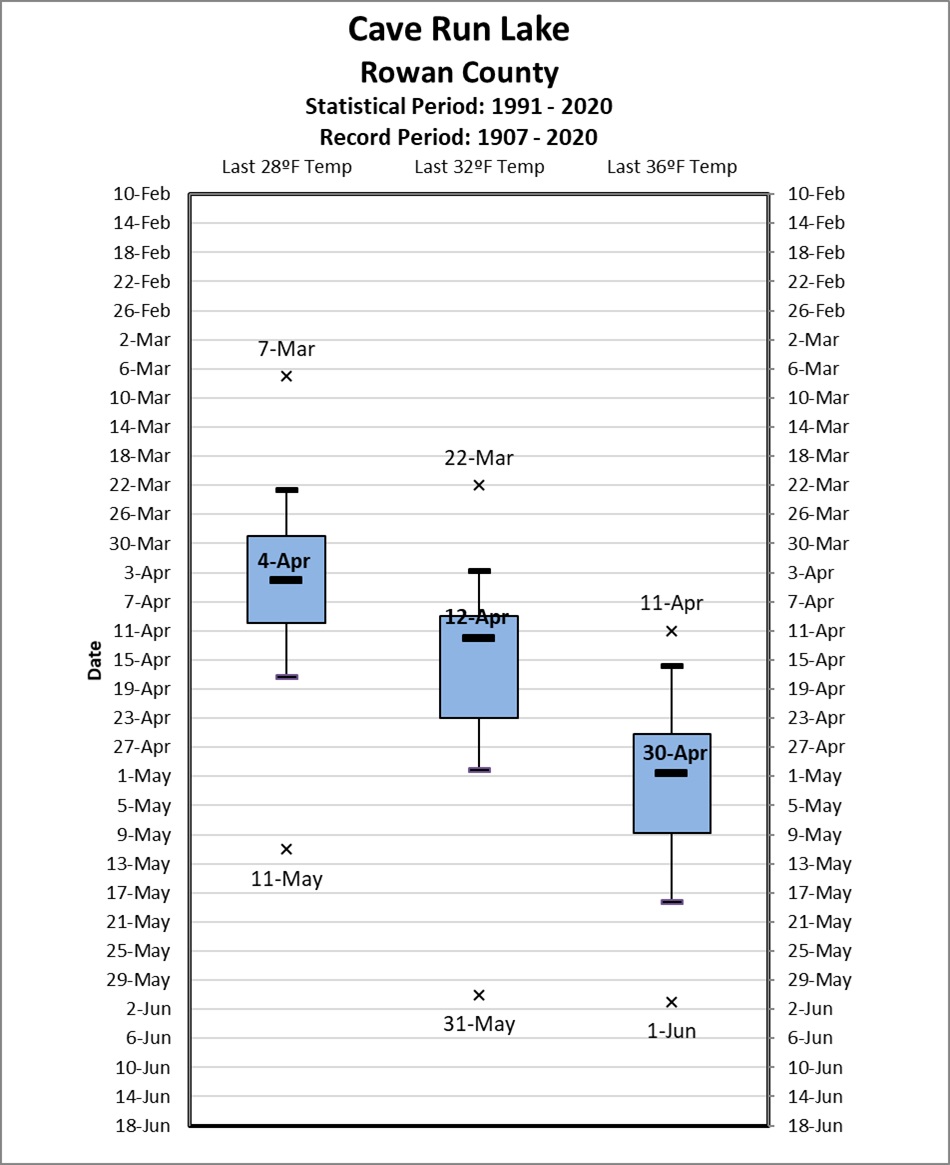
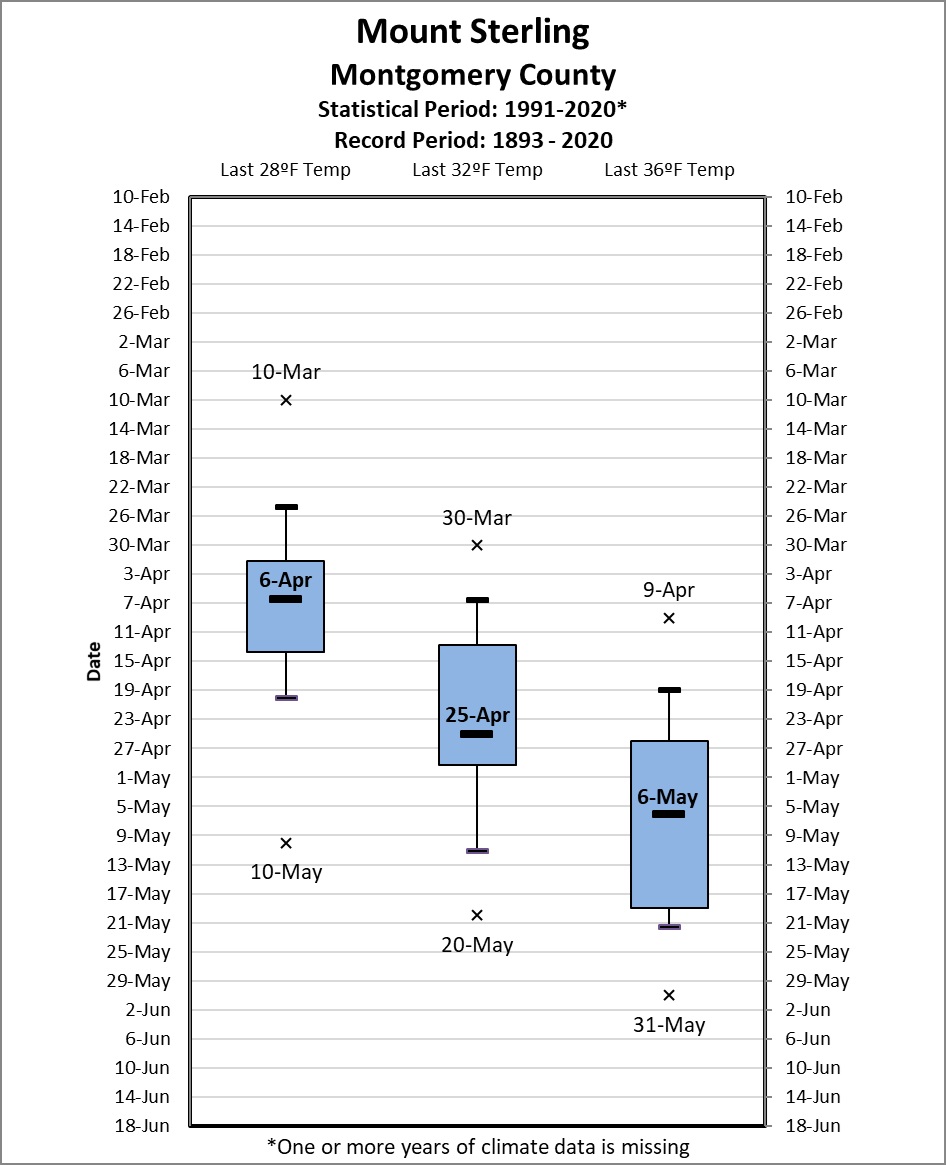
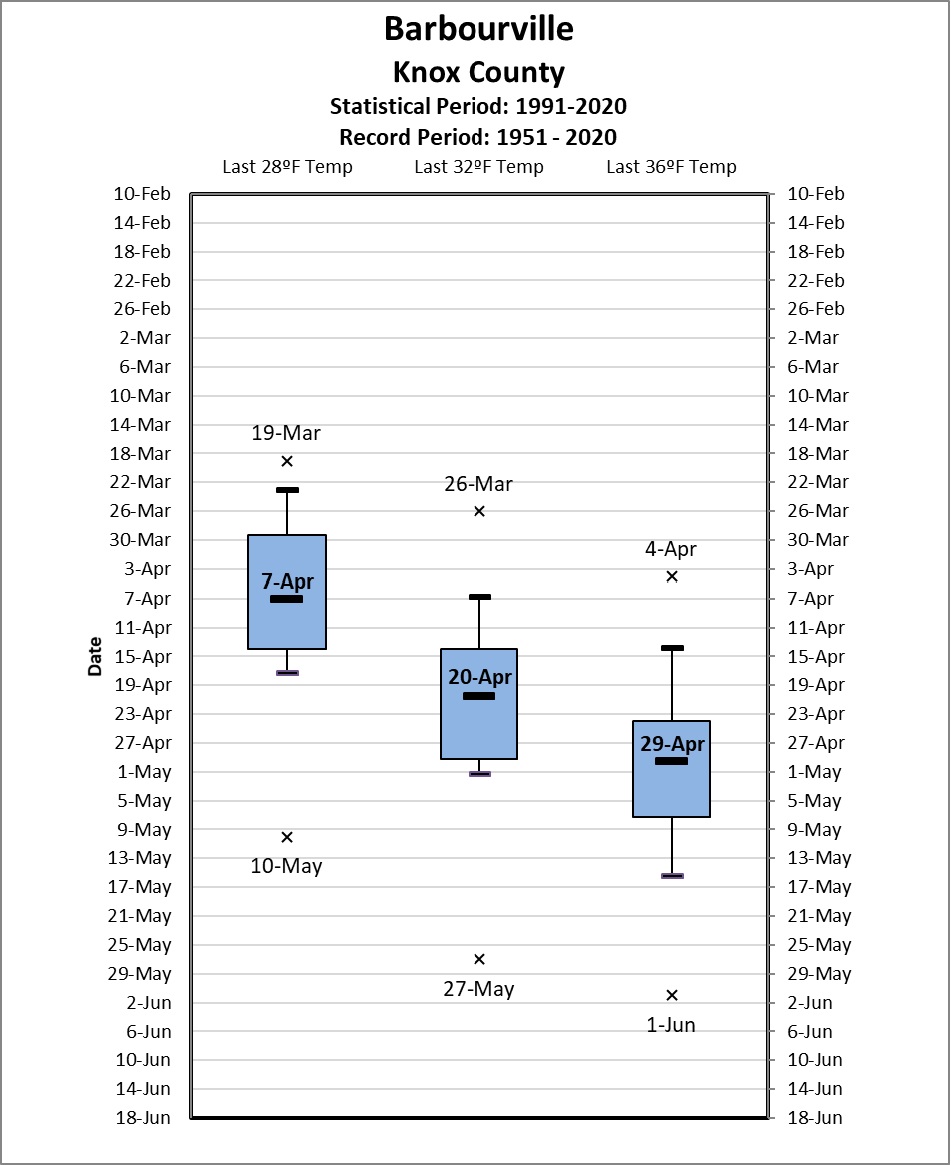
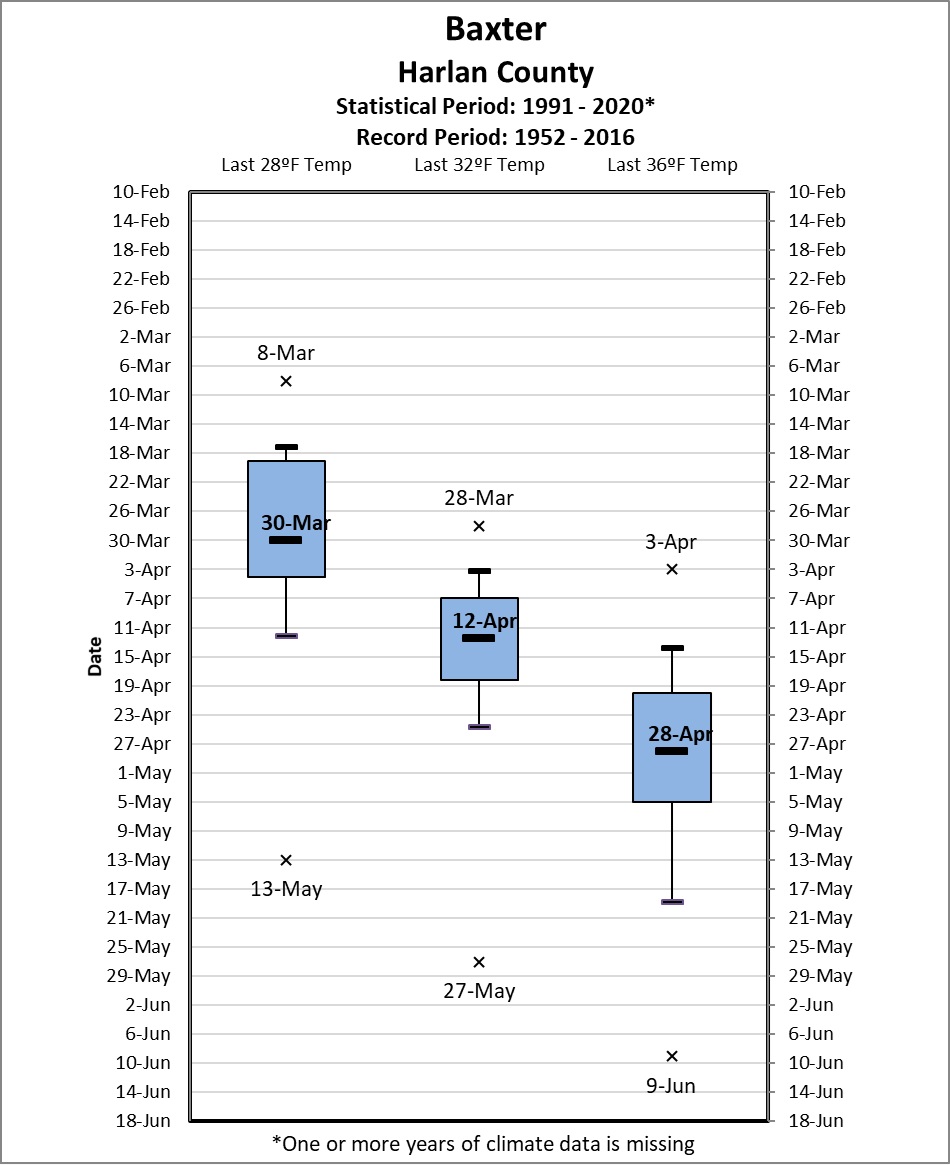
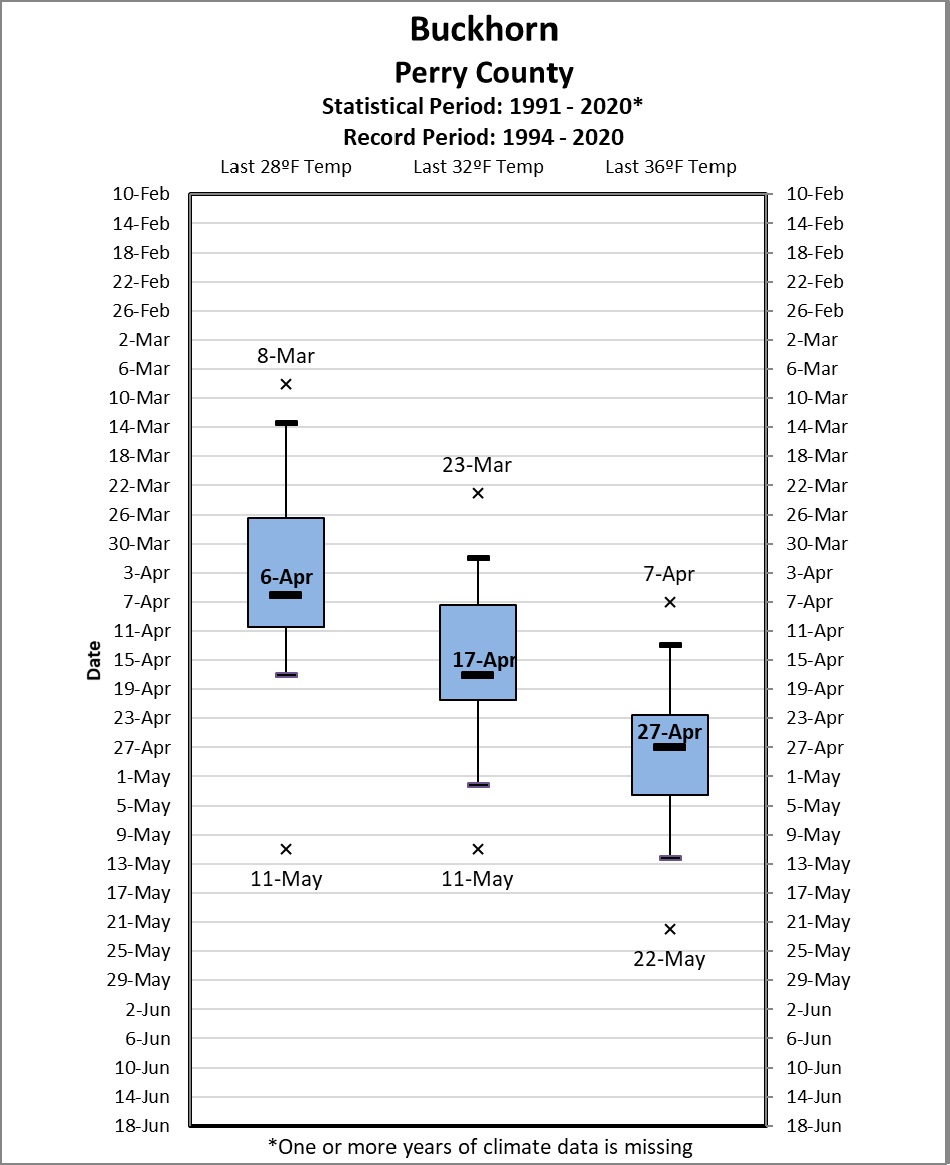
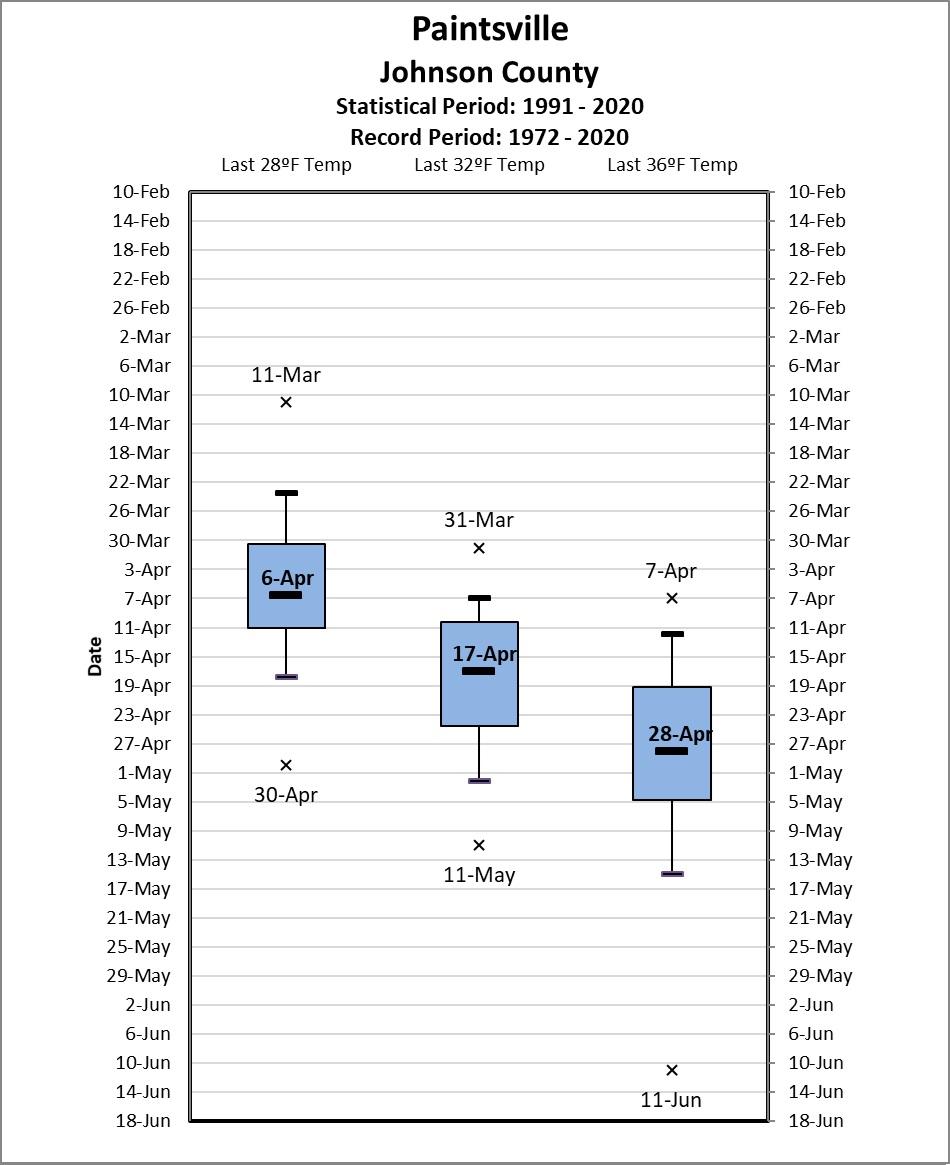
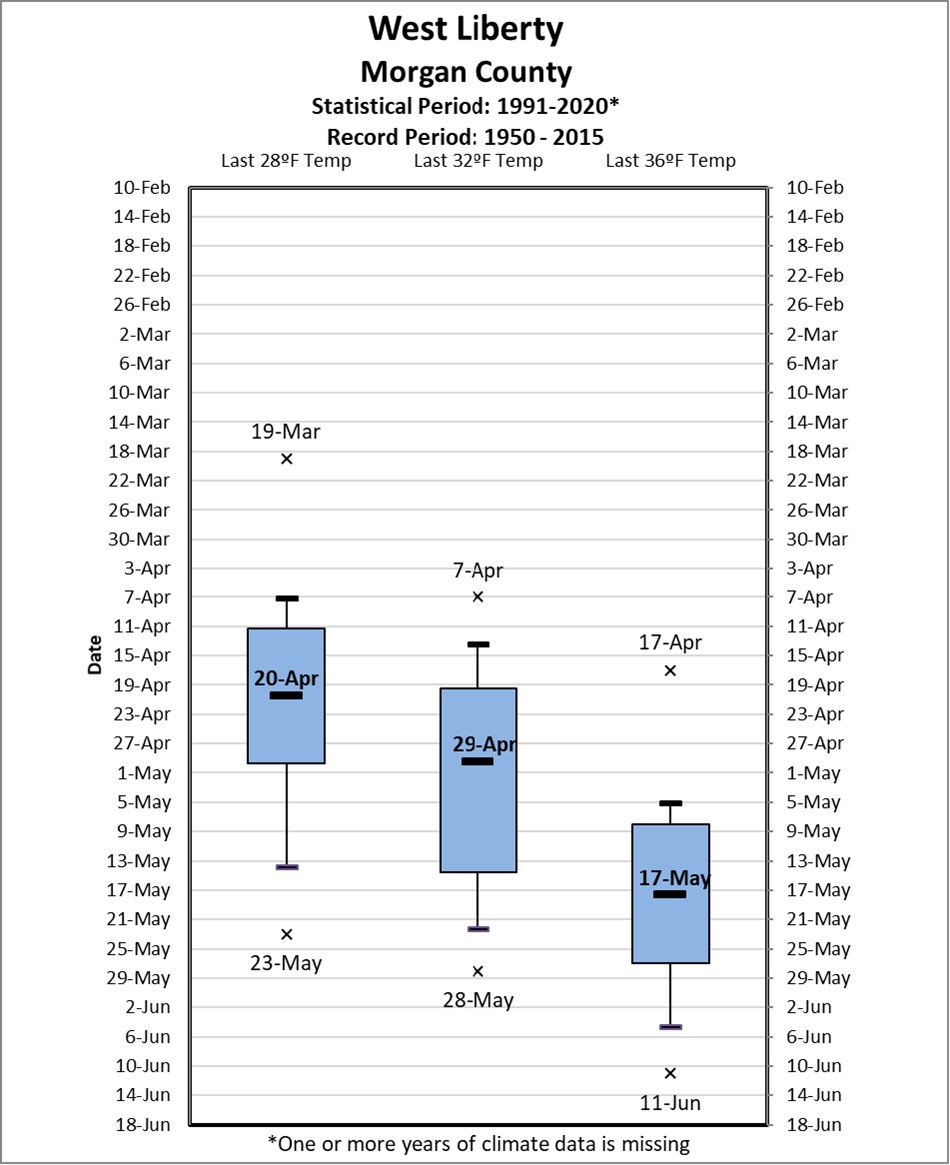
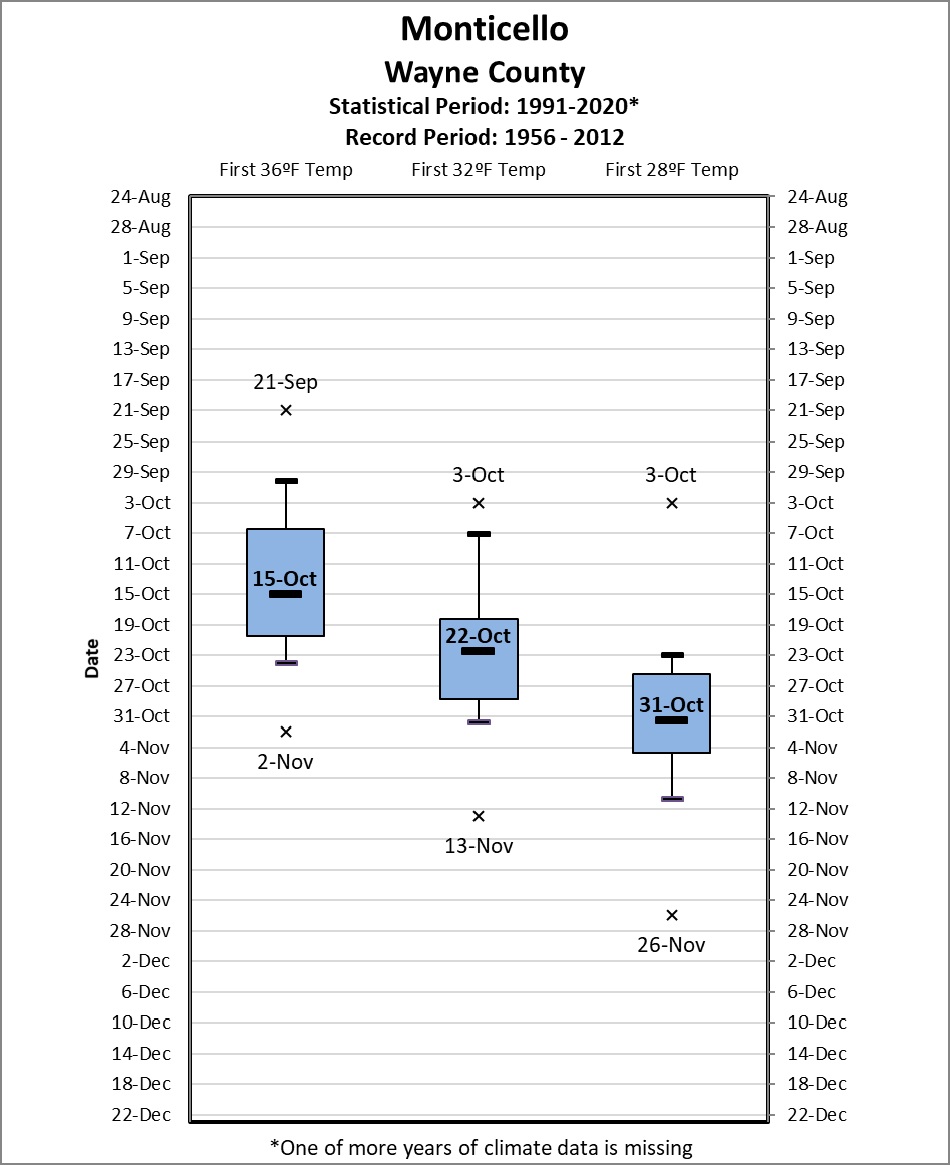
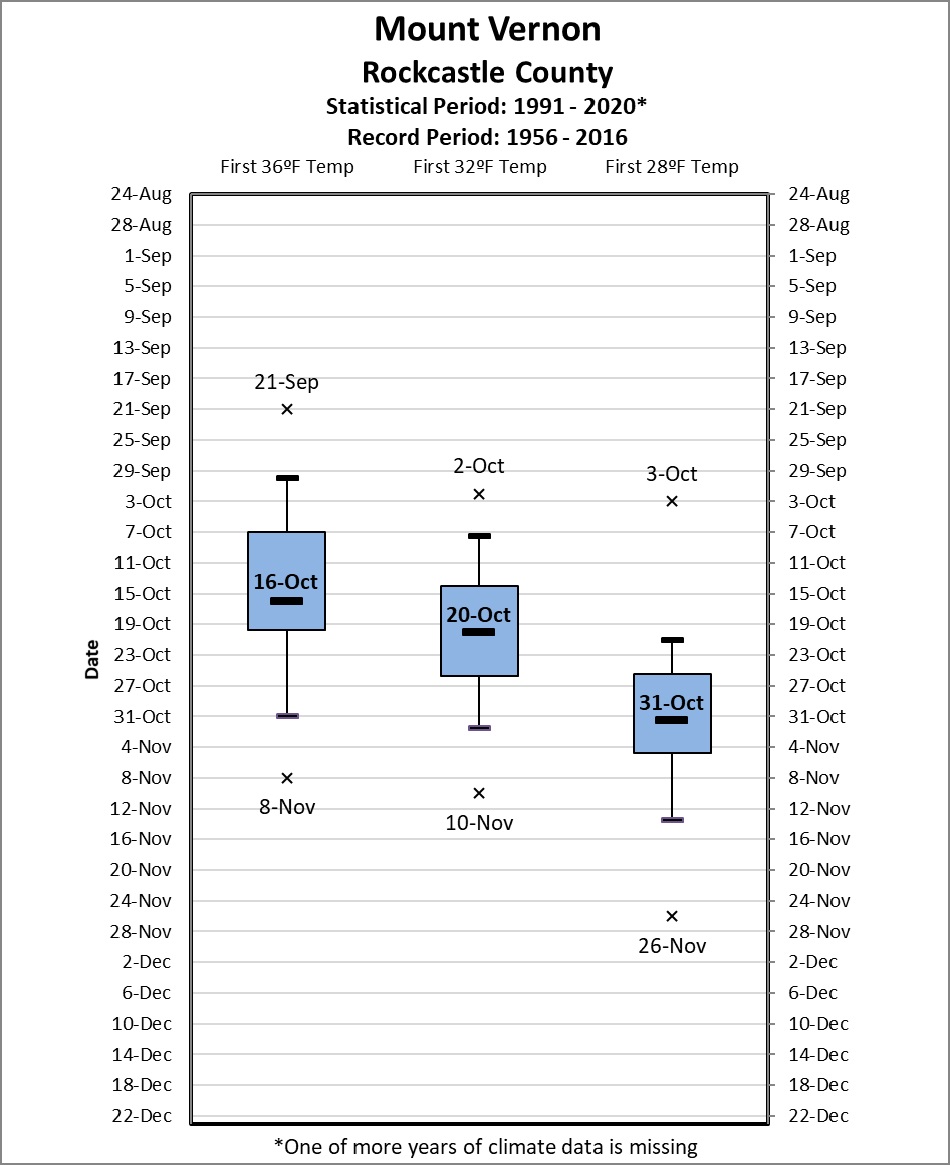
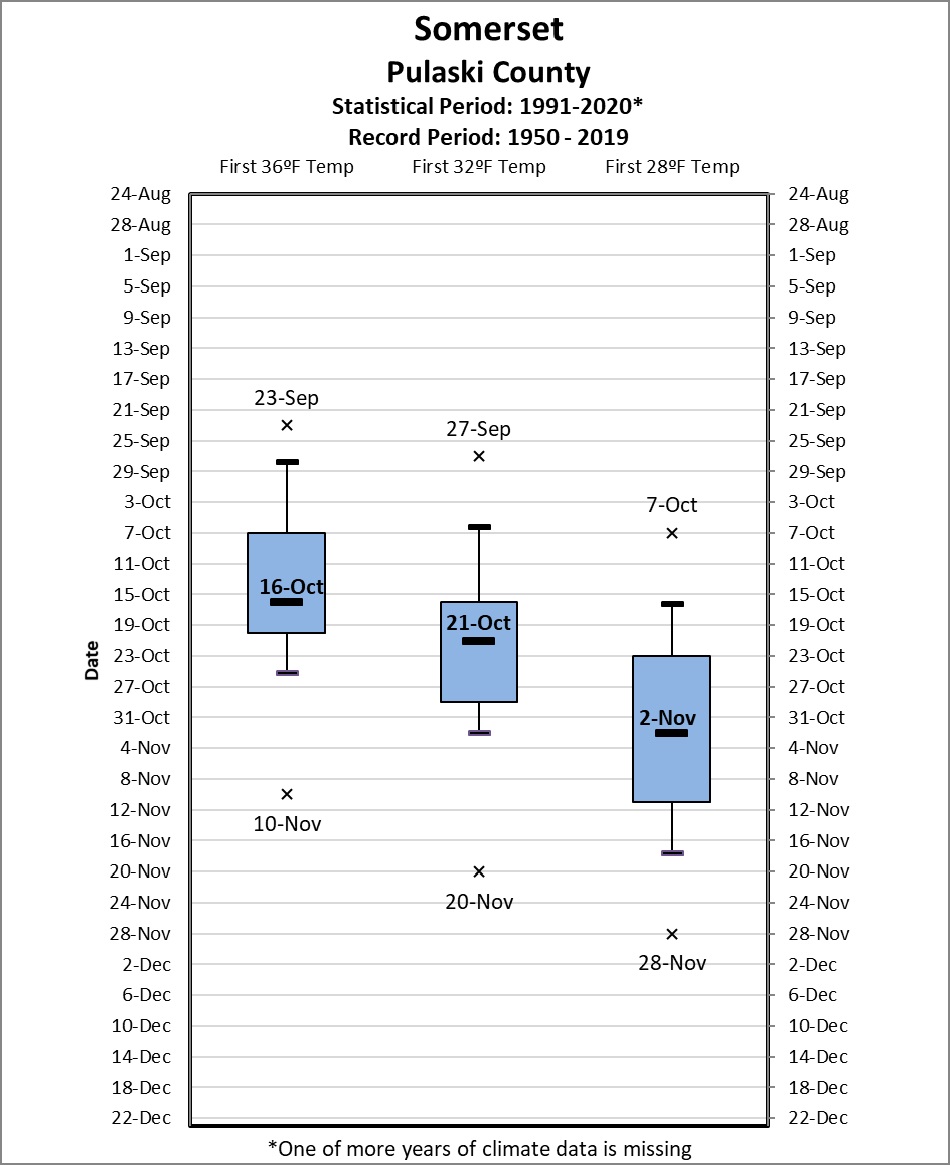
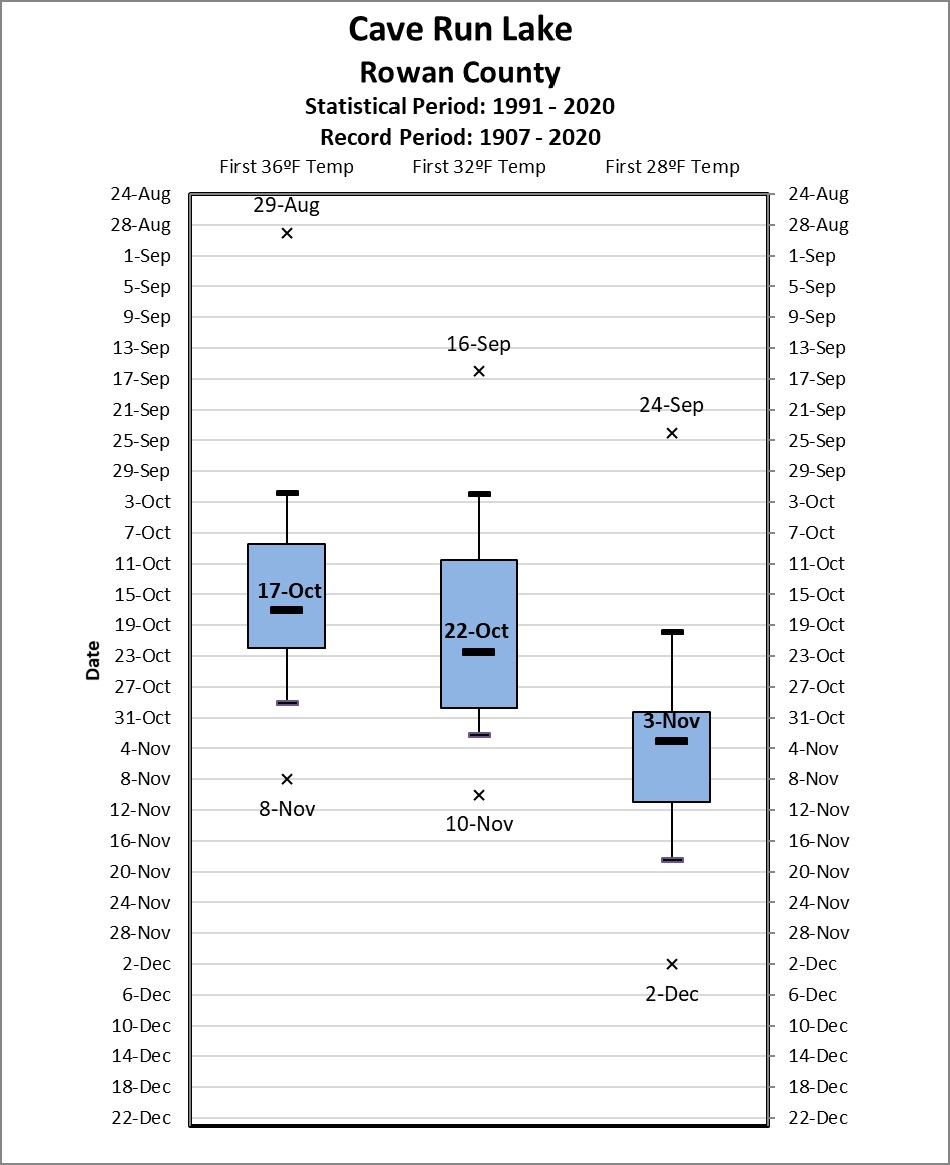
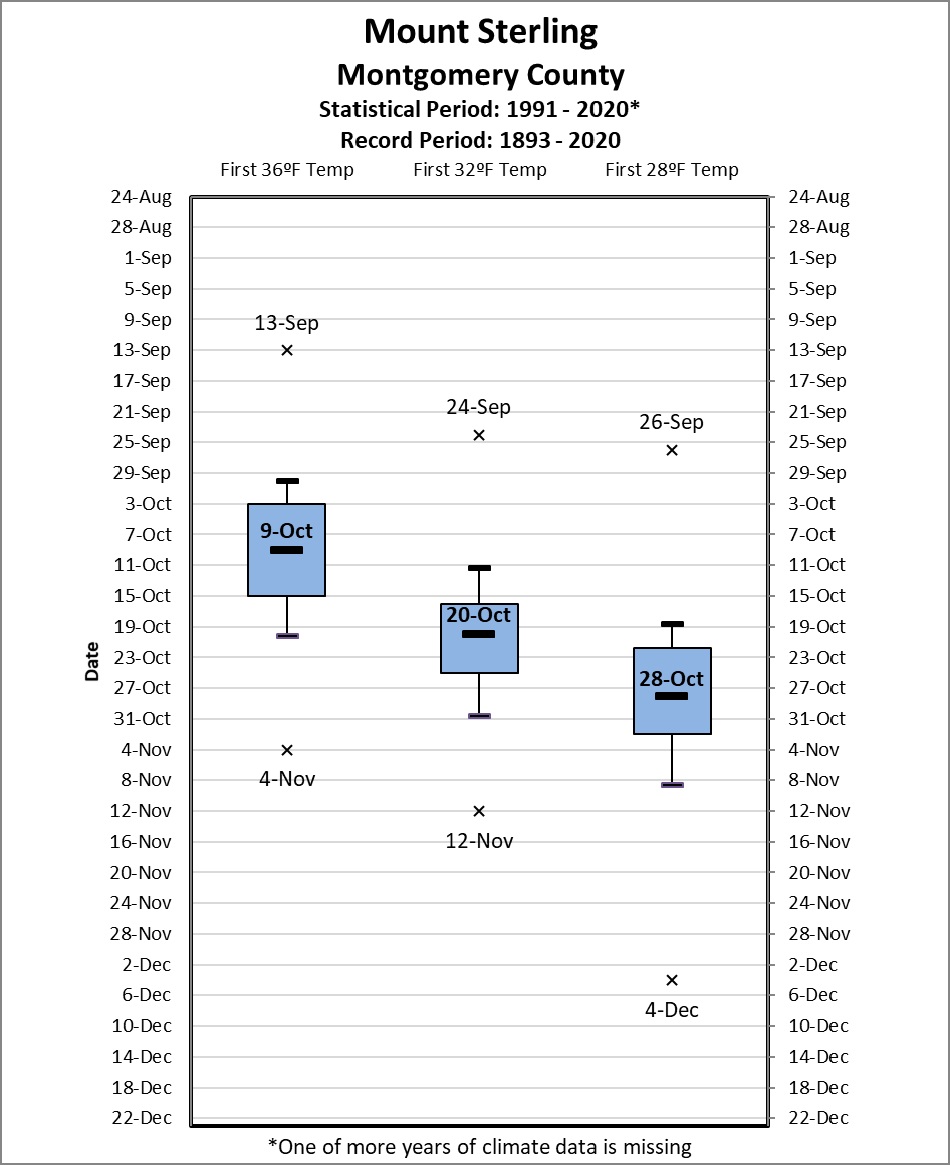
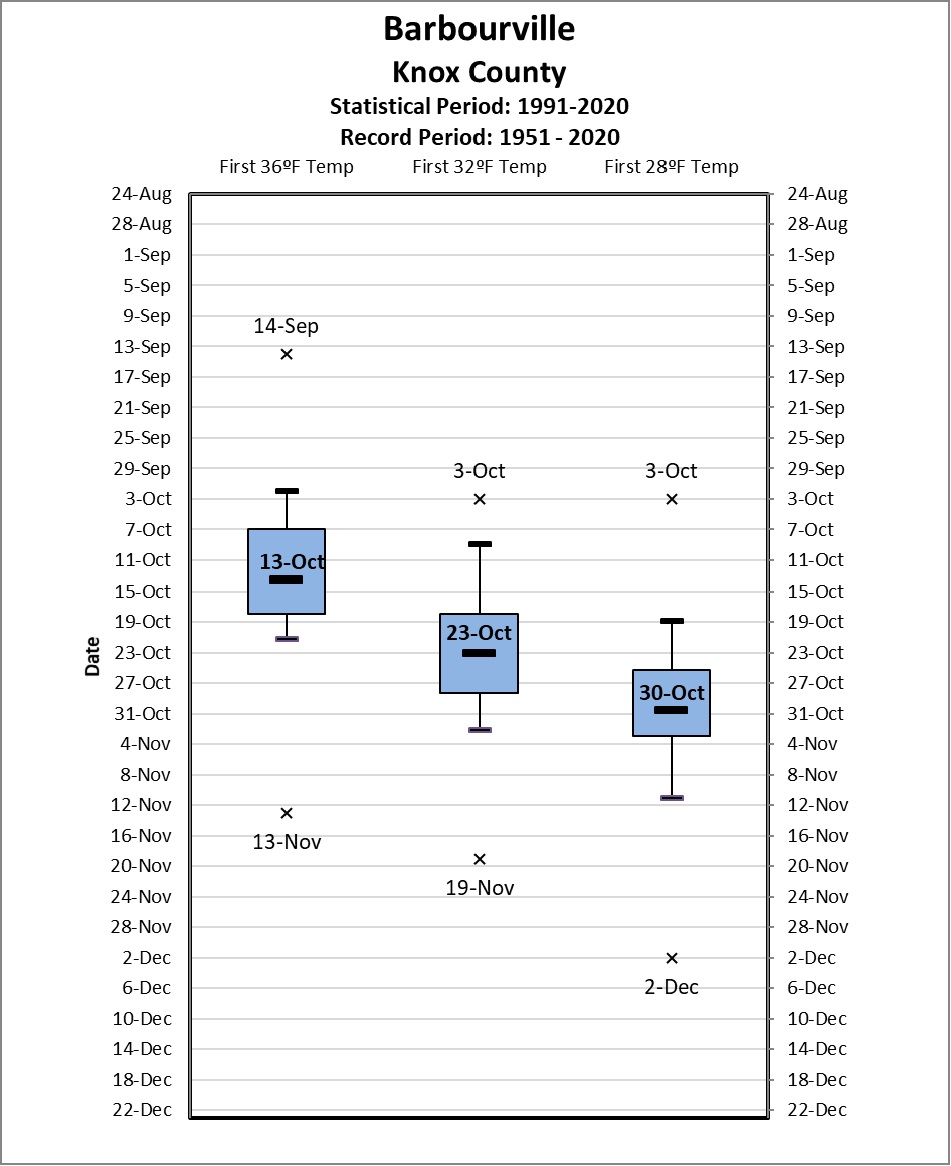
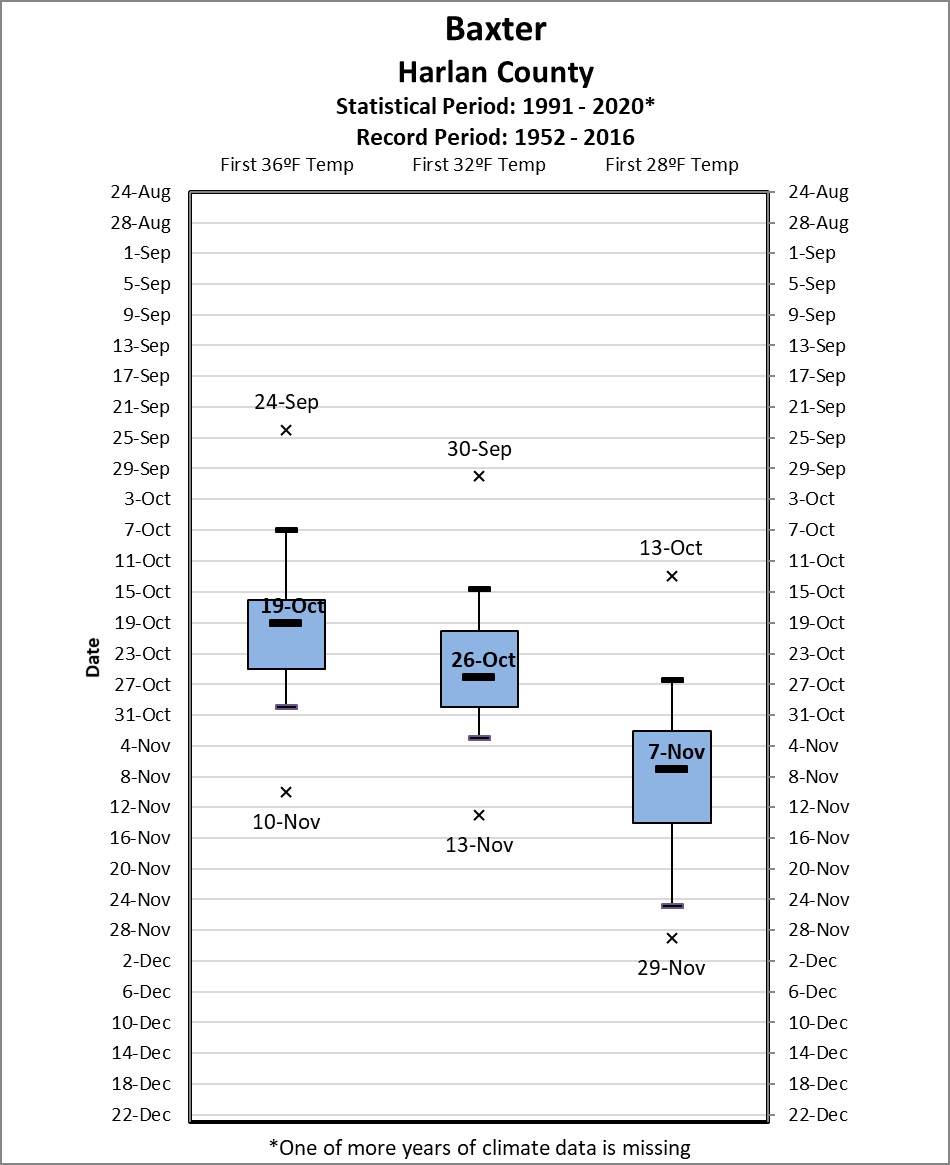
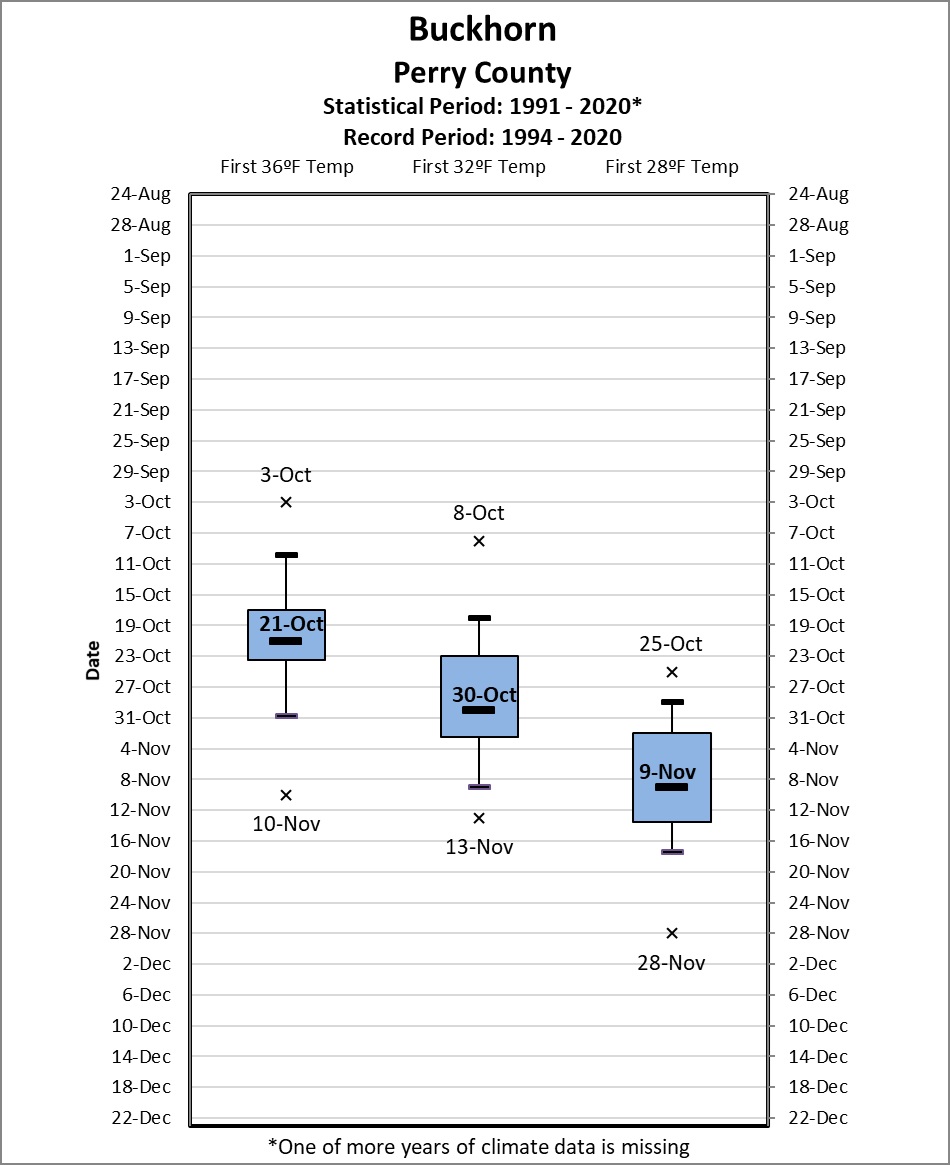
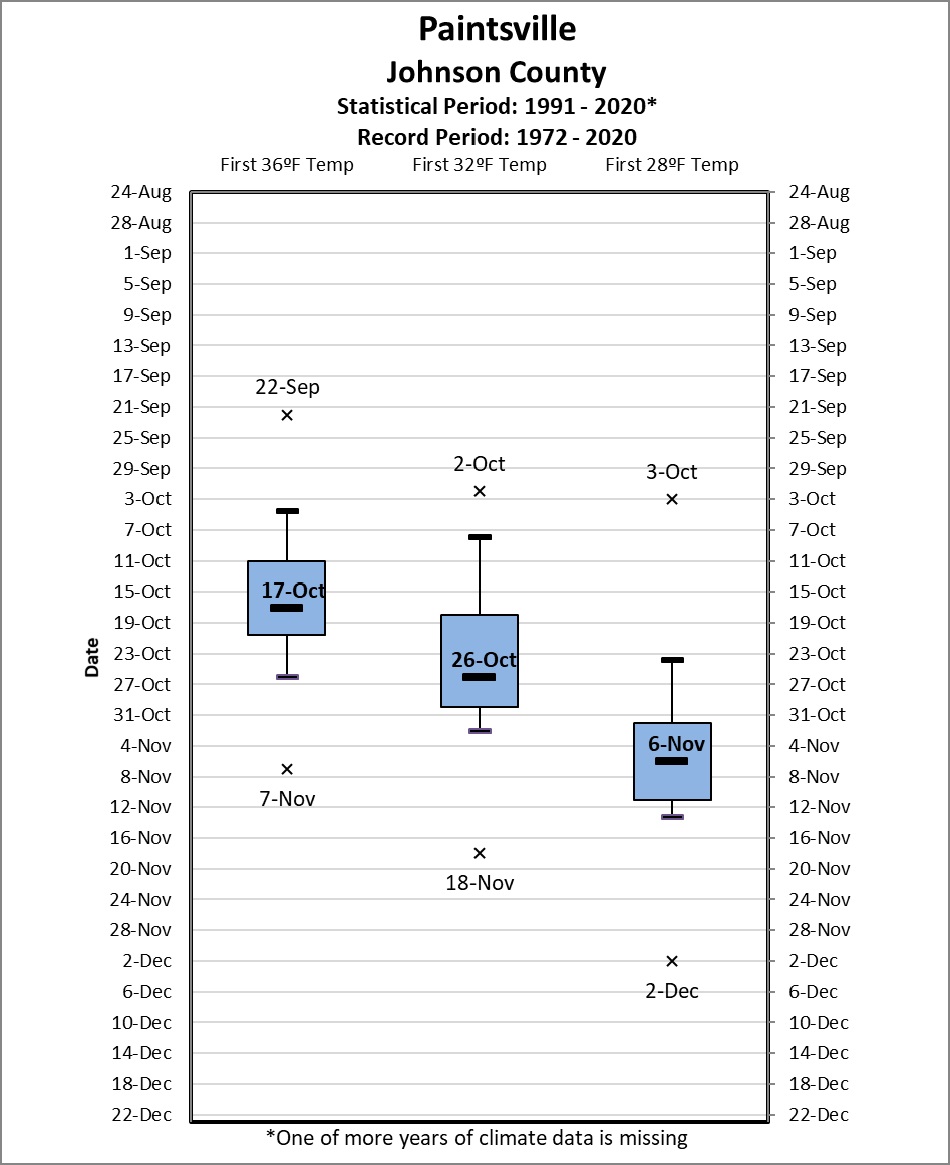
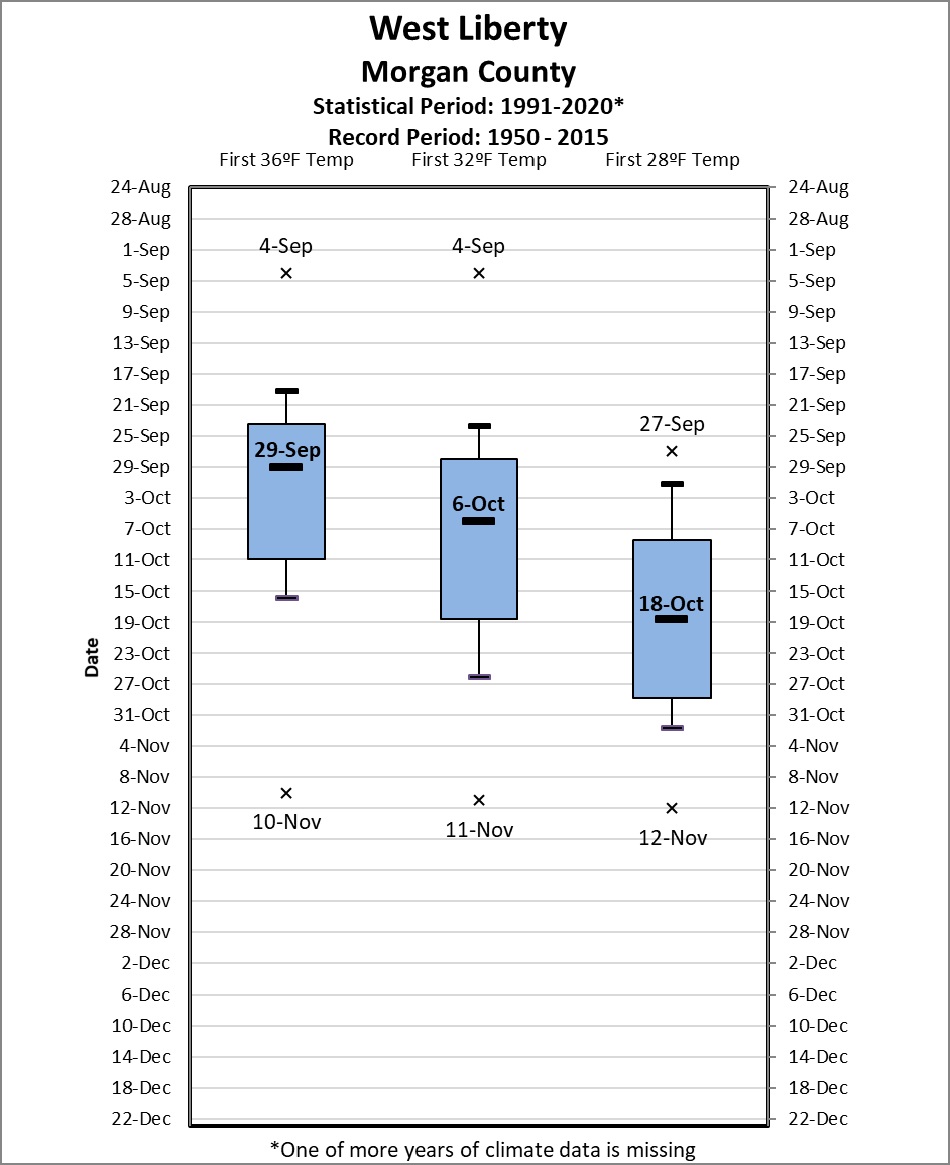
Box and whisker diagrams were employed to view the data. An example of the diagram format is shown at left. The shaded region of each graph (i.e., "the box") shows the middle 50% of the range of first and/or last frost/freeze dates. The top of the box is the 25th percentile and the bottom is the 75th percentile. The solid line within the box shows the median (or 50th percentile) first and/or last frost/freeze date for that location. The lines extending upward and downward from the box (i.e., "the whiskers") reach to the 10th and 90th percentile of the data distribution. That is, only 10% of the data lies above and below the ends of the whiskers. Lastly, the "x" indicates the extreme (record) freeze date during the period of record for that particular location. The intent of the box and whisker format is to give a comprehensive view of the range of first and last frost/freeze dates at individual sites, and facilitate comparison between different locations.
|
Finally the data was organized and graphed according to physiographic region. Click here for more information on the physiographic regions of the National Weather Service Jackson forecast area from the Kentucky Geological Survey.
Variation in frost/freeze dates due to topography
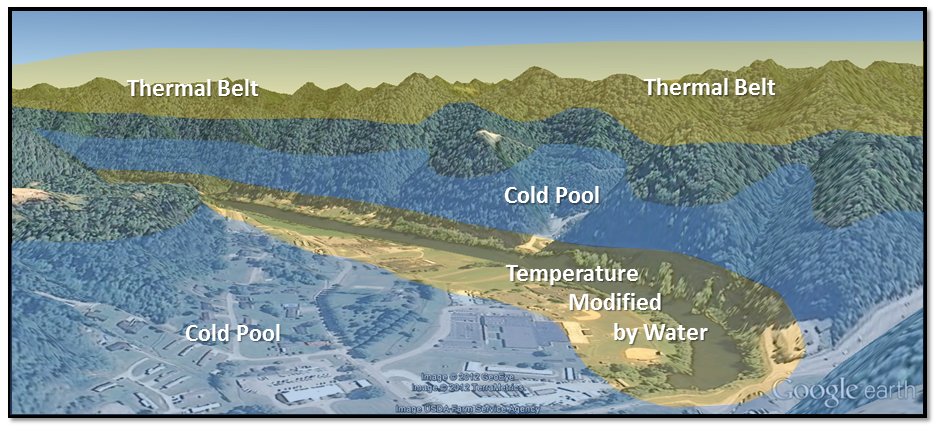
Much of the eastern third of Kentucky, known as the Eastern Coalfields physiographic region, is characterized by rugged, steep terrain. While elevation differences between valley bottom and adjacent ridge tops do not usually exceed 1000 feet, the steepness of the slope creates many sheltered valleys (and hollows), especially east of Interstate 75. The resultant sheltering from the mean wind and earlier sunset/later sunrise promote rapid inversion development during high pressure regimes (light winds, clear skies, etc.), thus maximizing cooling. Nighttime fog often forms in the valleys of main stem rivers and larger tributaries, modifying temperatures and producing a later first frost/freeze date than the narrow hollows in the fall, and a corresponding earlier last frost/freeze date in the spring. Finally, with the cold air pooling in the valley bottoms, a warm layer of air often forms at ridge top level. This is known as the thermal belt and it causes a much later first frost/freeze date to be found on the ridges in the fall, and an earlier last frost/freeze date in the spring, as evident by data from atop Sugar Camp Mountain where National Weather Service Jackson is located. It is also important to note that the Coalfields region from near I-75 westward to the Escarpment is flatter, with population centers largely occurring in broad valleys or even on plateau-like locations. Though some localized significant variations undoubtedly exist in this portion of the Coalfields, the frost/freeze dates in this area tend to be more equable from location to the next. The topographic variations in location create the most dramatic differences in frost/freeze climatology for eastern Kentucky, not necessarily how far north or south a station lies.
 |
|
Idealized illustration of cold pool and thermal belt structure typically found during clear, calm nights in the mountainous terrain of east Kentucky. Also illustrated is an example of temperature modification due to a body of water, in this case a small lake.
|
The other significant physiographic regions of east Kentucky, the Eastern Bluegrass or “Knobs” and Mississippian (or Pennyroyal) Plateau region have less rugged terrain when compared to the Coalfields, and typically less variation in temperature from location to location. For the purposes of this article, Somerset and Monticello (which lie in the transition zone between the Pennyroyal Plateau and Coalfields regions) are included as Broad Coalfield Valley locations.
Spring Frost Climatology
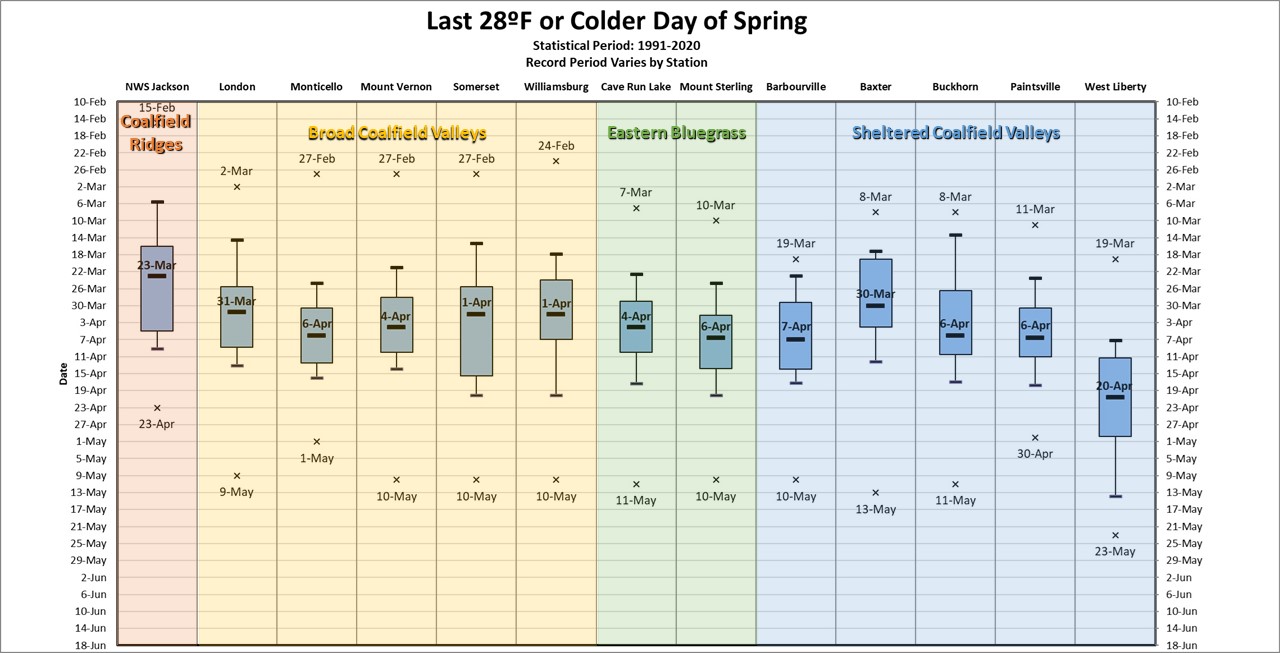
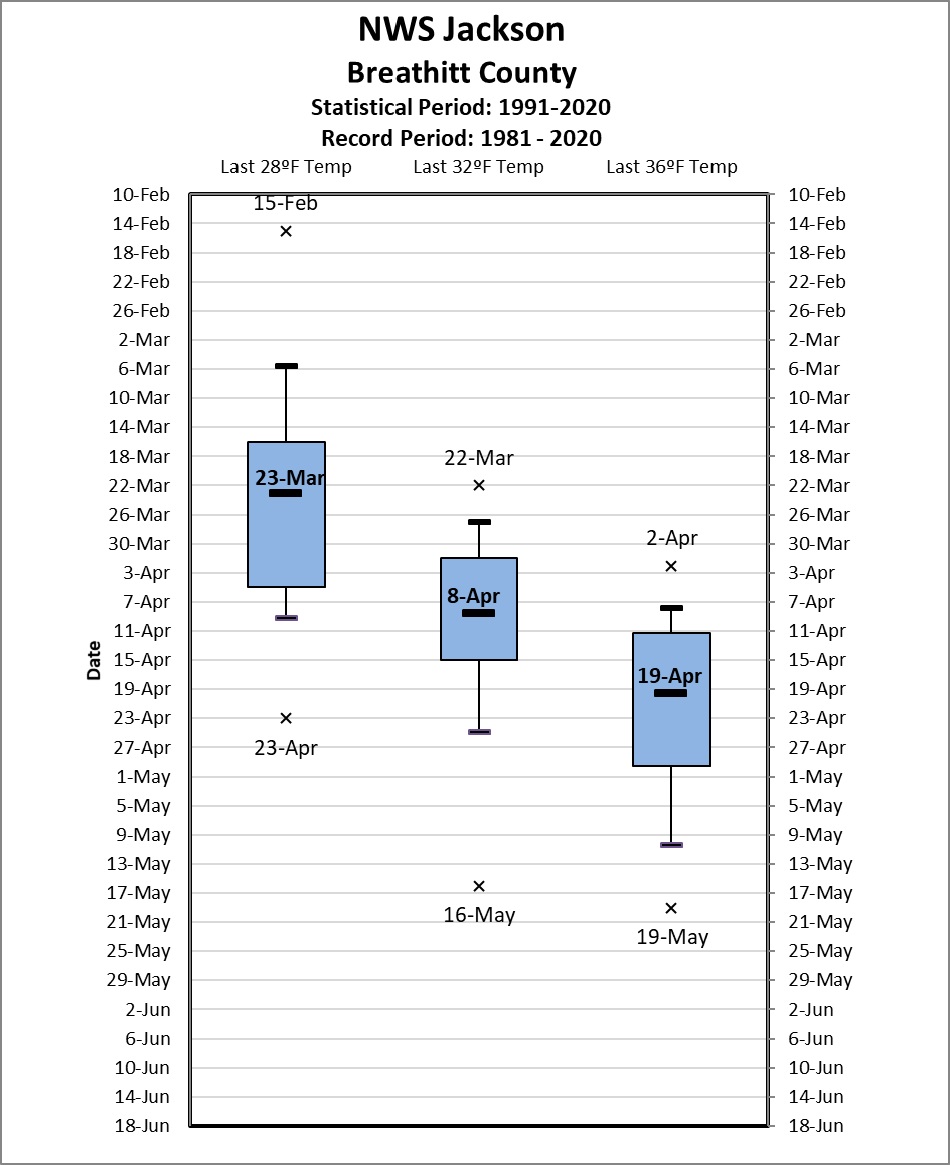
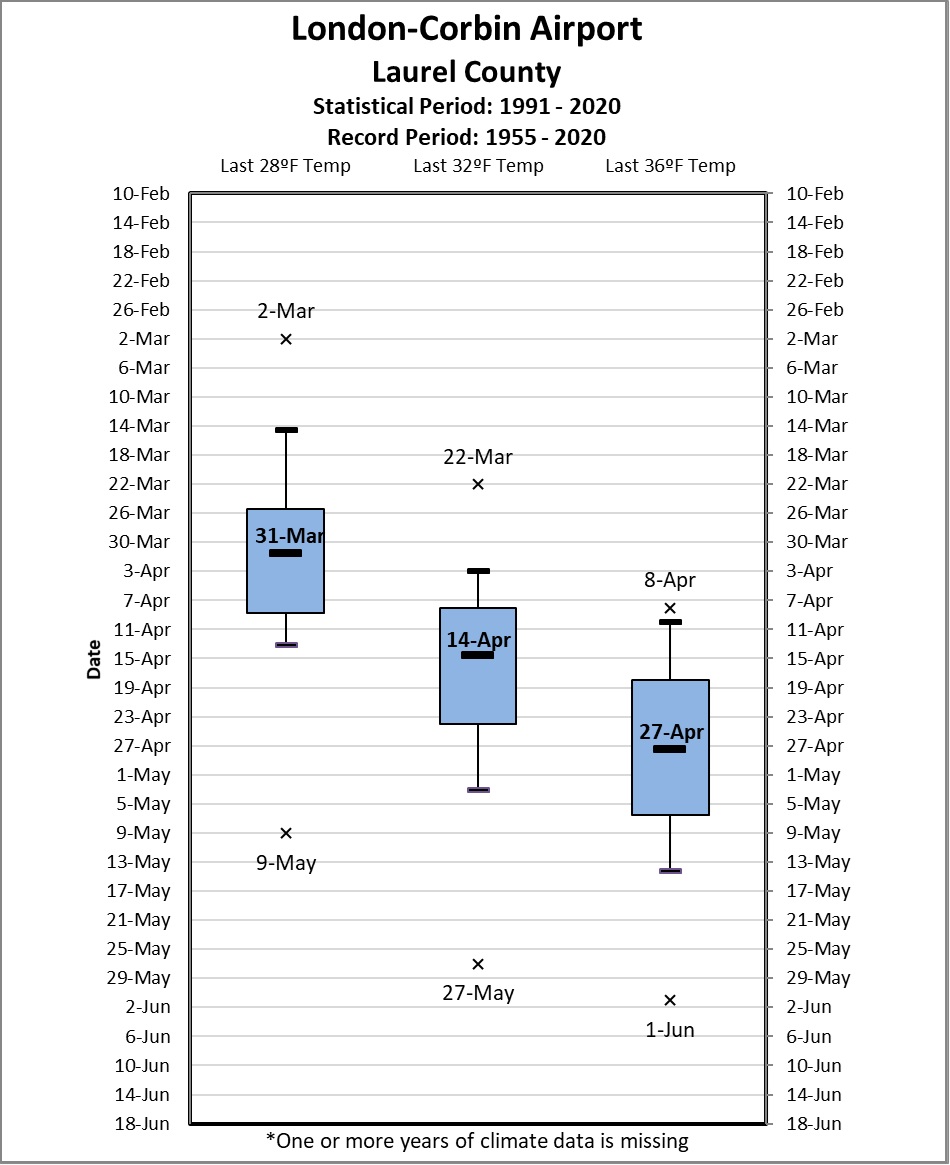
During the 30-year period from 1991 to 2020, the typical last hard freeze of spring, defined here as the last 28ºF or colder temperature, in the Broad Coalfield Valleys and Eastern Bluegrass occurrs from March 31st to April 6th. In the Sheltered Coalfield Valleys, that date ranges from as early as March 30th at Baxter to as late as April 20th at West Liberty. However on the ridges in the Coalfield region, the median date of last hard freeze occurs as early as the 23rd of March. Hard freezes have occurred as late as the last week of May at West Liberty. The remaining stations in the study show a latest hard freeze occurring no later than the second week of May. Last hard freezes have occurred as early as the last week of February or first week of March for most locations outside of the northern Sheltered Coalfield Valleys and Coalfield Ridges.
 |
| click on image for more detail |
Spring Freeze Climatology
During the 30-year period from 1991 to 2020, the typical last freeze of spring in the Broad Coalfield Valleys occurs between April 10th and April 18th. For the Sheltered Coalfield Valleys and Eastern Bluegrass, those dates range from April 12th to April 29th. The later median freeze dates occur in locations that are not substantially influenced by rivers or other large bodies of water. However on the ridges in the Coalfield, the median date of last freeze occurs as early as April 8th. Last freezes have been recorded as late as mid-to-late May or as early as the last 10 days of March at a vast majority of stations.
 |
| click on image for more detail |
The median date of last 36ºF or colder temperature can be used as a proxy for the last frost of spring. During the 30-year period from 1991 to 2020, the median date of last frost in the Broad Coalfield Valleys ranges from April 26th to April 28th. In the Eastern Bluegrass and Sheltered Coalfield Valleys, the last median frost date ranges from April 27th to May 17th, again with proximity to a modifying water body being strongly evident. However, on the ridges in the Coal Field region the median date of last frost is as early as April 19th. Last frosts have been observed as late as June 11th at West Liberty and Paintsville stations and June 9th at Baxter station, but latest frosts have occurred around June 1st at the majority of stations. The earliest date of last frost is in early April at the most of the locations used in this study.
 |
| click on image for more detail |
Individual Spring Station Statistics (click on images for more detail)
Coalfield Ridges
 |
|
National Weather Service Office Jackson Climate Station
|
Broad Coalfield Valleys
 |
 |
| London-Corbin Airport Climate Station |
Monticello 3NE COOP Station |
|
|
|
 |
 |
|
Mount Vernon COOP Station
|
Somerset 2 N COOP Station |
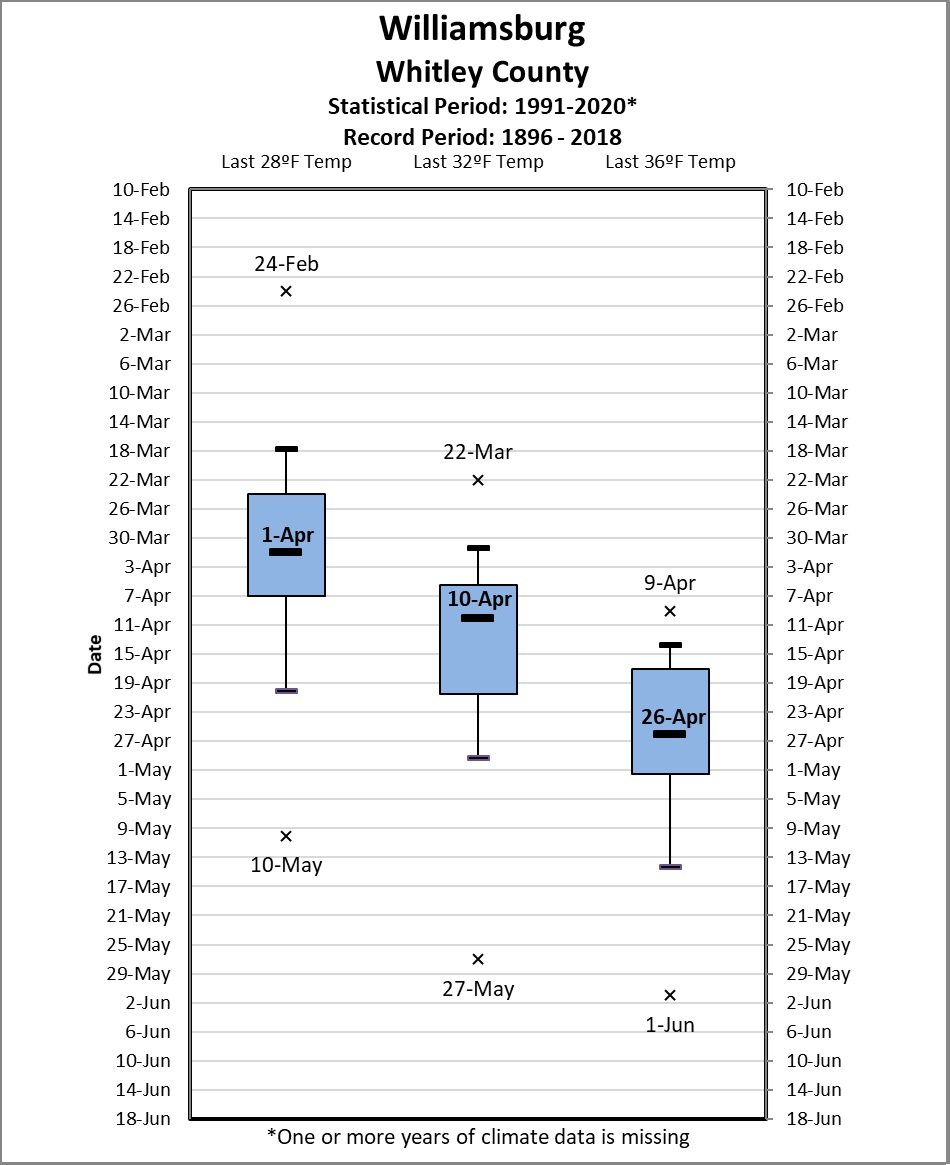 |
| Williamsburg and Williamsburg 1 NW COOP stations |
Eastern Bluegrass
 |
 |
| Farmers 2 S COOP Station |
Mount Sterling COOP Station |
Sheltered Coalfield Valleys
 |
 |
| Barbourville COOP Station |
Baxter COOP Station |
|
|
|
 |
 |
|
Buckhorn Lake COOP Station
|
Paintsville 1 E COOP Station |
 |
|
West Liberty 3 NW COOP Station
|
Fall Frost Climatology
The median date of first 36ºF or colder temperature can be used as a proxy for the first fall frost of the year. During the 30-year period from 1991 to 2020, the median date of first frost ranged from October 9th to October 21st at most stations. Sheltered Coalfield Valley stations prone to deep fog formation at night (such as Baxter, Buckhorn and Paintsville stations) typically experience their first frost after the middle of the month. This illustrates how the warm rivers modify the temperatures at nearby locations in the fall. Meanwhile, in the sheltered valleys not significantly influenced by water, the median date of first frost occurs as early as September 29th. First frosts have been observed as early as late August at Cave Run Lake where the records date back into the late 1800s. The earliest first frosts have more consistently occurred in mid to late September at the majority of stations. The latest first frost has occurred as late as early to mid-November.
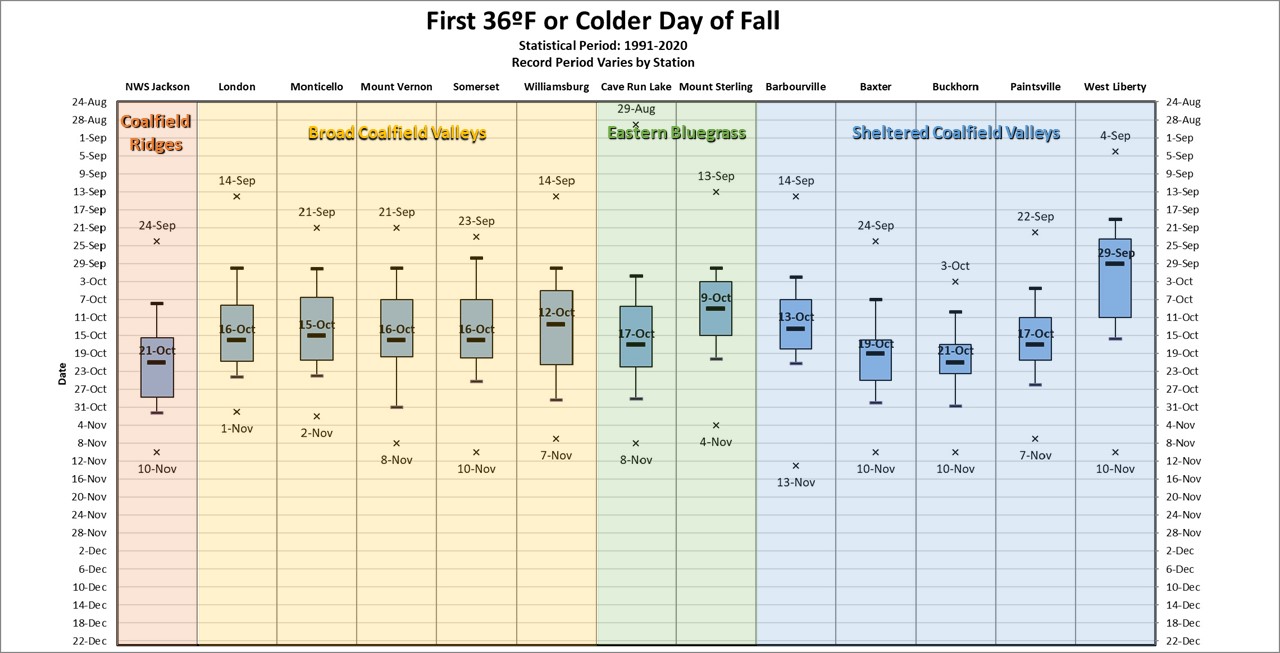 |
| click on image for more detail |
Fall Freeze Climatology
During the 30-year period from 1991 to 2020, the typical first fall freeze is between October 20th and November 1st. In the Sheltered Coalfield Valleys such as West Liberty where valley fog is thinner and less common than in some sheltered valleys further south, the median date of first freeze can occur as early as October 6th. First freezes have been recorded as early as September 4th in coolest Sheltered Coalfield Valleys, and as late as mid-November in the Broad Coalfield Valleys, and as late as November 25th on the Coalfield Ridges.
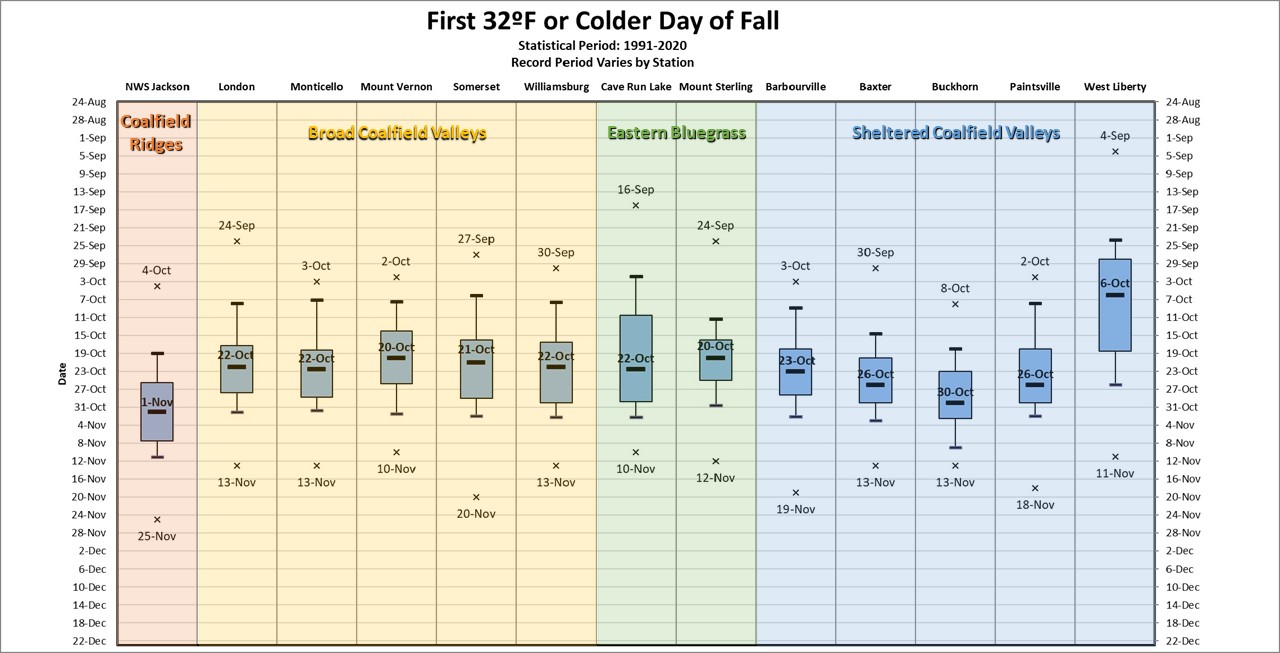 |
| click on image for more detail |
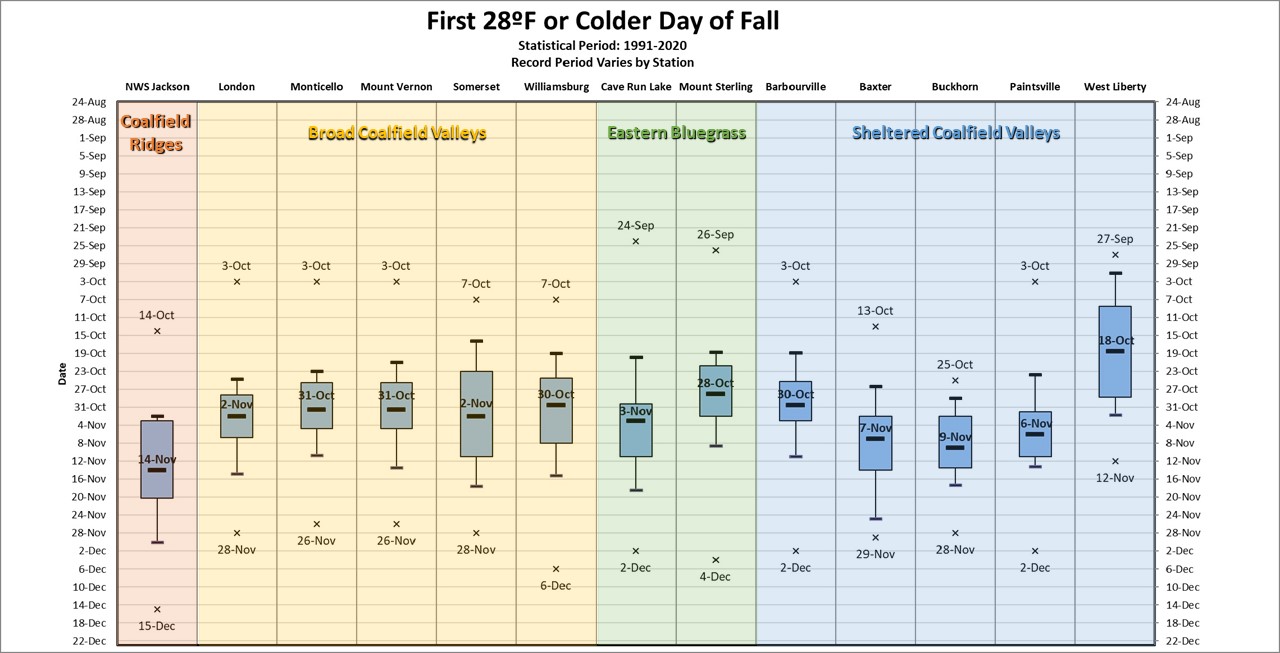
During the 30-year period from 1991 to 2010, the typical killing freeze of fall, defined here as the first 28ºF or colder temperature, occurs between October 28th and November 3rd in the Broad Coalfield Valleys and Eastern Bluegrass. In Sheltered Coalfield Valleys which are often fog prone, the median fall killing freeze occurs between October 30th and November 9th. In those Sheltered Coalfield Valleys less influenced by bodies of water, the median killing freeze occurs as early as October 18th. However, on the Coalfield Ridge site at NWS Jackson, the median date of the killing freeze is the 14th of November. Killing freezes have occurred as early as late September in the northern Sheltered Coalfield Valleys and Eastern Bluegrass, but have mostly been recorded in early October for a majority of the stations. The latest killing freeze has occurred as late as late November and early December in majority of stations; though again earlier dates have been recorded in the northern Sheltered Coalfield Valleys and later dates have been recorded on the Coalfield Ridges.
 |
| click on image for more detail |
Individual Fall Station Statistics (click on images for more detail)
Coalfield Ridges
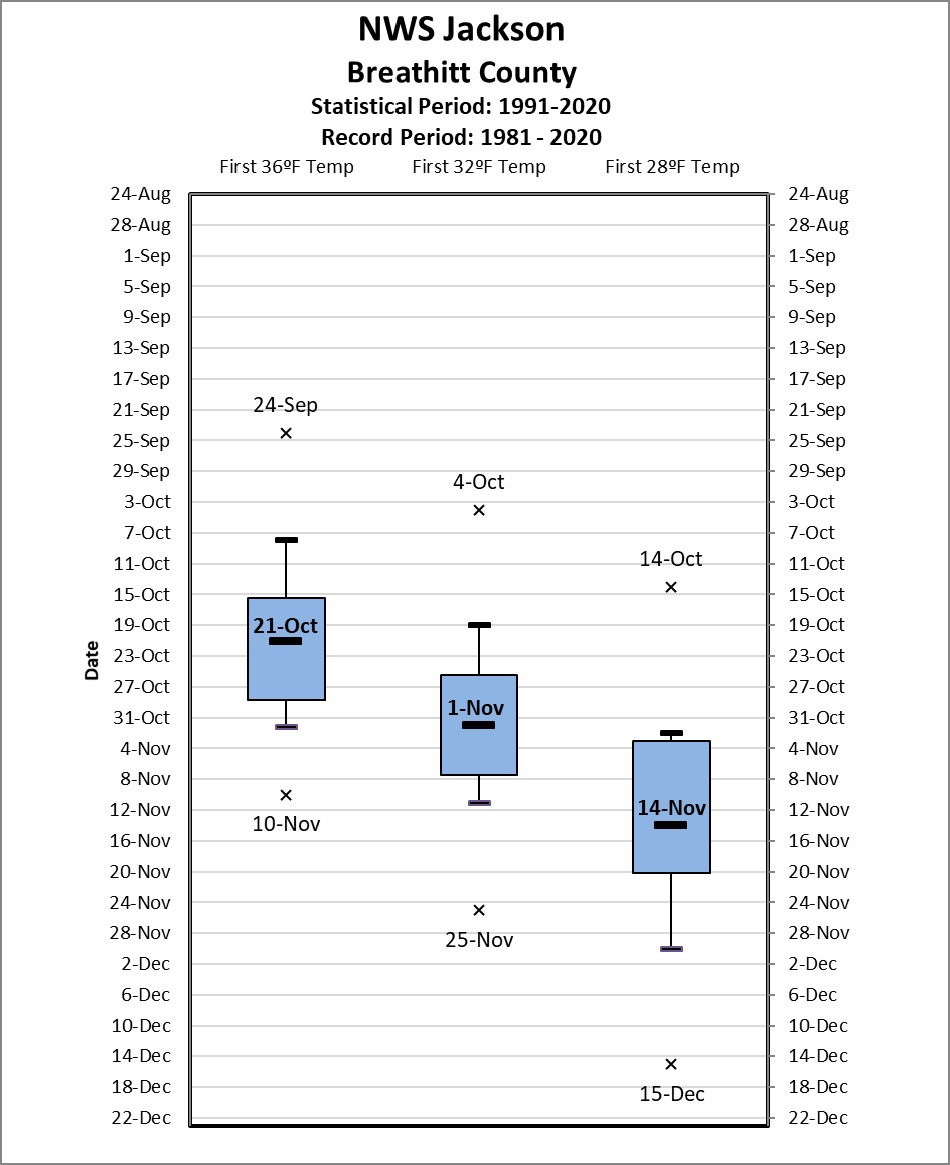 |
|
National Weather Service Office Jackson Climate Station
|
Broad Coalfield Valleys
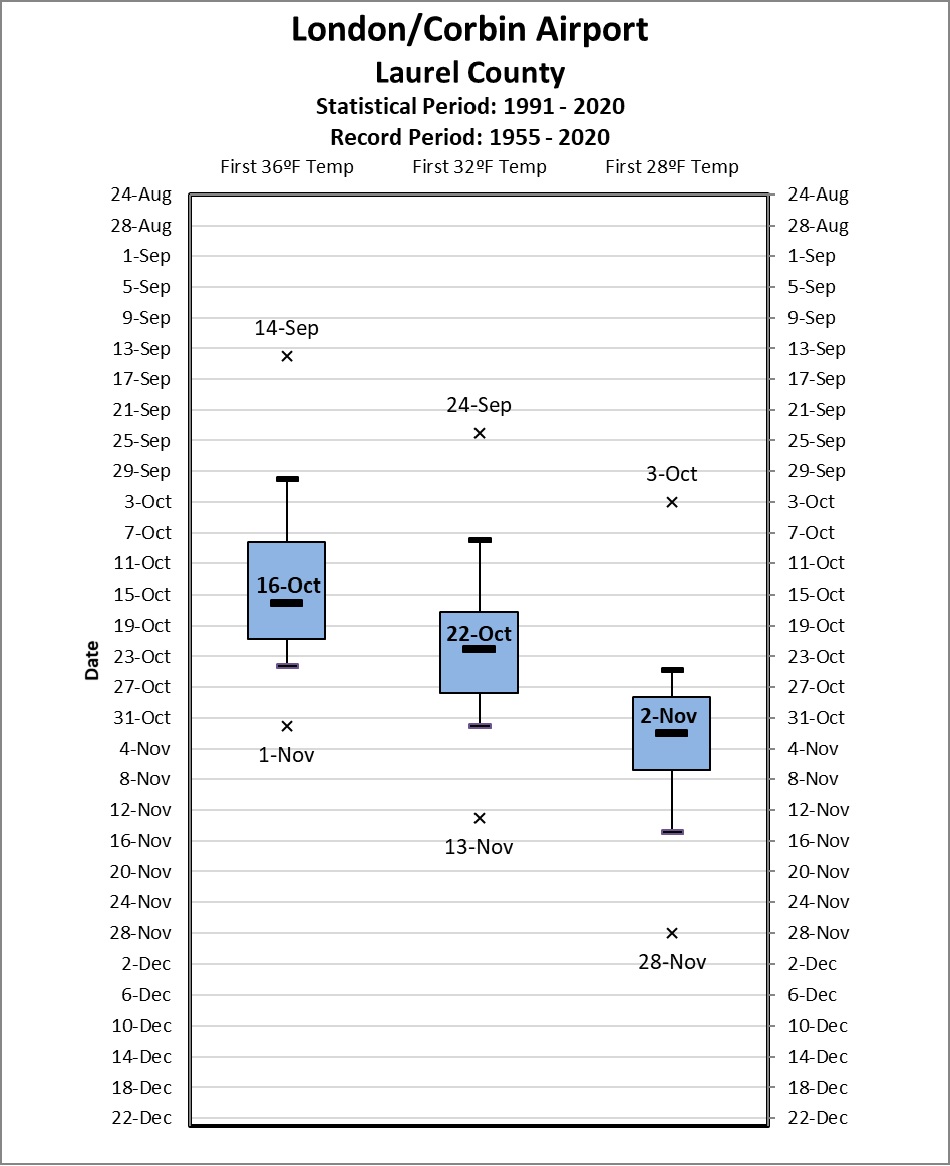 |
 |
| London-Corbin Airport Climate Station |
Monticello 3NE COOP Station |
|
|
|
 |
 |
|
Mount Vernon COOP Station
|
Somerset 2 N COOP Station |
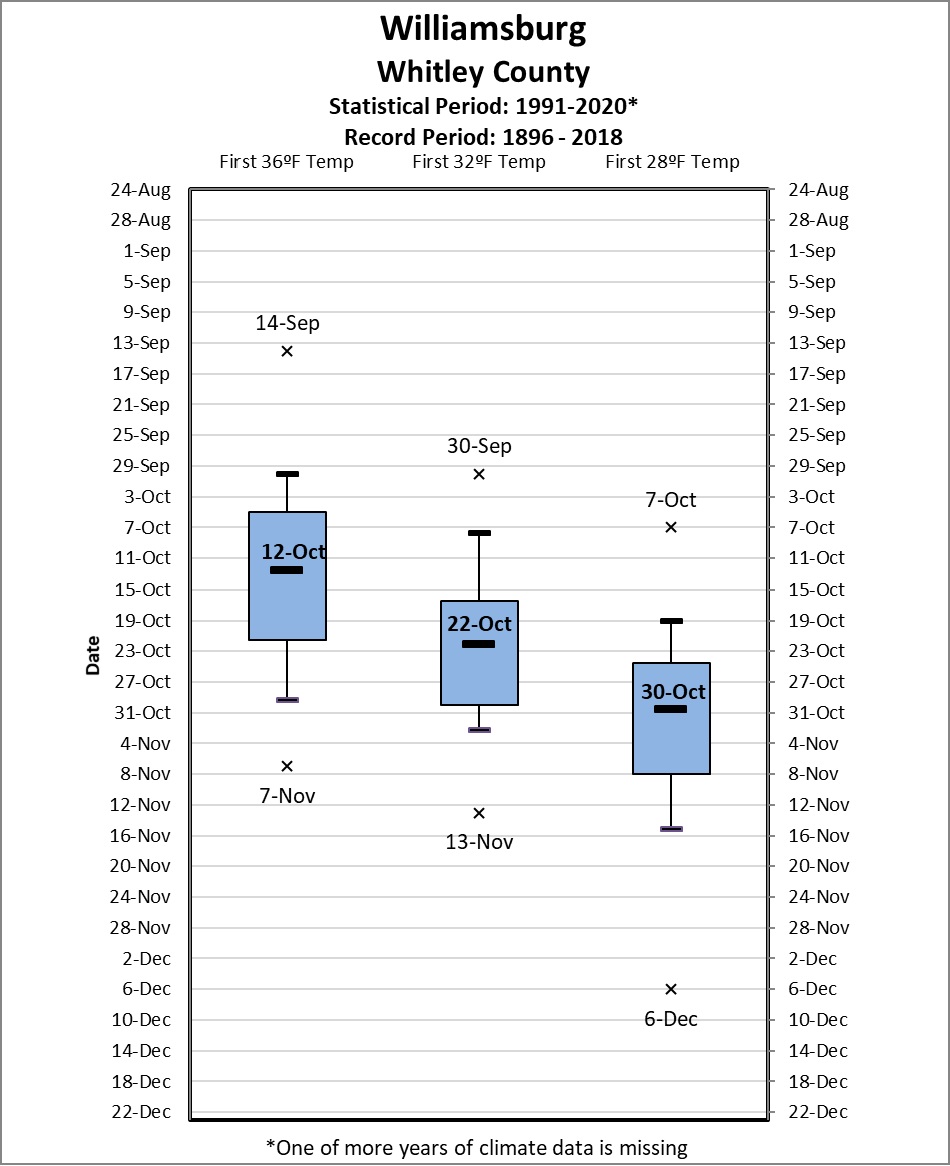 |
| Williamsburg and Williamsburg 1 NW COOP stations |
Eastern Bluegrass
 |
 |
| Farmers 2 S COOP Station |
Mount Sterling COOP Station |
Sheltered Coalfield Valleys
 |
 |
| Barbourville COOP Station |
Baxter COOP Station |
|
|
|
 |
 |
|
Buckhorn Lake COOP Station
|
Paintsville 1 E COOP Station |
 |
|
West Liberty 3 NW COOP Station
|


