
Gusty to high winds and low relative humidity will bring elevated to critical fire weather to the central and southern Plains into Wednesday. Two Pacific storms will impact the western U.S. into Wednesday with gusty winds, low elevation rain, and heavy mountain snow. Read More >
|
Torrential rains fell from April 2-5, 1977 causing devastating flooding across southeast Kentucky and adjacent areas of southern West Virginia, southwest Virginia and parts of Tennessee. Record floods occurred on the Tug and Levisa Forks of the Big Sandy River, the upper Cumberland River, the Guyandotte River, and the Clinch and Powell Rivers, with severe flooding occurring on the North Fork of the Kentucky River and on the Holston River. Fifteen Kentucky counties were declared disaster areas, including Bell, Breathitt, Floyd, Harlan, Johnson, Knott, Knox, Lawrence, Leslie, Letcher, Magoffin, Martin, Perry, Pike and Whitley. The floods killed 10 people in east Kentucky and 22 people in the four state area affected, with damages estimated at $175 million at the time, or roughly $711 million in 2016 dollars. This article will discuss the meteorology behind the disaster and highlight the impacts from the flooding on the Big Sandy and Cumberland Rivers, which were the hardest hit areas in Kentucky. |
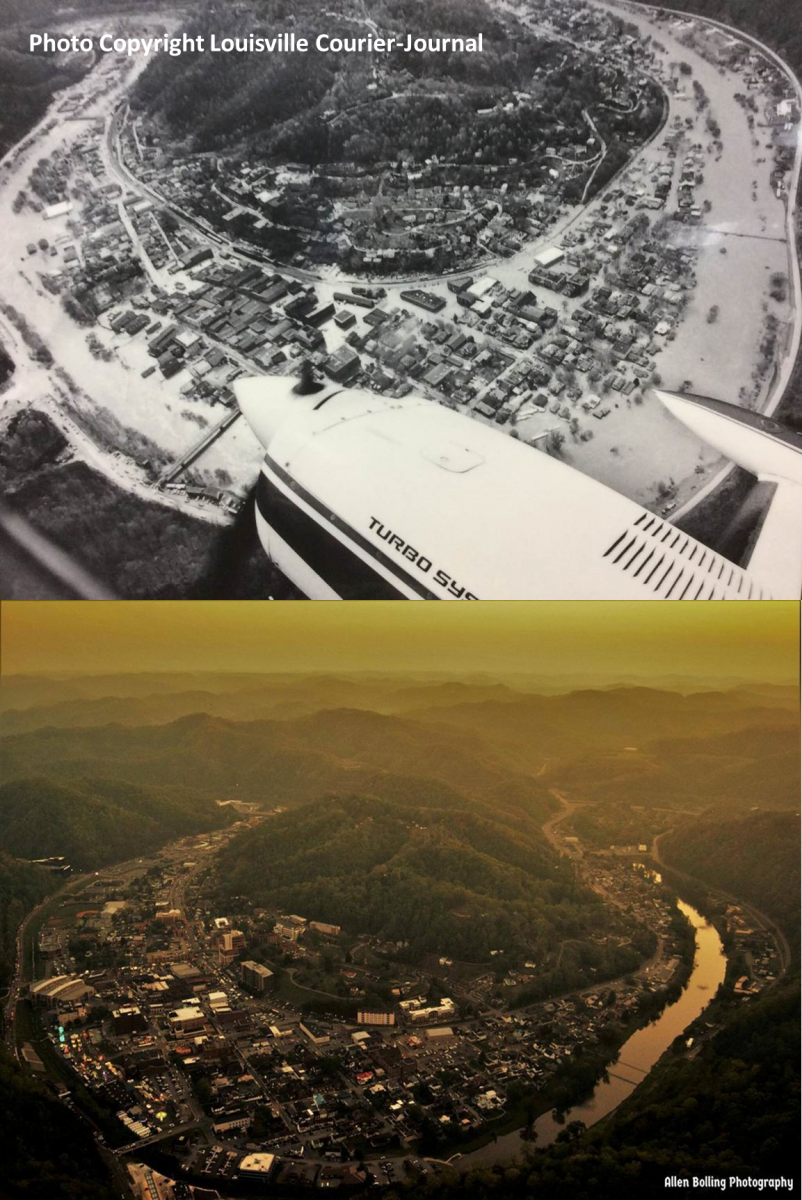 Pikeville, KY during the 1977 Flood (top) and Today (bottom) |
Meteorological Setup & Rainfall
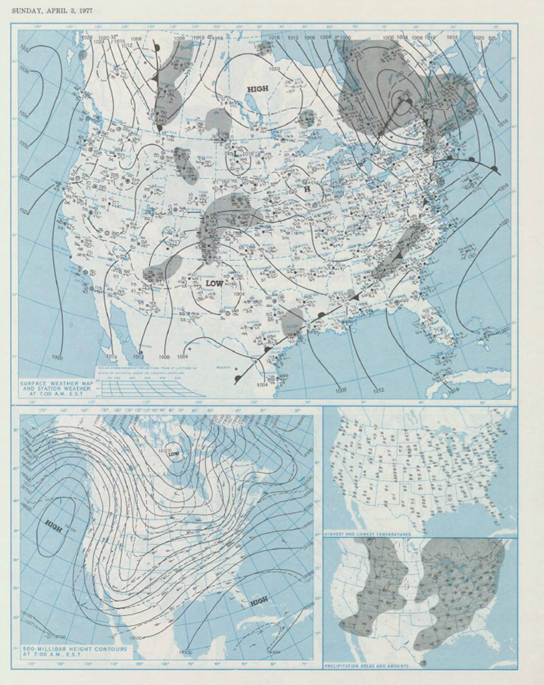
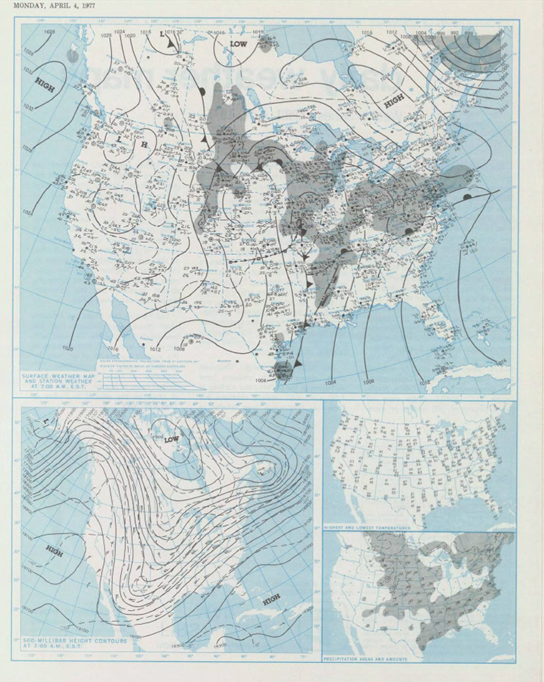
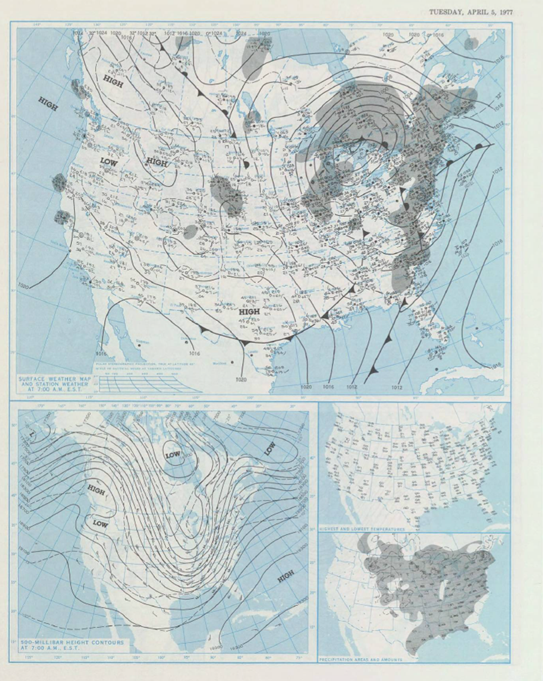
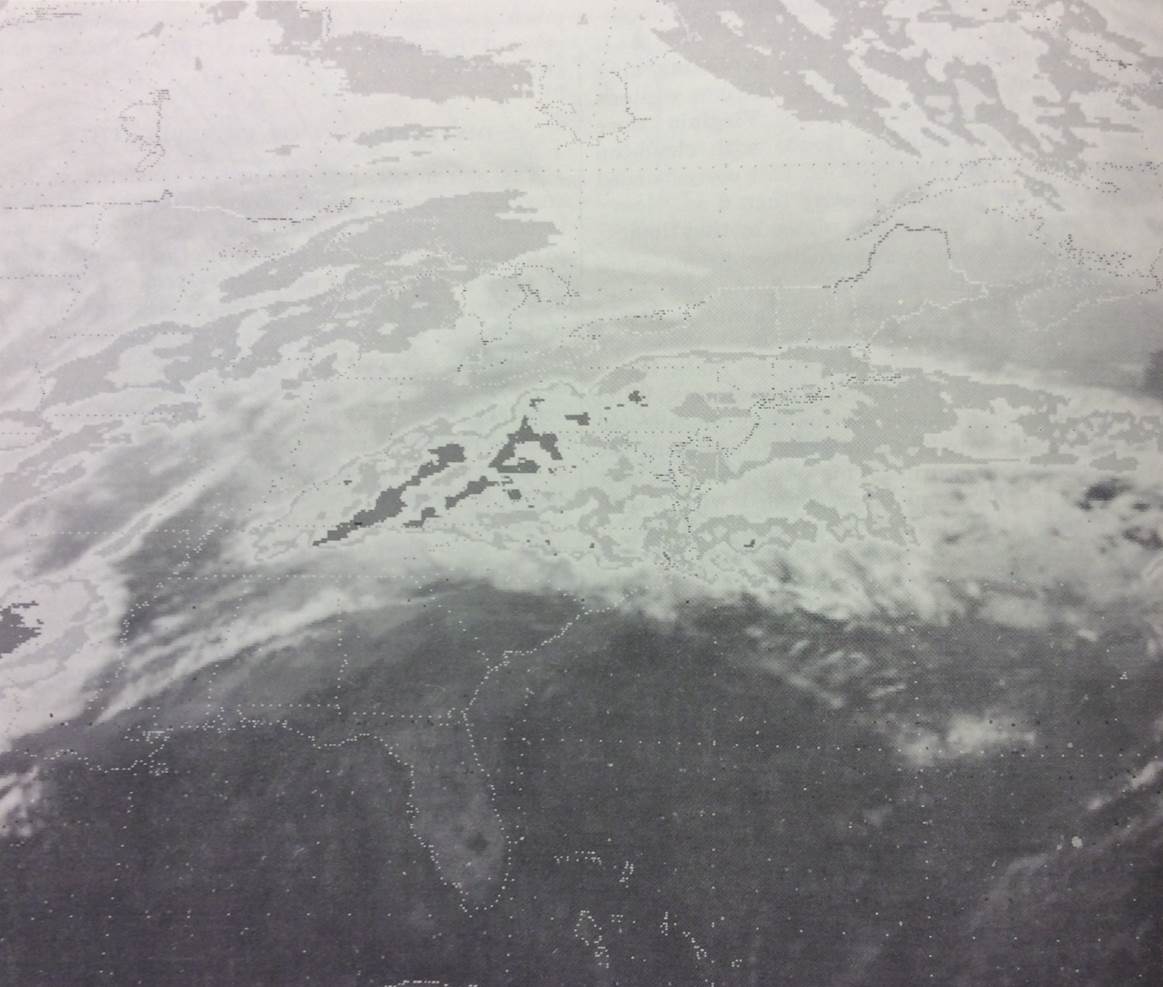
The meteorological setup for the flood event featured a low pressure system progressing northeastward across the Great Lakes into southern Quebec by the morning of Sunday April 3, 1977. A cold front associated with this low pressure system moved through the central Appalachians producing mainly light rainfall amounts, which acted to saturate the ground for the next and much heavier round of rain which was to arrive during the evening of April 3rd and last into the morning hours of April 5th. This second round of rain fell heavily and almost continuously.
 |
 |
 |
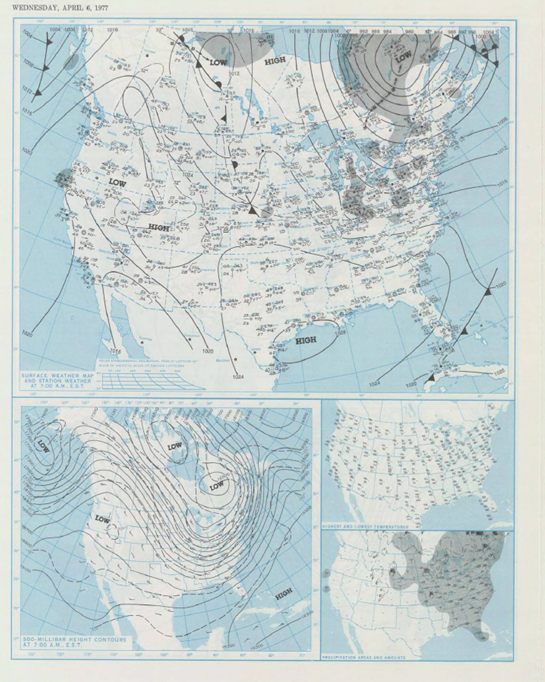 |
| 7 am ET April 3rd | 7 am ET April 4th | 7 am ET April 5th | 7 am ET April 6th |
 |
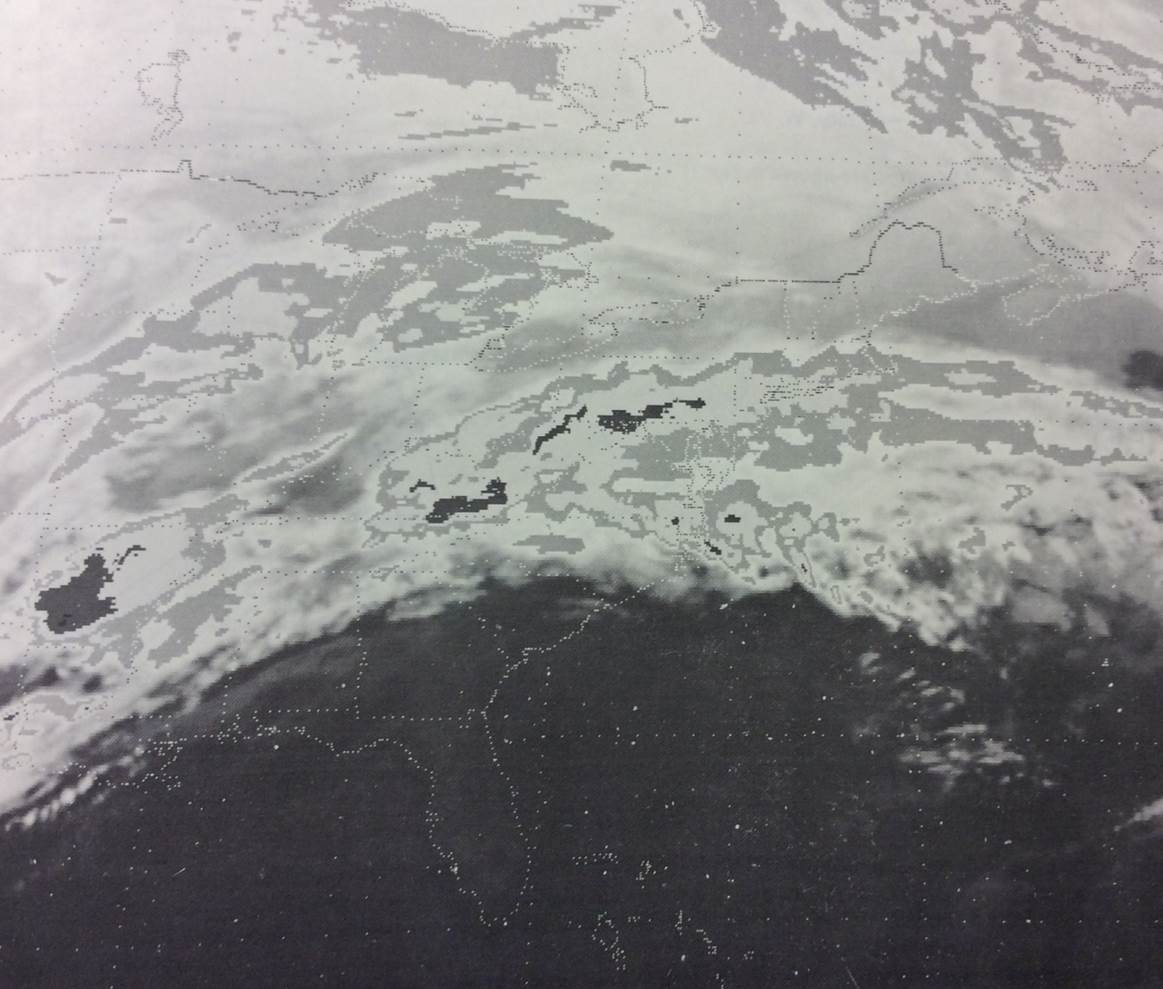 |
| GOES Satellite Infrared Image from 0300 EST April 4, 1977 | GOES Satellite Infrared Image from 0300 EST April 4, 1977 |
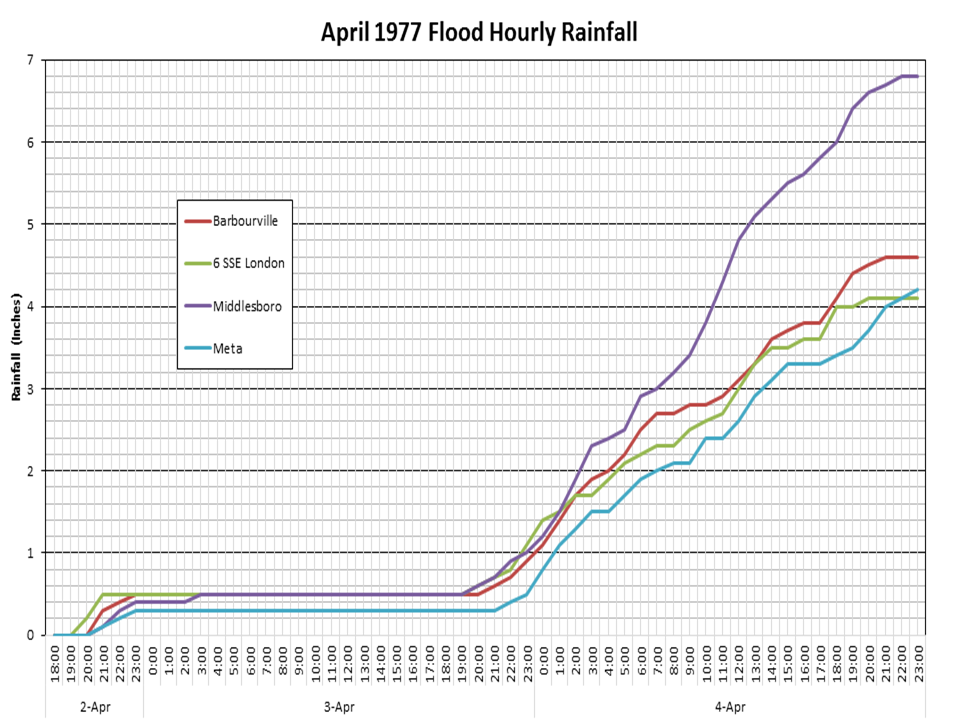
Rainfall rates under the axis of heaviest rain were on the order of 1/4 to 1/2 inch per hour for several hours. In fact, Middlesboro received over 6 inches of rain in 24 hours between 6 pm April 3rd and 6 pm April 4th. This axis of heaviest rain, in some cases exceeding 8 inches, extended northeastward over the headwaters of the Cumberland and Big Sandy Rivers.
 |
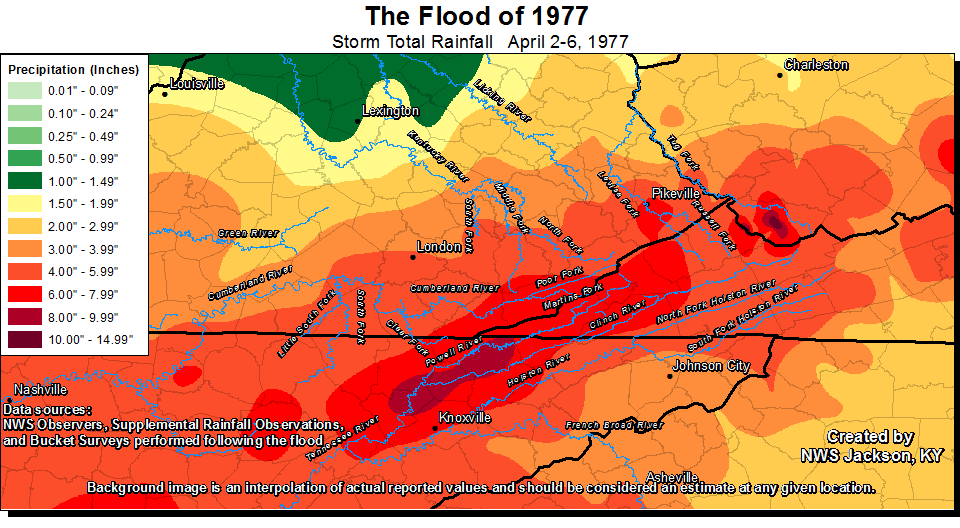 |
| Rainfall measurements used to create the above map were obtained from a blend of official records and unoffical records, including measurements taken from bucket surveys which were included in the "Flood of April 1977 in the Appalachian Region of Kentucky, Tennessee, Virginia and West Virginia" Geological Survey Professional Publication. |
Big Sandy River Impacts
 |
 |
 |
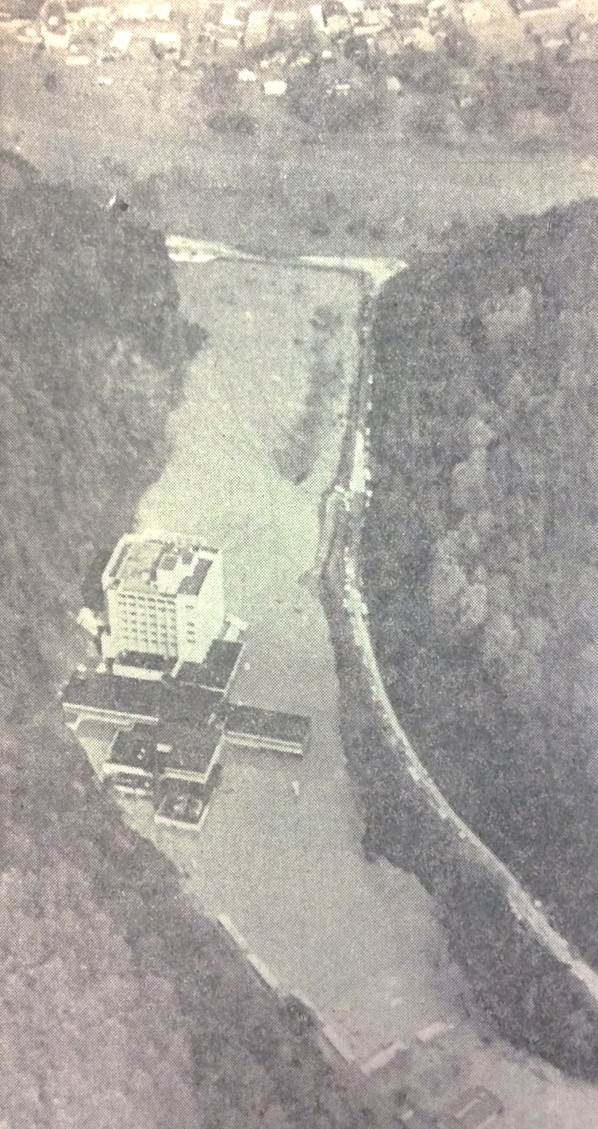
| Pikeville, KY during the 1977 Flood (photo courtesy of Pike County Museum) |
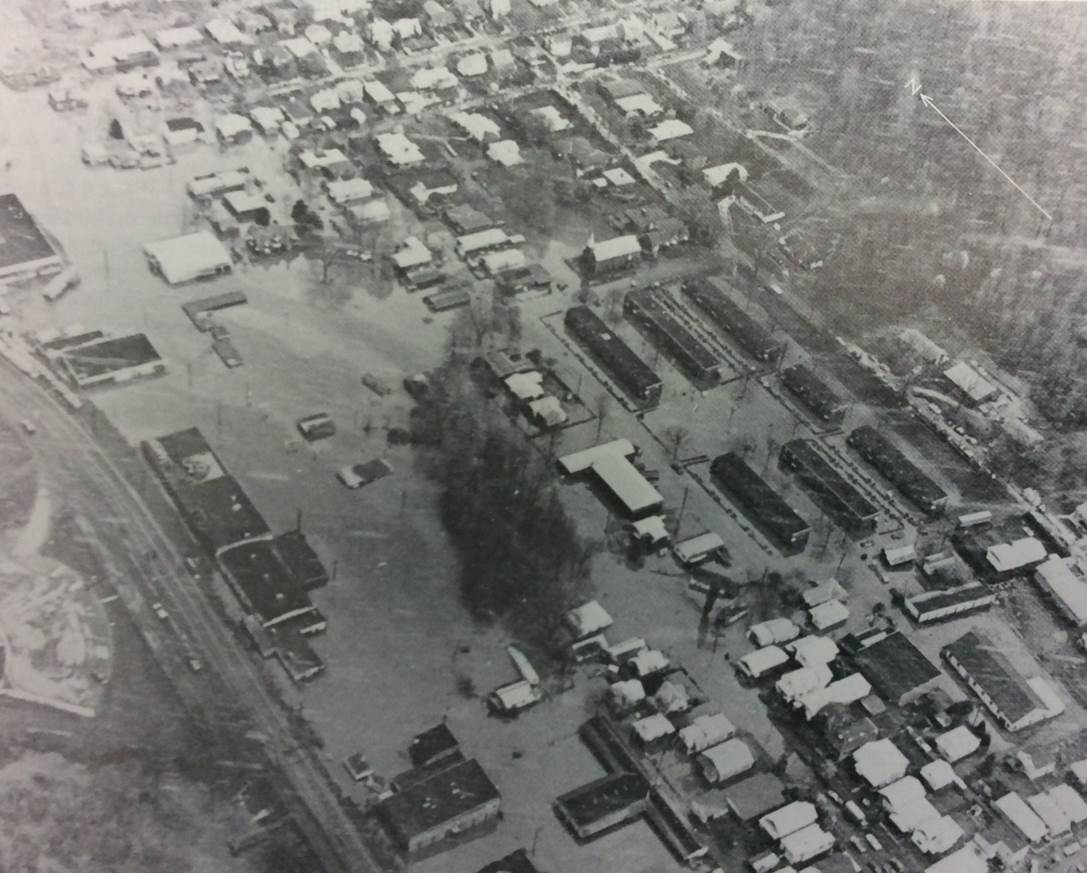
Pikeville, KY during the 1977 Flood (photo copyright United Press International) |
Williamson, WV during the 1977 Flood (photo courtesy of Charleston Daily Mail) |
The torrential rains resulted in record damages on the Tug Fork of the Big Sandy River with major damage occurring on the Levisa Forks and Russell Forks of the Big Sandy. In Kentucky, the city of Pikeville alone was estimated to have received over $71 million dollars worth of damages and lost revenue from the floods. Downstream, Floyd County was also hard hit. For example, flood waters reached a depth of 9 feet on Main Street in Martin, KY and countywide there was one death, 117 businesses destroyed or severely damaged and almost 1,000 families suffered loss.
As of the time of the creation of this article in 2016, the April 1977 flood is the greatest flood on record upstream from Pikeville with crests close to the 1957 flood at Pikeville and further downstream.
| Russell Fork at Haysi, VA | Russell Fork at Elkhorn City, KY | Levisa Fork at Big Rock, VA | Levisa Fork at Pikeville, KY | |
|---|---|---|---|---|
| 1 | 28.2 ft - 4/4/1977 | 24.8 ft - 4/4/1977 | 27.4 ft - 4/4/1977 | 52.7 ft - 1/30/1957 |
| 2 | 23.2 ft - 1/29/1957 | 24.2 ft - 1/29/1957 | 23.0 ft - 1/29/1957 | 52.0 ft - 2/1/1862 |
| 3 | 22.8 ft - 3/7/1984 | 21.7 ft - 3/12/1963 | 20.7 ft - 5/7/1984 | 51.5 ft - 4/5/1977 |
| Tug Fork at Litwar, WV | Tug Fork at Williamson, WV | Tug Fork at Kermit, WV | |
|---|---|---|---|
| 1 | 27.4 ft - 4/4/1977 | 52.6 ft - 4/5/1977 | 54.5 ft - 4/6/1977 |
| 2 | 24.5 ft - 5/3/2002 | 44.9 ft - 5/8/1984 | 49.0 ft - 5/8/1984 |
| 3 | 21.6 ft - 1/29/1957 | 44.5 ft - 3/12/1963 | 46.5 ft - 3/13/1963 |
Crests would likely have been much higher compared to the 1957 flood but substantial reductions in peak stages likely occurred as a result of reservoir storage in Fishtrap Lake, North Fork Pound Lake and John W. Flanigan Reservoir. In fact, the U.S. Army Corp of Engineers estimated that peak stages on the Russell Fork at Elkhorn City were reduced by 1.2 feet, with a 13 ft. reduction estimated on the Levisa Fork at Pikeville as a result of flood control operations on upstream reservoirs.
Cumberland River Impacts
 |
 |
 |
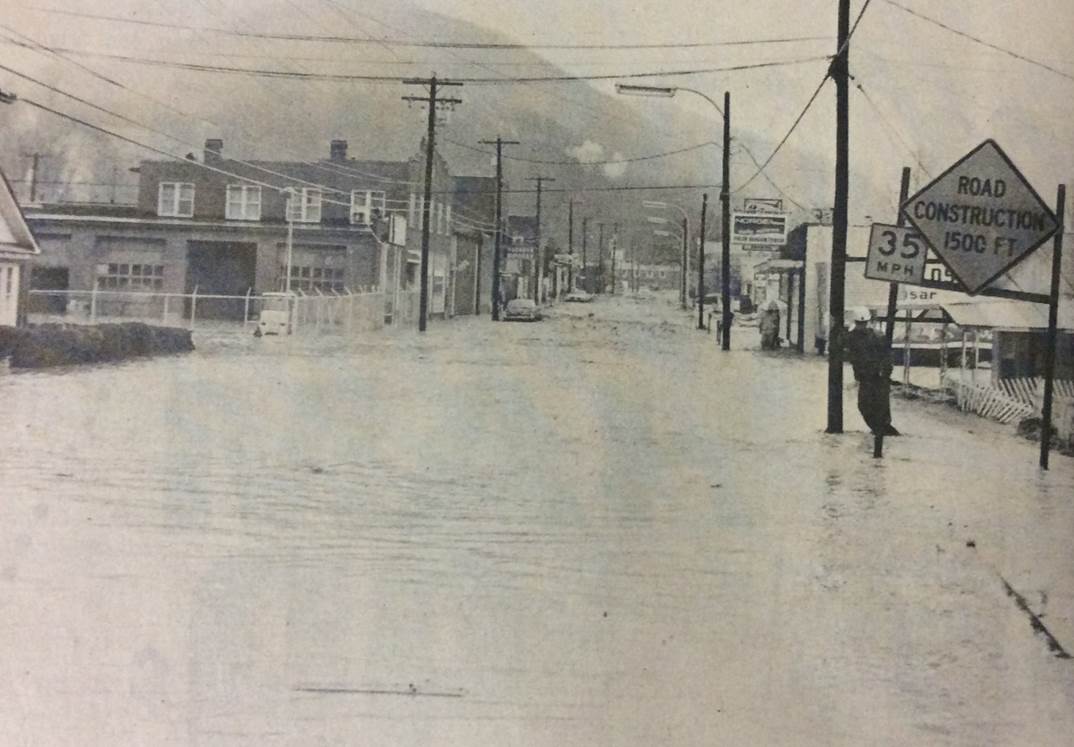
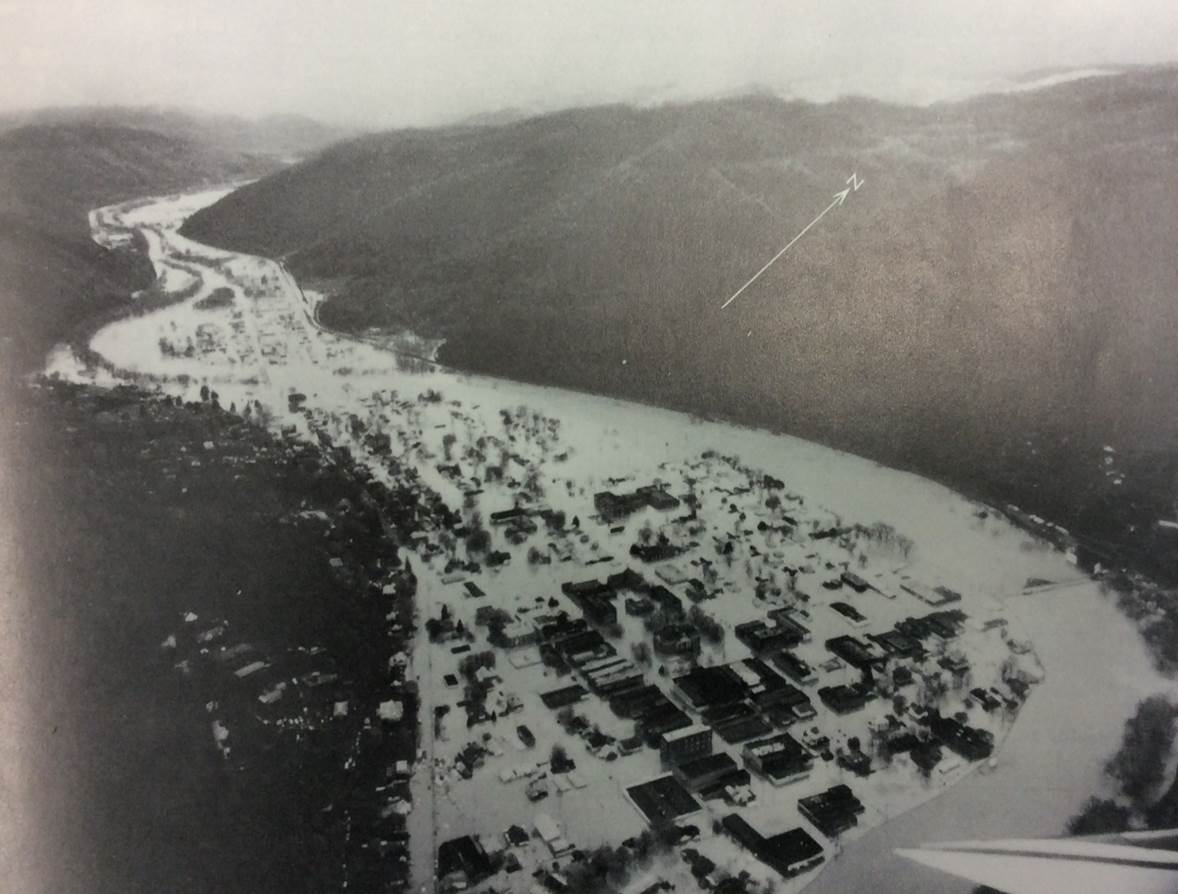
| Cumberland, KY during the 1977 Flood (photo courtesy of Tri-City News) |
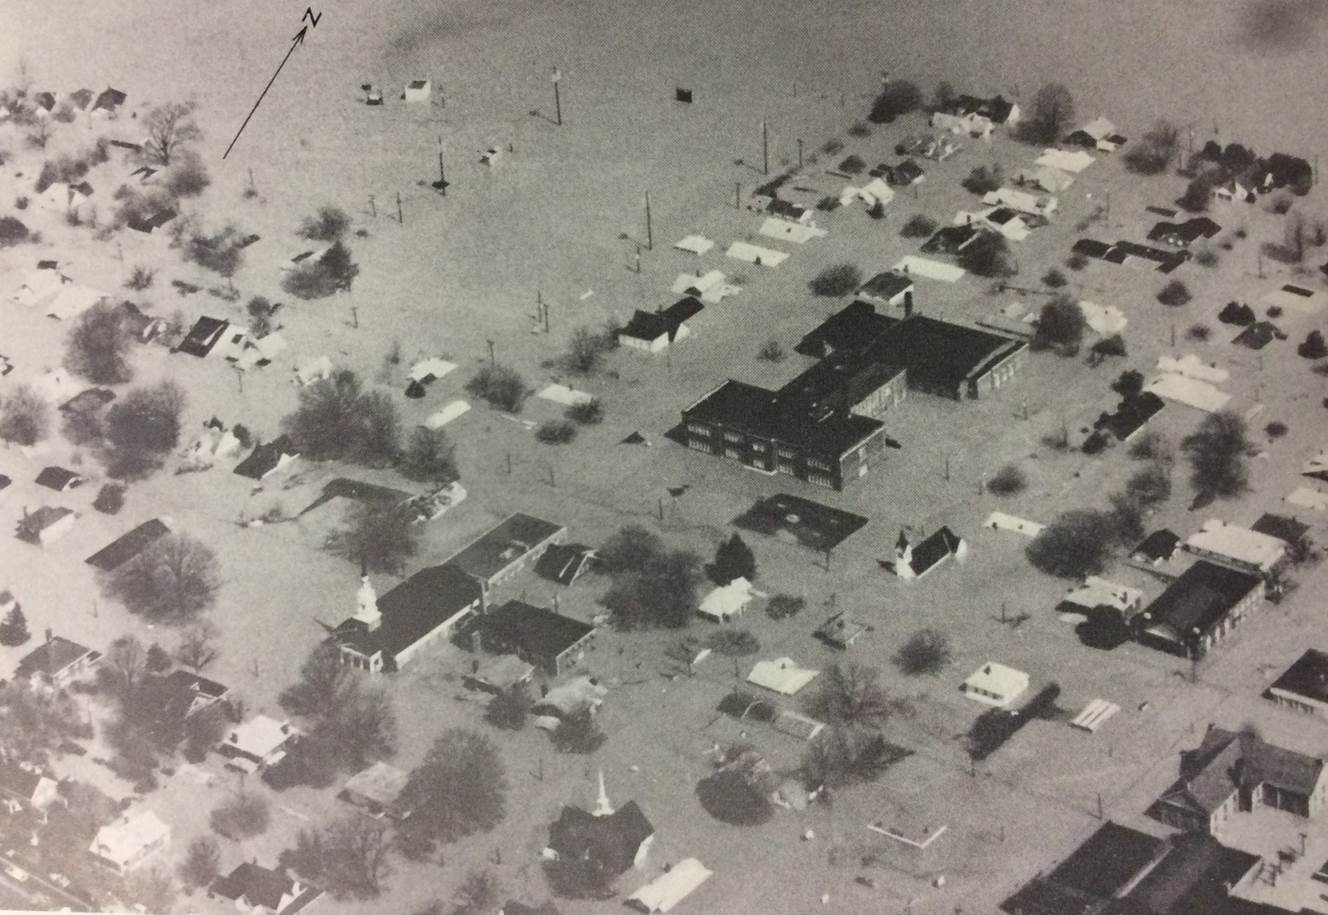
Pineville, KY during the 1977 Flood (photo copyright Louisville Courier-Journal) |
Pineville, KY during the 1977 Flood (photo copyright Louisville Courier-Journal) |
As of the time of the creation of this article in 2016, the flood of April 1977 remains the flood of record at several points along the Cumberland River.
| Cumberland | Baxter/Harlan | Pineville | Barbourville | Williamsburg | |
|---|---|---|---|---|---|
| 1 | 16.5 ft - 1/29/1957 | 34.2 ft - 4/4/1977 | 1021.8 ft - 4/5/1977 | 45.9 ft - 4/6/1977 | 35.0 ft - 4/7/1977 |
| 2 | 15.9 ft - 4/4/1977 | 29.2 ft - 3/12/1963 | 1017.3 ft - 3/18/2002 | 42.8 ft - 1/1/1946 | 35.0 ft - 3/31/1886 |
| 3 | 15.5 ft - 3/23/1929 | 28.5 ft - 12/31/1969 | 1016.6 ft - 3/5/2015 | 42.7 ft - 11/29/1973 | 34.5 ft - 3/15/1975 |
Flooding on the Cumberland began first in Harlan County on April 4th with widespread damage to infrastructure, homes and businesses. The Tri-Cities of Cumberland, Benham and Lynch were hard hit, although flooding here was not as extensive or severe as in the 1957 flood. East Cumberland was hardest hit with several homes and businesses flooded. The city of Harlan experienced major damage from the floods as well. The sewer treatment plant was flooded and businesses along Main Street, River Street and Cumberland Avenue were severely damaged by the flood waters. Five deaths were attributed to flooding in Harlan County, over 600 dwellings were destroyed and over 2,000 families suffered loss.
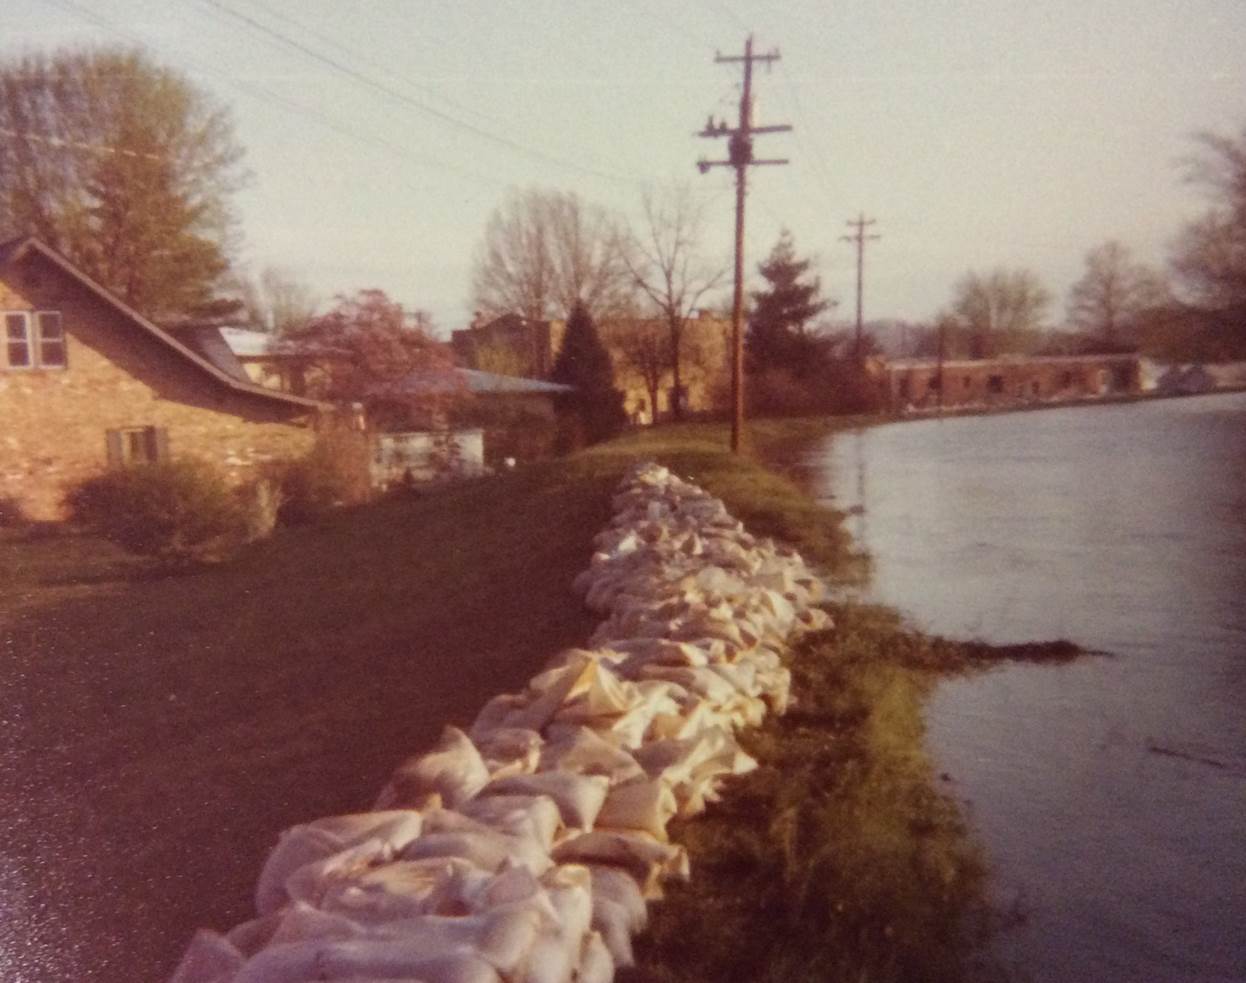
Further downstream, the town of Pineville was inundated with about 15 feet of water after the levees and floodwall were overtopped. Three people died, 674 suffered injuries or illness and an estimated 1512 families suffered loss in Bell County alone due to the flooding. As the flood waters traveled downstream, the city of Barbourville was evacuated as a precaution, but sandbag enforced levees protecting the town held back the water. The pictures below show how close the water came to overtopping those levees.
 |
 |
| Barbourville, KY during the 1977 Flood (photo courtesy of City of Barbourville) |
|
At Williamsburg, the river crested above the 1957 and 1975 peak stages, flooding much of the town. Downstream at Cumberland Falls, the river reached 13.3 ft, or 2.2 ft lower than the record stage set in 1918. Flooding did not approach previous floods of record below Cumberland Falls.
References
Much of the information included in this page was taken from the "Flood of April 1977 in the Appalachian Region of Kentucky, Tennessee, Virginia and West Virginia" Geological Survey Professional Publication.
Damage statistics were taken from the "Southeast Kentucky's April '77 Floods: The Cost of Recovery" publication prepared by the Appalachian Regional Commission, Development Cabinet and the Governor's Economic Development Commission.
Historical river crest information was obtained from the National Weather Service Advanced Hydrologic Prediction Service.
 |
Media use of NWS Web News Stories is encouraged! Please acknowledge the NWS as the source of any news information accessed from this site. |
 |