Low End Amount – 9 in 10 Chance (90%) of Higher Snowfall over 72 hours
This map depicts a reasonable lower-end snowfall amount for the time period shown on the graphic, based on many computer model simulations of possible snowfall totals. This lower amount is an unlikely scenario with a 9 in 10, or 90% chance that more snow will fall, and only a 1 in 10, or 10% chance that less snow will fall. This number can help serve as a lower-end scenario for planning purposes.
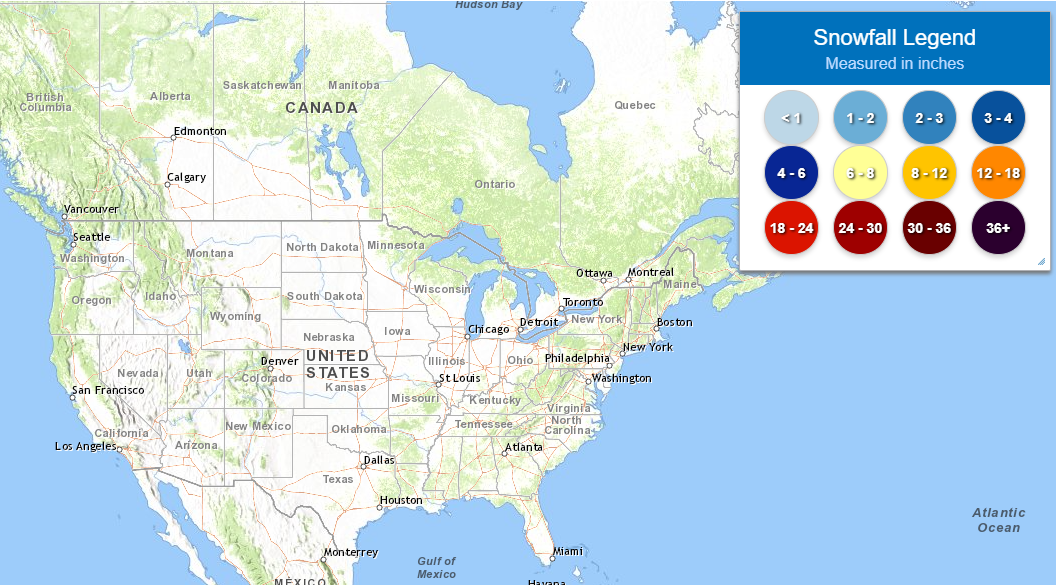
"Point Map" is Expected Snowfall - 72hr Official NWS Forecast
The "Point" map is the official 72 hour NWS snowfall forecast in inches during the time period shown on the graphic. This snowfall amount is determined by NWS forecasters to be the most likely outcome based on evaluation of data from computer models, satellite, radar, and other observations.
"Range Map" is Experimental Probabilistic Snowfall Range Amounts over 72 hours
The "Range" map is the 25th percentile (lower number) to 75th percentile (higher number) of possible snowfall amounts based on the Weather Prediction Center (WPC) Super Ensemble output during the time period of the graphic. The official NWS snowfall forecast influences this range of values either up or down depending upon how closely they match.
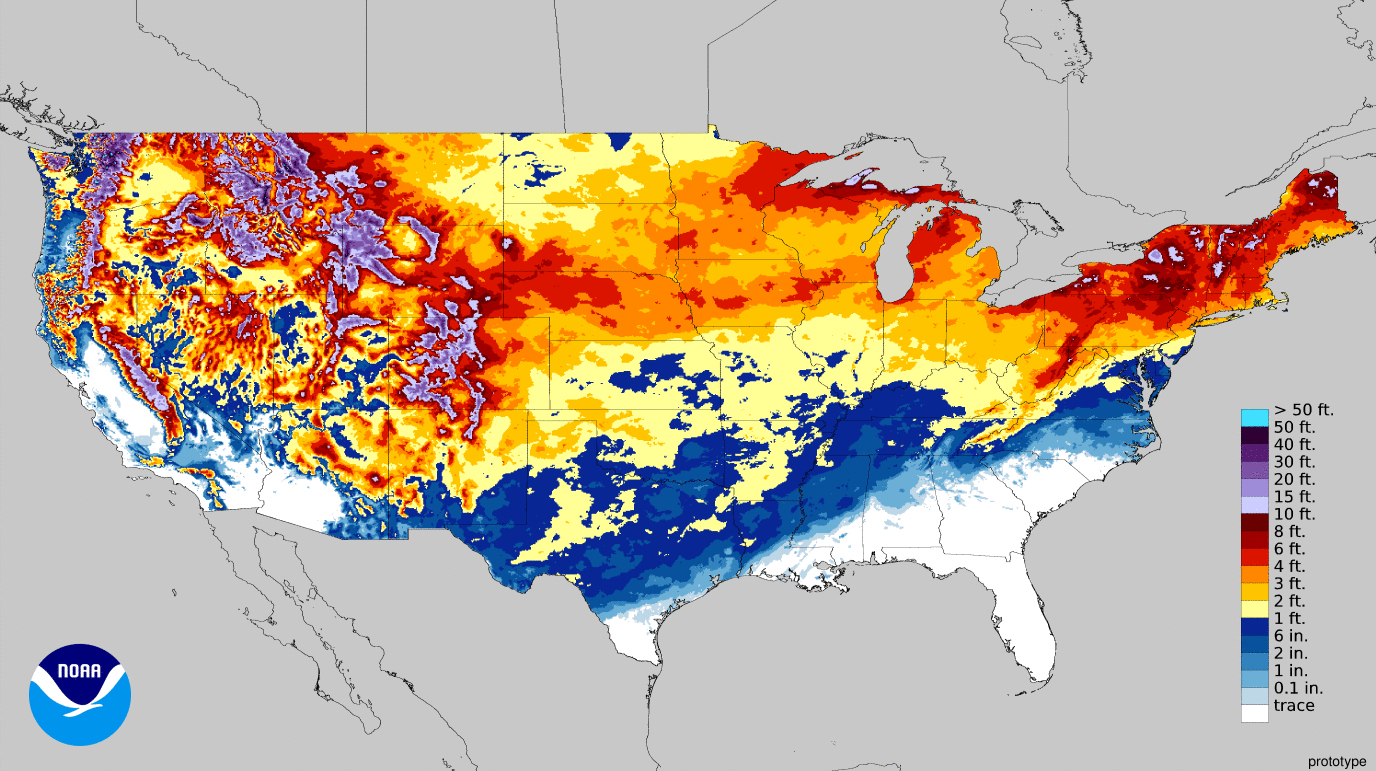
High End Amount – Only a 1 in 10 Chance (10%) of Higher Snowfall over 72 hours
This map depicts a reasonable upper-end snowfall amount for the time period shown on the graphic, based on many computer model simulations of possible snowfall totals. This higher amount is an unlikely scenario, with only a 1 in 10, or 10% chance that more snow will fall, and a 9 in 10, or 90% chance that less snow will fall. This number can help serve as an upper-end scenario for planning purposes.
The purpose of these experimental probabilistic snowfall products is to provide customers and partners a range of snowfall possibilities, in complement to existing NWS deterministic snowfall graphics, to better communicate forecast uncertainties during winter weather events. For more information visit this project's Product/Service Description Document, and please provide us your feedback here.
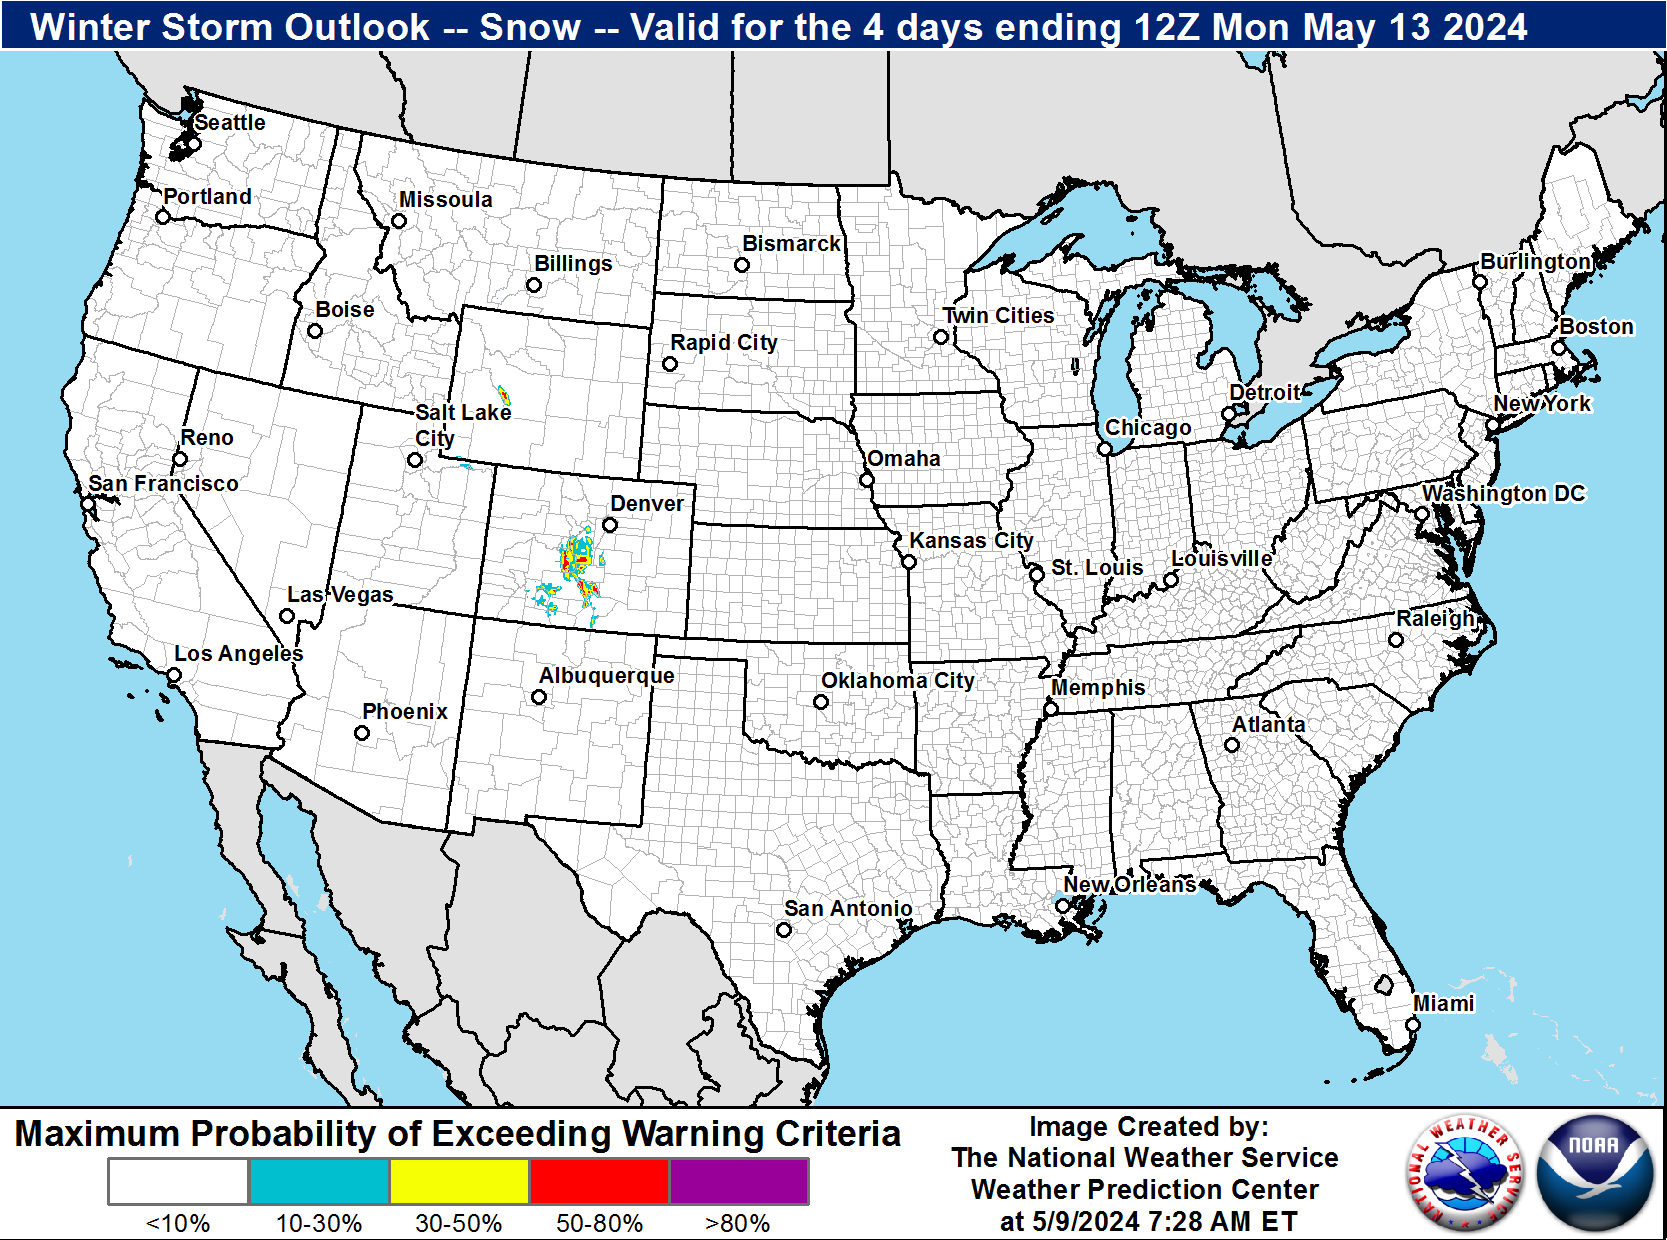
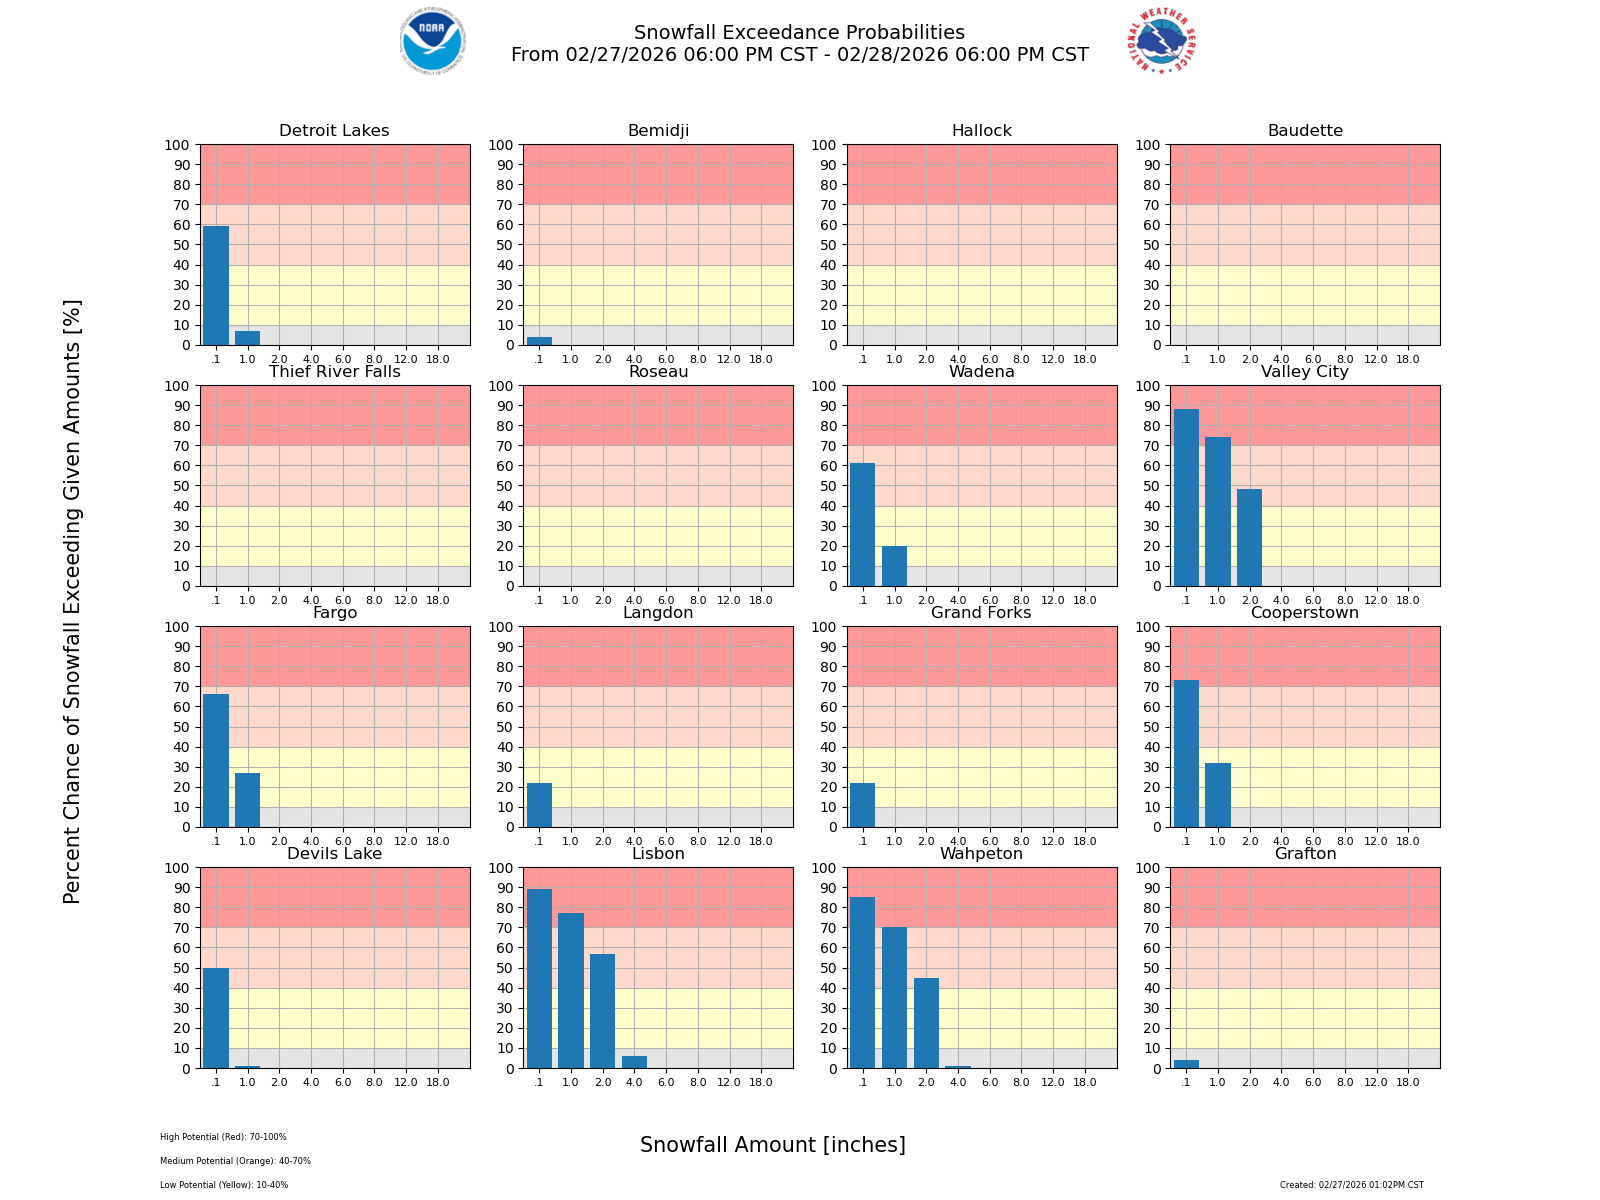
Percent Chance That 72 Hour Snow Amounts Will Be Greater Than
This series of maps shows the probability (that is, the likelihood) that snowfall will equal or exceed specific amounts during the time period shown on the graphic. These forecasts are based on many computer model simulations of possible snowfall totals.
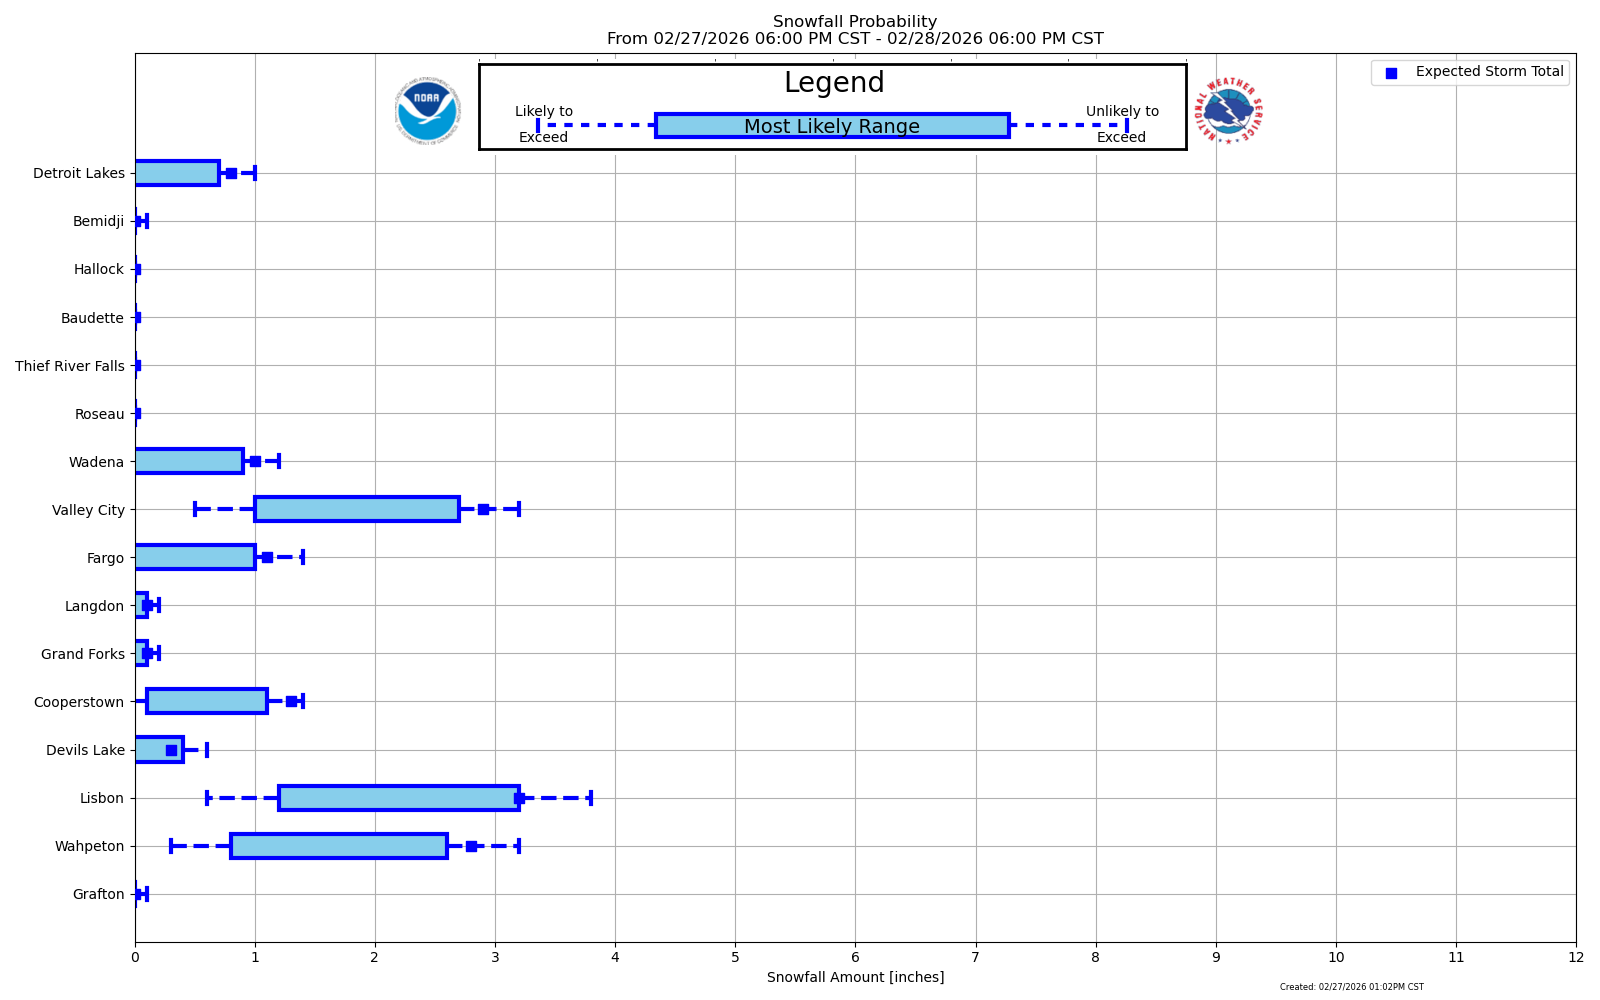
These tables show the snowfall forecast for individual locations, and provide the same information as the graphics on this web page, just shown in a different way. All of these values are valid for the same time period as depicted on the graphics.
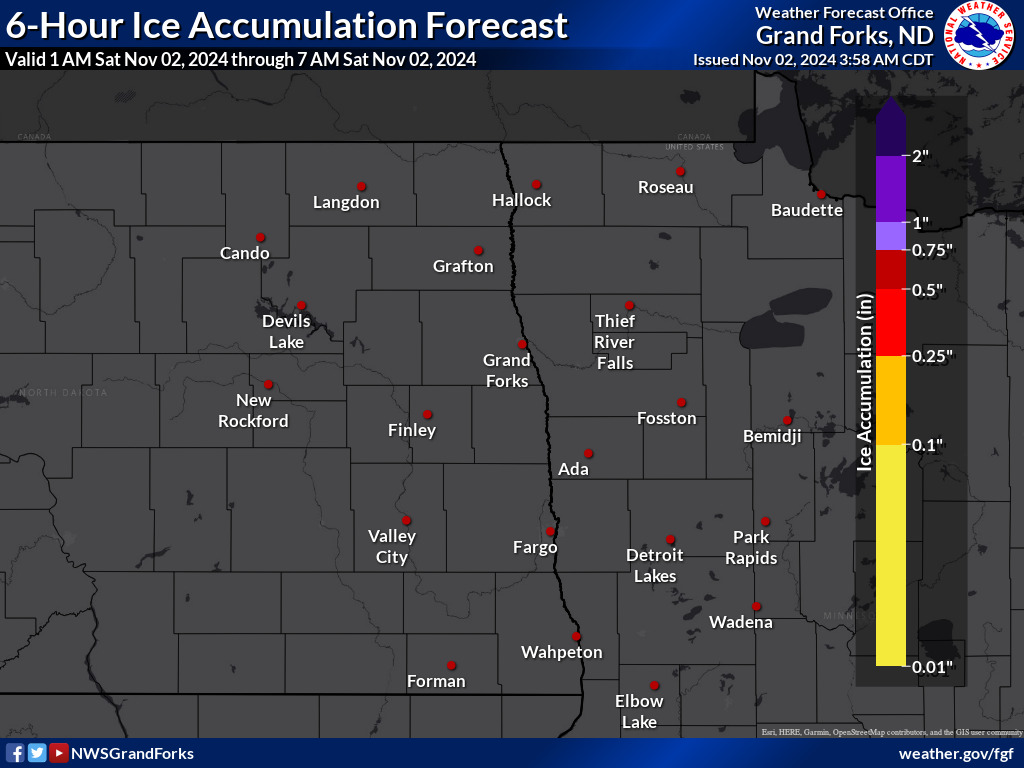
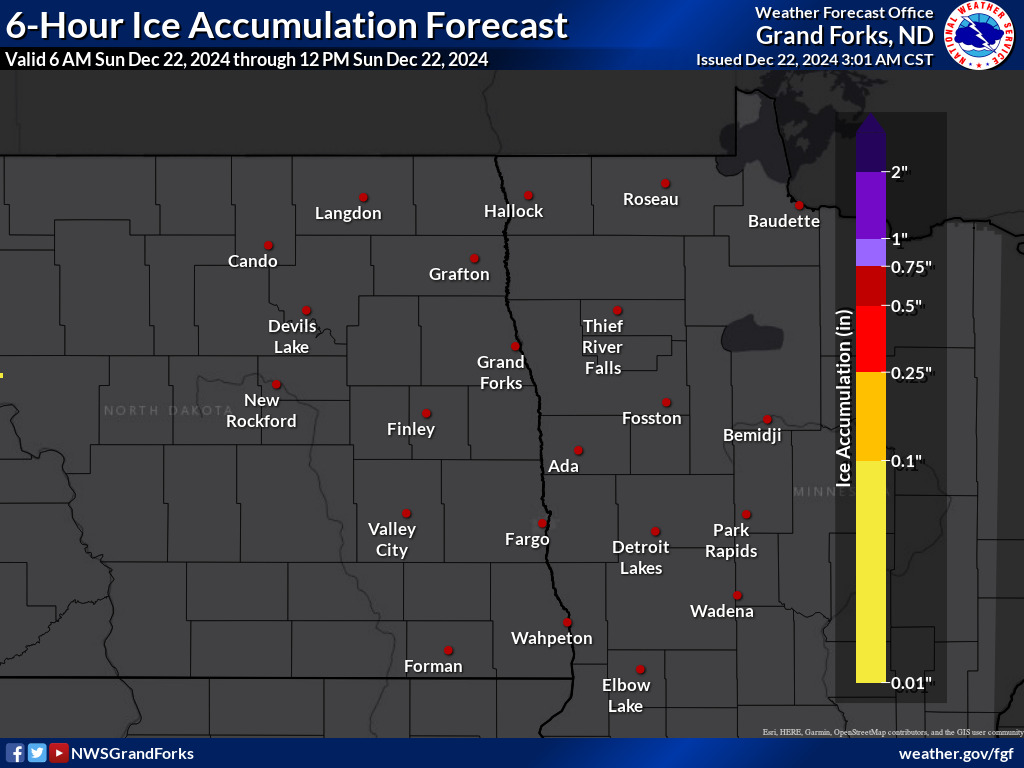
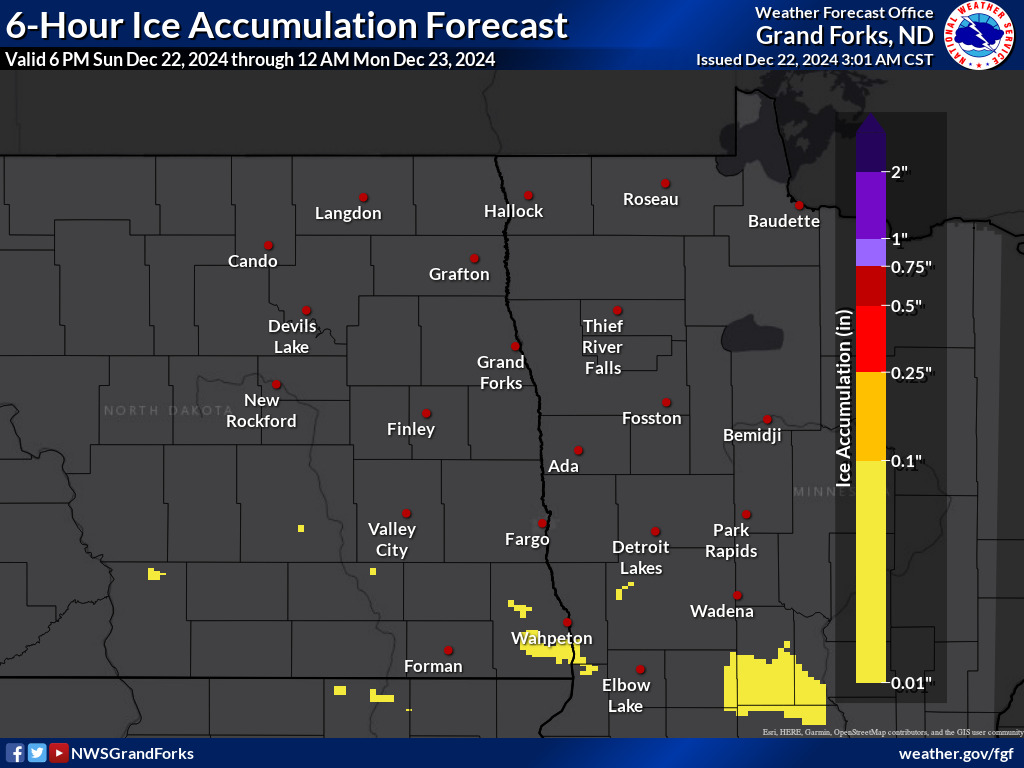
This is the elevated flat surface ice accumulation. It is not radial/line ice. Radial/line ice is typically 39% of the elevated flat surface ice. For more information on this, see this module.
High End 72 Hour Amount
1 in 10 Chance (10%) of Higher Ice Accumulation
Low End 72 Hour Amount – 9 in 10 Chance (90%) of Higher Ice Accumulation
This map depicts a reasonable lower-end ice accumulation amount for the time period shown on the graphic, based on many computer model simulations of possible ice accumulation totals. This lower amount is an unlikely scenario with a 9 in 10, or 90% chance that more snow will fall, and only a 1 in 10, or 10% chance that less snow will fall. This number can help serve as a lower-end scenario for planning purposes.
"Point Map" is Expected 72 Hour Ice Accumulation - Official NWS Forecast
The "Point" map is the official NWS ice accumulation forecast in inches during the time period shown on the graphic. This ice accumulation amount is determined by NWS forecasters to be the most likely outcome based on evaluation of data from computer models, satellite, radar, and other observations.
"Range Map" is Experimental Probabilistic Ice Accumulation Range Amounts over 72 hours
The "Range" map is the 25th percentile (lower number) to 75th percentile (higher number) of possible ice accumulation amounts based on the Weather Prediction Center (WPC) Super Ensemble output during the time period of the graphic. The official NWS ice accumulation forecast influences this range of values either up or down depending upon how closely they match.
High End 72 Hour Amount – Only a 1 in 10 Chance (10%) of Higher Ice Accumulation
This map depicts a reasonable upper-end ice accumulation amount for the time period shown on the graphic, based on many computer model simulations of possible ice accumulation totals. This higher amount is an unlikely scenario, with only a 1 in 10, or 10% chance that more snow will fall, and a 9 in 10, or 90% chance that less snow will fall. This number can help serve as an upper-end scenario for planning purposes.
The purpose of these experimental probabilistic ice accumulation products is to provide customers and partners a range of ice accumulation possibilities, in complement to existing NWS deterministic ice accumulation graphics, to better communicate forecast uncertainties during winter weather events. For more information visit this project's Product/Service Description Document, and please provide us your feedback here.
Percent Chance That 72 Hour Ice Accumulation Will Be Greater Than
This series of maps shows the probability (that is, the likelihood) that ice accumulation will equal or exceed specific amounts during the time period shown on the graphic. These forecasts are based on many computer model simulations of possible snowfall totals.
These tables show the ice accumulation forecast for individual locations, and provide the same information as the graphics on this web page, just shown in a different way. All of these values are valid for the same time period as depicted on the graphics.
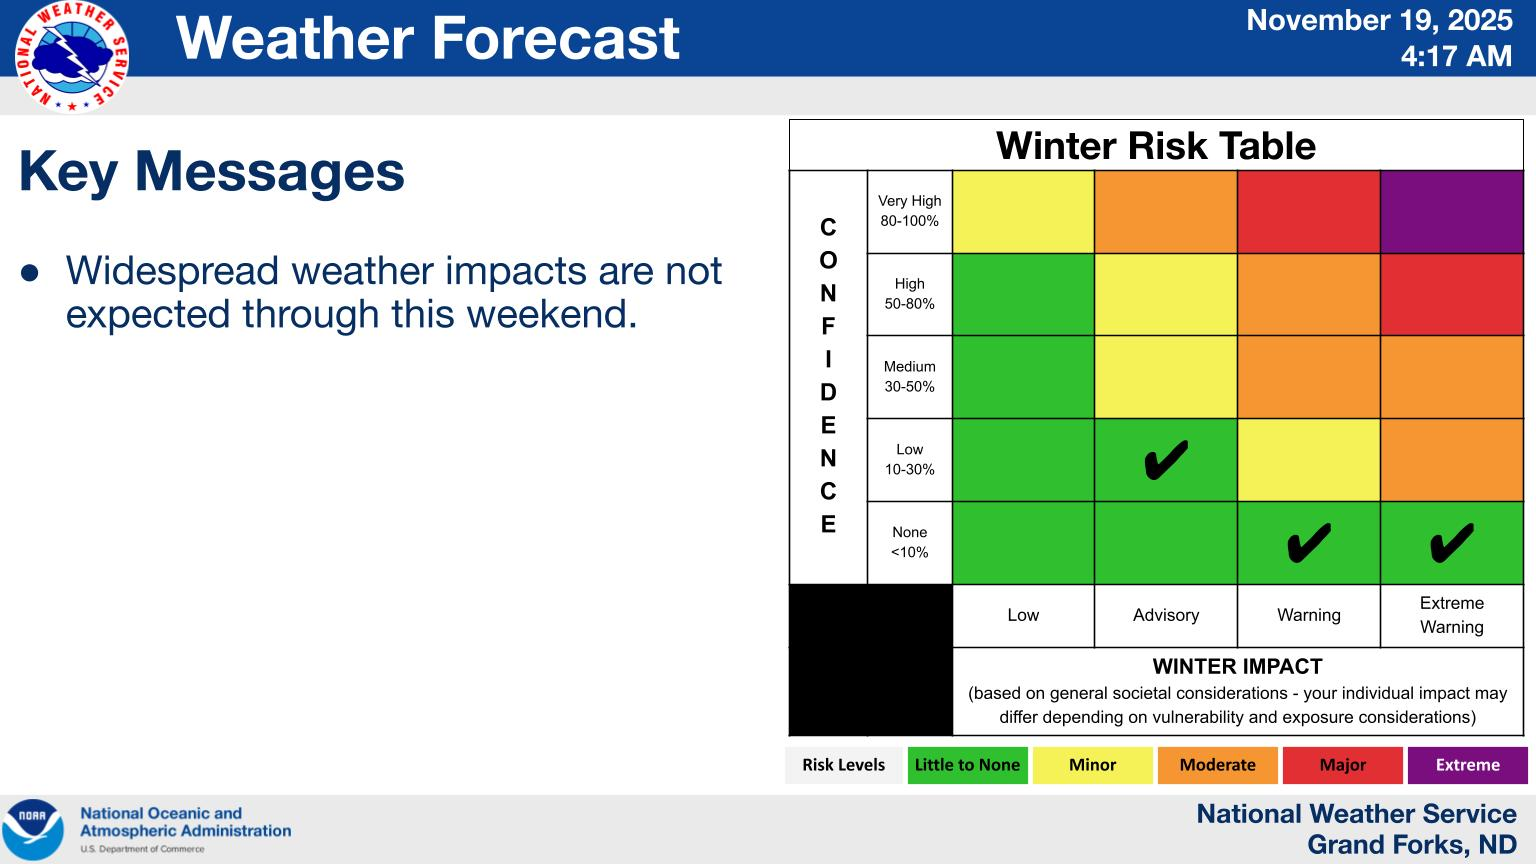
INFORMATION: The Winter Risk Tables is meant to shed light on what we are thinking in terms of our confidence in seeing differing levels of winter impact. They are binned into categories labelled Low (a.k.a. sub-advisory impacts), Advisory impacts, Warning impacts, and Extreme Warning impacts. We classify these impact categories using general societal considerations and our advisory/warning criteria - thus, your individual impact and risk may differ depending on your vulnerability and exposure to winter hazards.
In instances where we have multiple events within the 7-day forecast window, the maximum number of each event within each impact category is assigned to its respective bin.
Hover over thumbnails below to view a larger image.
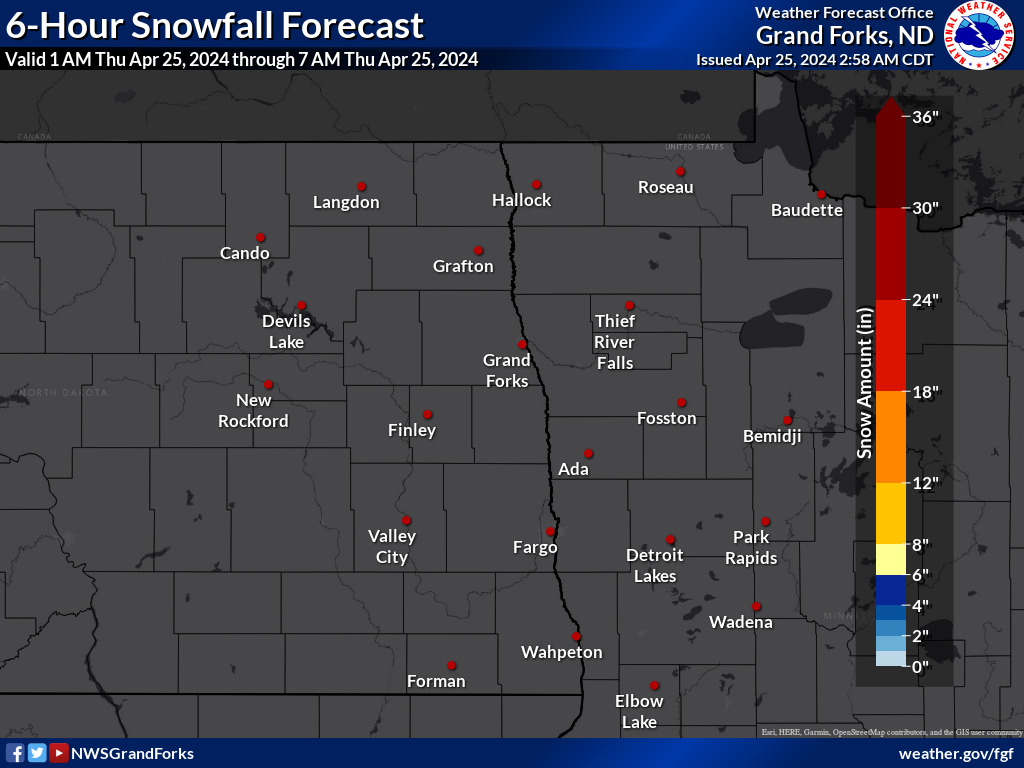
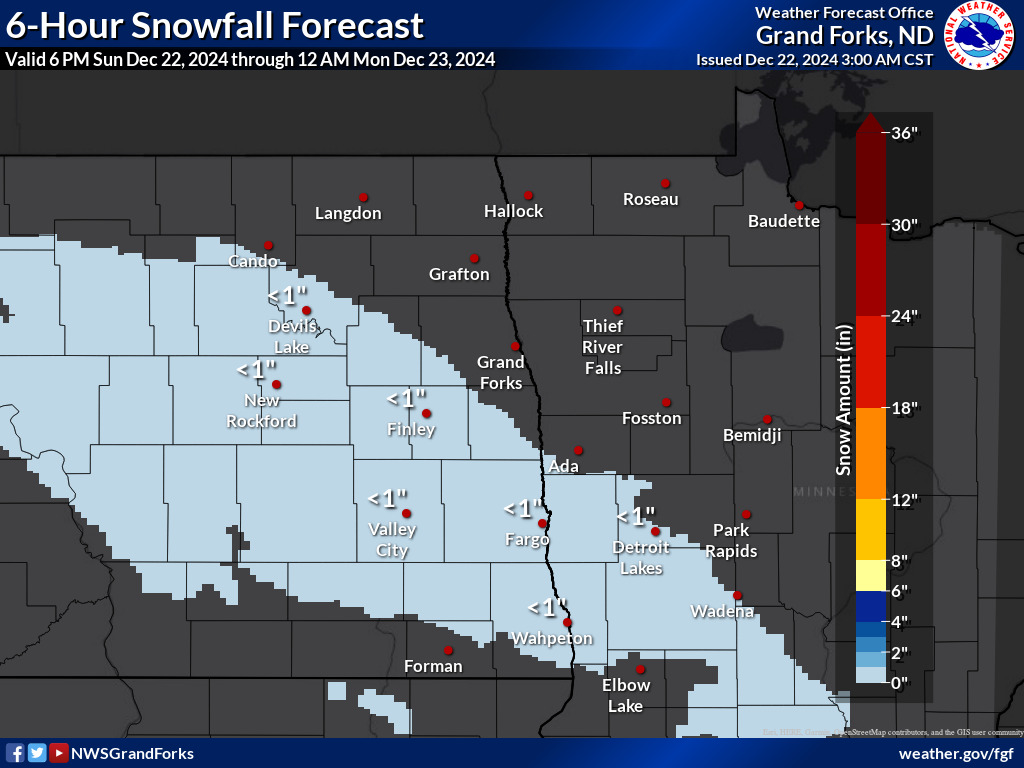
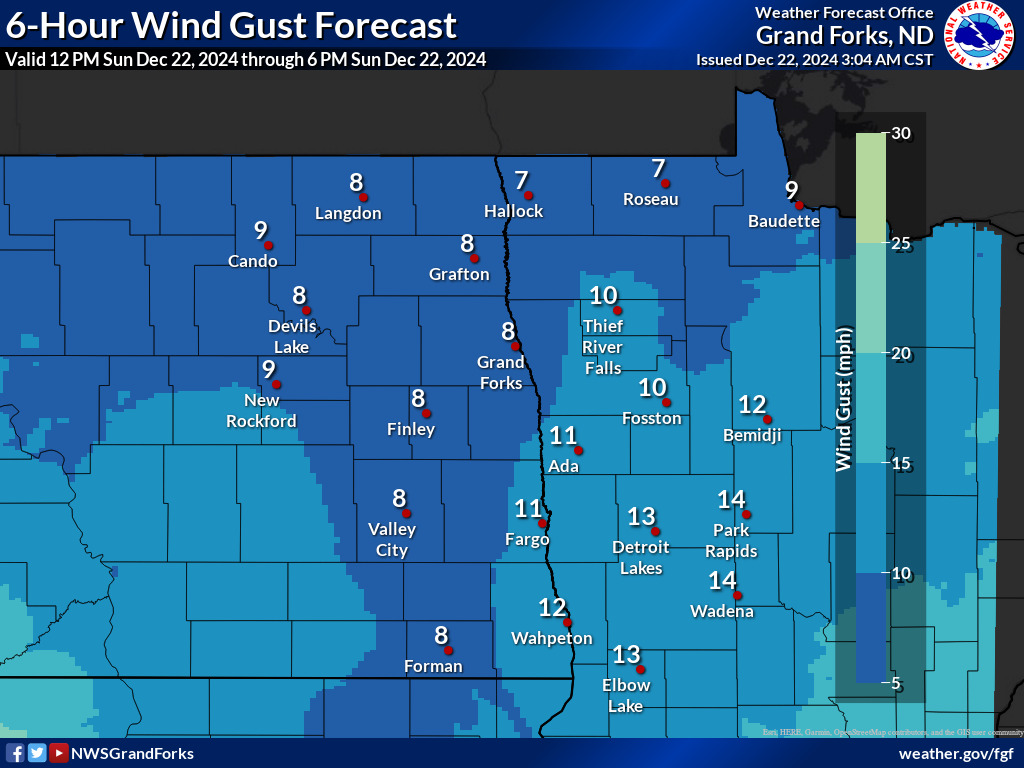
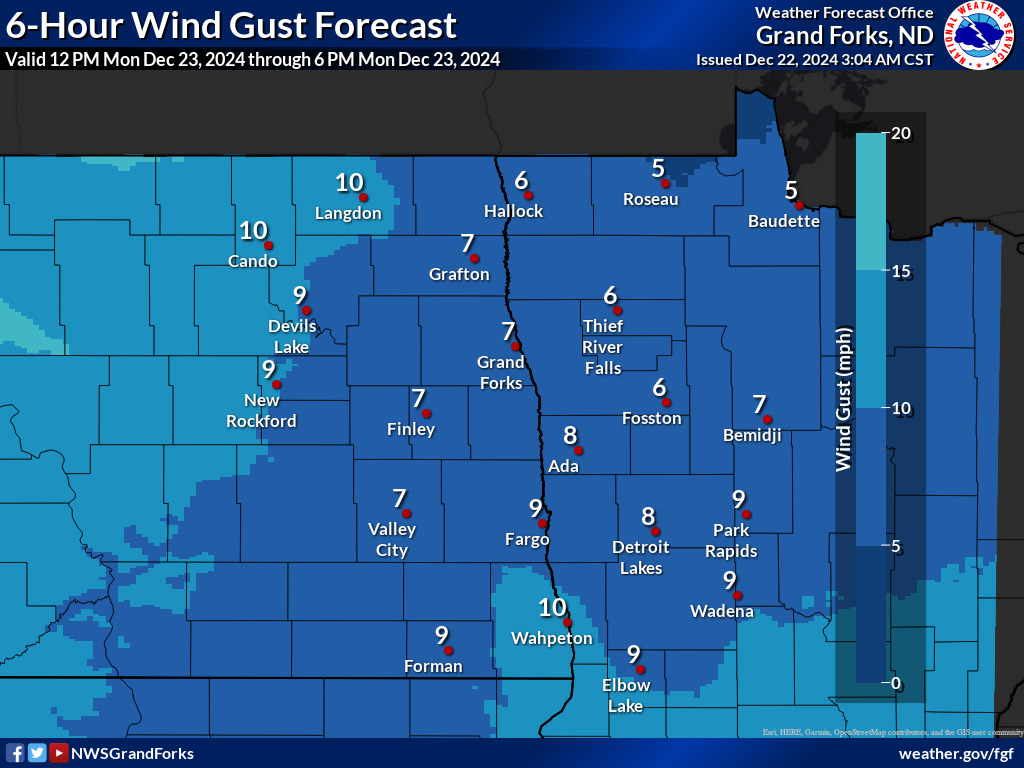
0 to 6 Hours
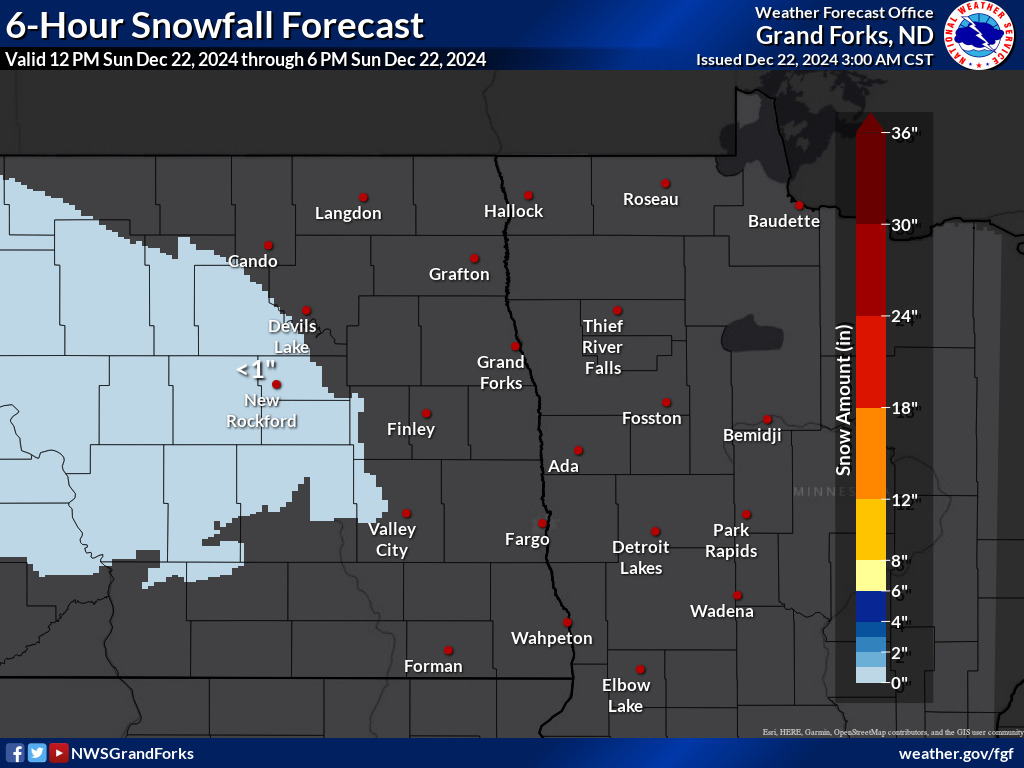
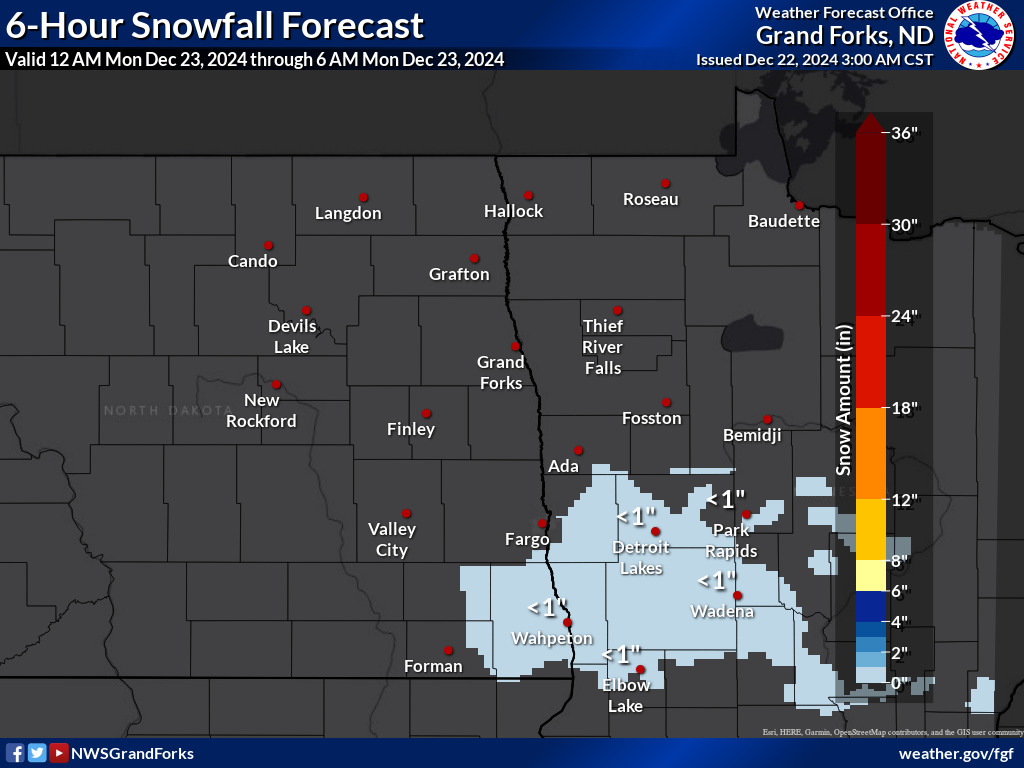
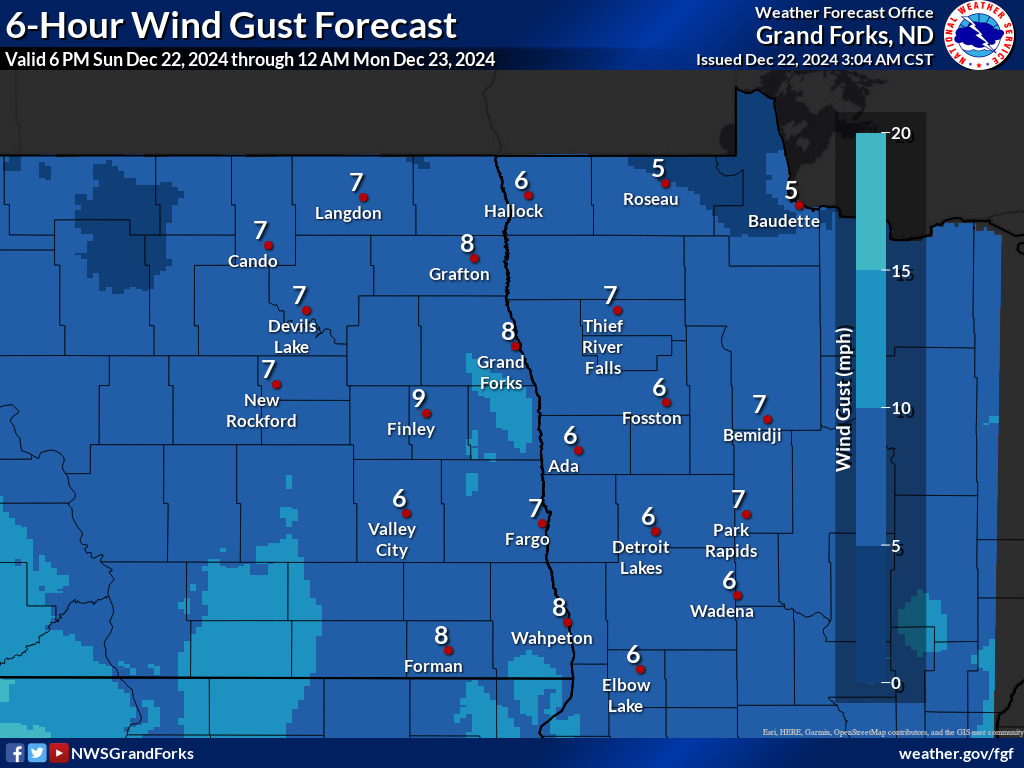
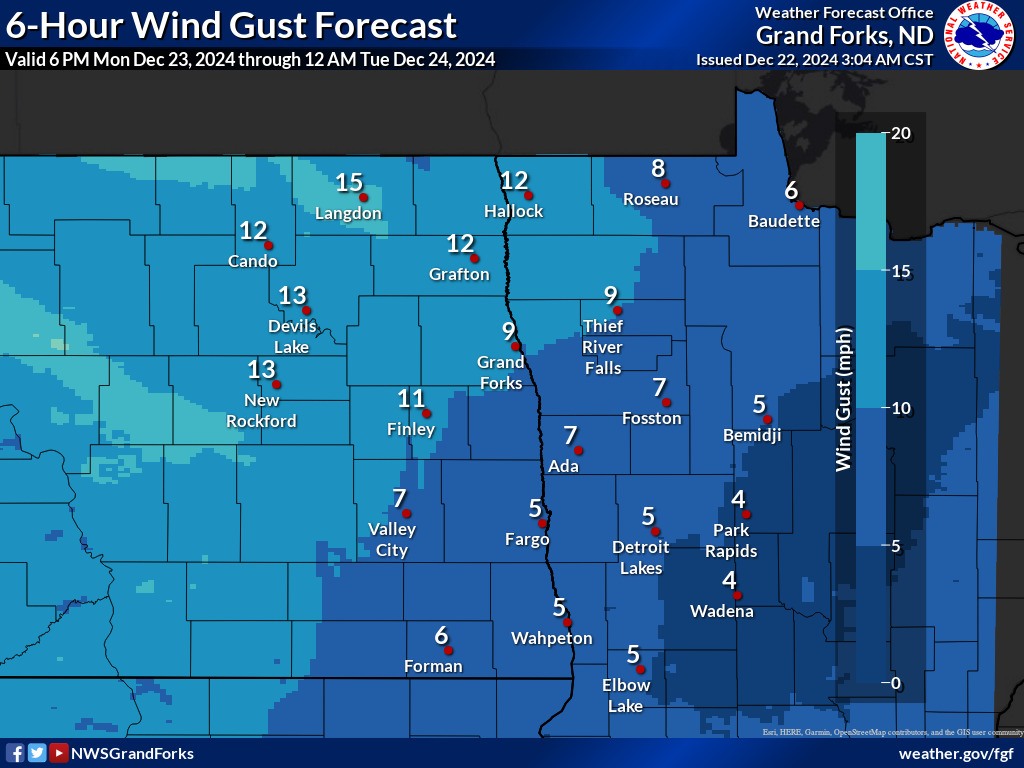
6 to 12 Hours
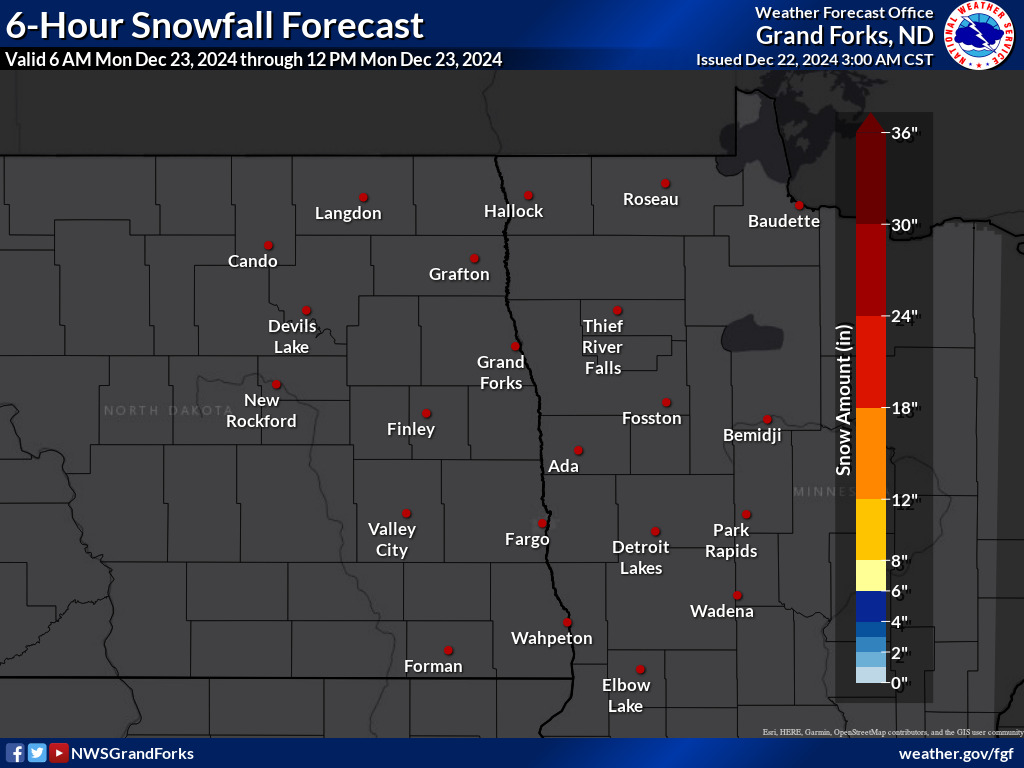
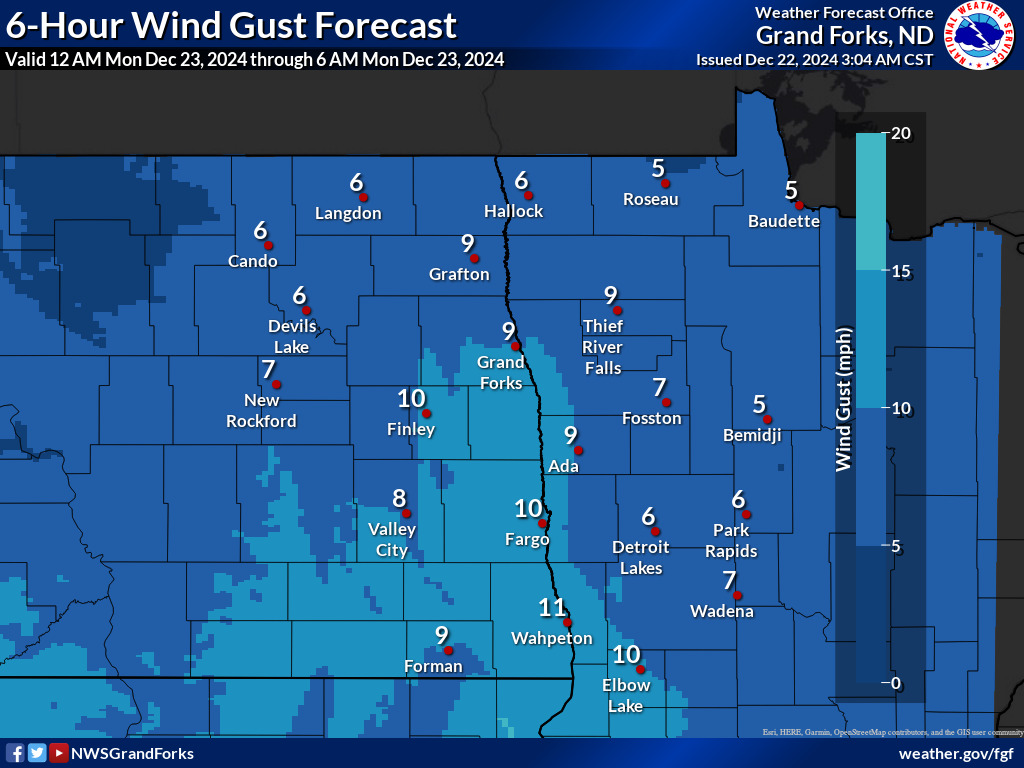
12 to 18 Hours
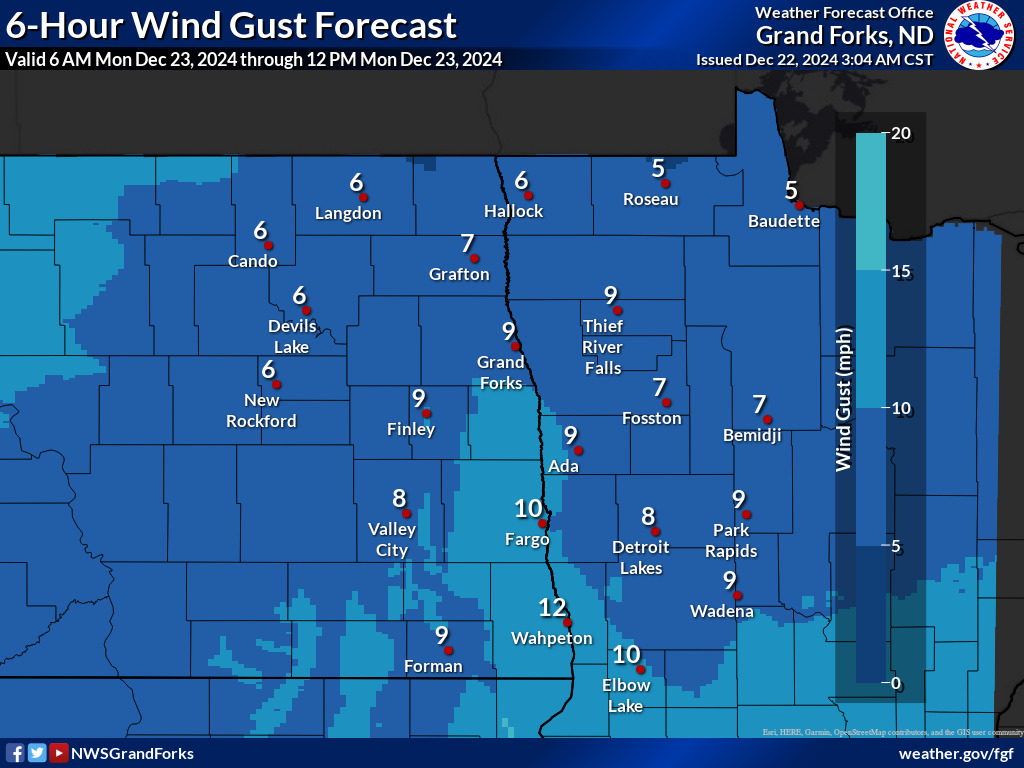
18 to 24 Hours
24 to 30 Hours
30 to 36 Hours
36 to 42 Hours
42 to 48 Hours
Hover over thumbnails below to view a larger image.
0 to 6 Hours
6 to 12 Hours
12 to 18 Hours
18 to 24 Hours
24 to 30 Hours
30 to 36 Hours
36 to 42 Hours
42 to 48 Hours
Hover over thumbnails below to view a larger image.
0 to 6 Hours
6 to 12 Hours
12 to 18 Hours
18 to 24 Hours
24 to 30 Hours
30 to 36 Hours
36 to 42 Hours
42 to 48 Hours
Hover over thumbnails below to view a larger image.
0 to 6 Hours
6 to 12 Hours
12 to 18 Hours
18 to 24 Hours
24 to 30 Hours
30 to 36 Hours
36 to 42 Hours
42 to 48 Hours
Hover over thumbnails below to view a larger image.
0 to 6 Hours
6 to 12 Hours
12 to 18 Hours
18 to 24 Hours
24 to 30 Hours
30 to 36 Hours
36 to 42 Hours
42 to 48 Hours
Hover over thumbnails below to view a larger image.


