Scattered severe thunderstorms capable of damaging wind gusts and some hail are expected this afternoon and evening from the Upper Ohio River Valley into the Northeast, and from the Appalachians into the Mid-Atlantic States. Excessive rainfall from heavy thunderstorms may produce areas of flash flooding from southern New Mexico into the western and northern Gulf Coast into Wednesday. Read More >
| Climate/Almanac Data - August Normals - August Records | |||||||||||||||||||||||||||||||||||||||||||||||||||||||||||||
| August | |||||||||||||||||||||||||||||||||||||||||||||||||||||||||||||
The ranking is listed in parentheses (__) when within the "Top 10".
|
|||||||||||||||||||||||||||||||||||||||||||||||||||||||||||||
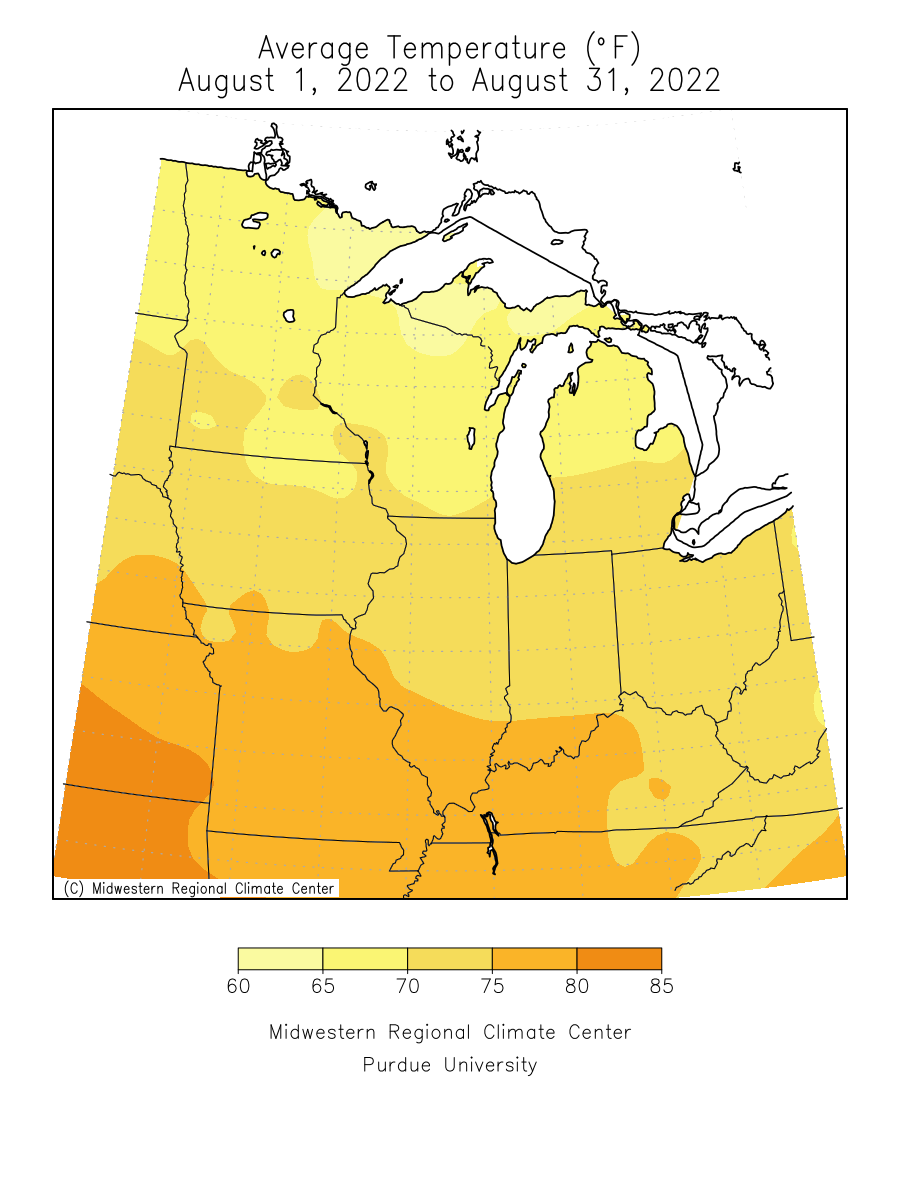
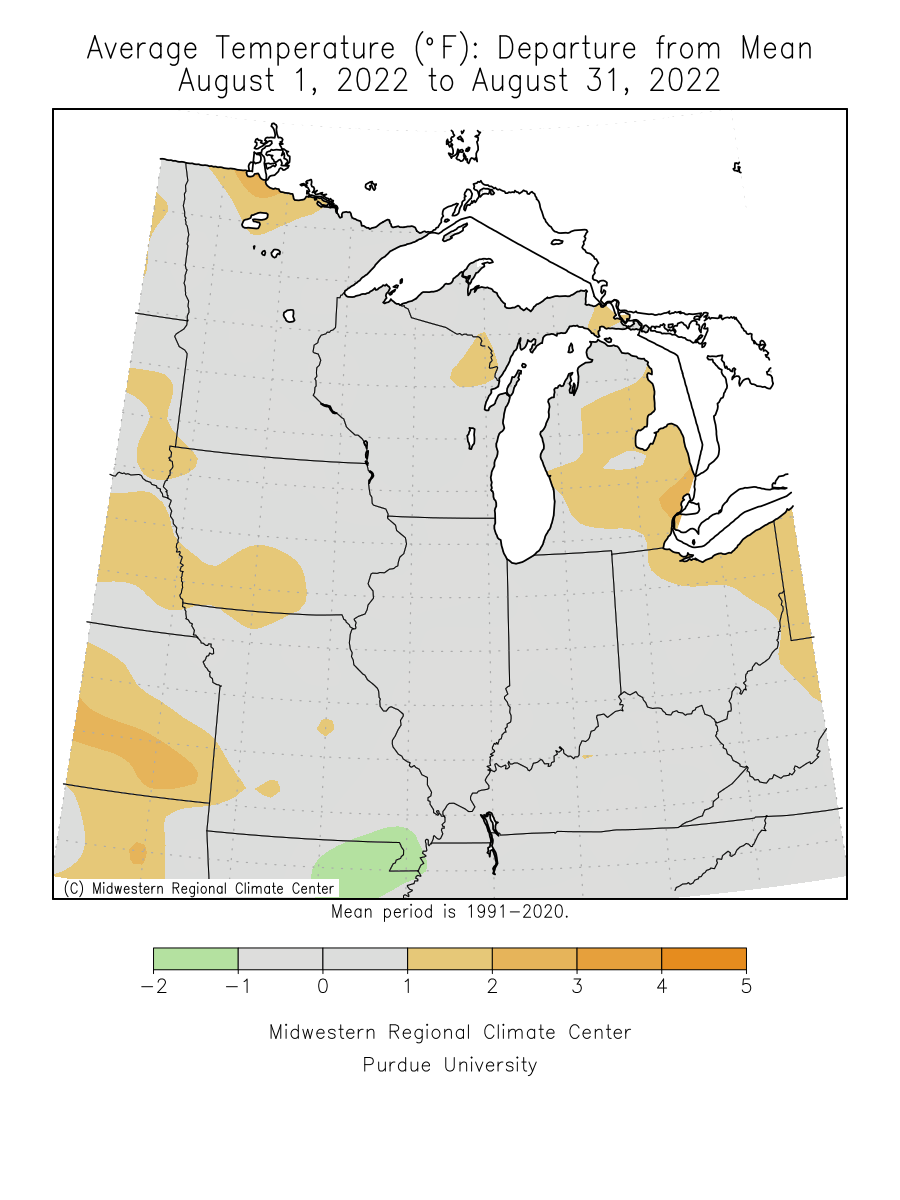
| August 2022 was near normal to about 1 degree above normal. | |||||||||||||||||||||||||||||||||||||||||||||||||||||||||||||
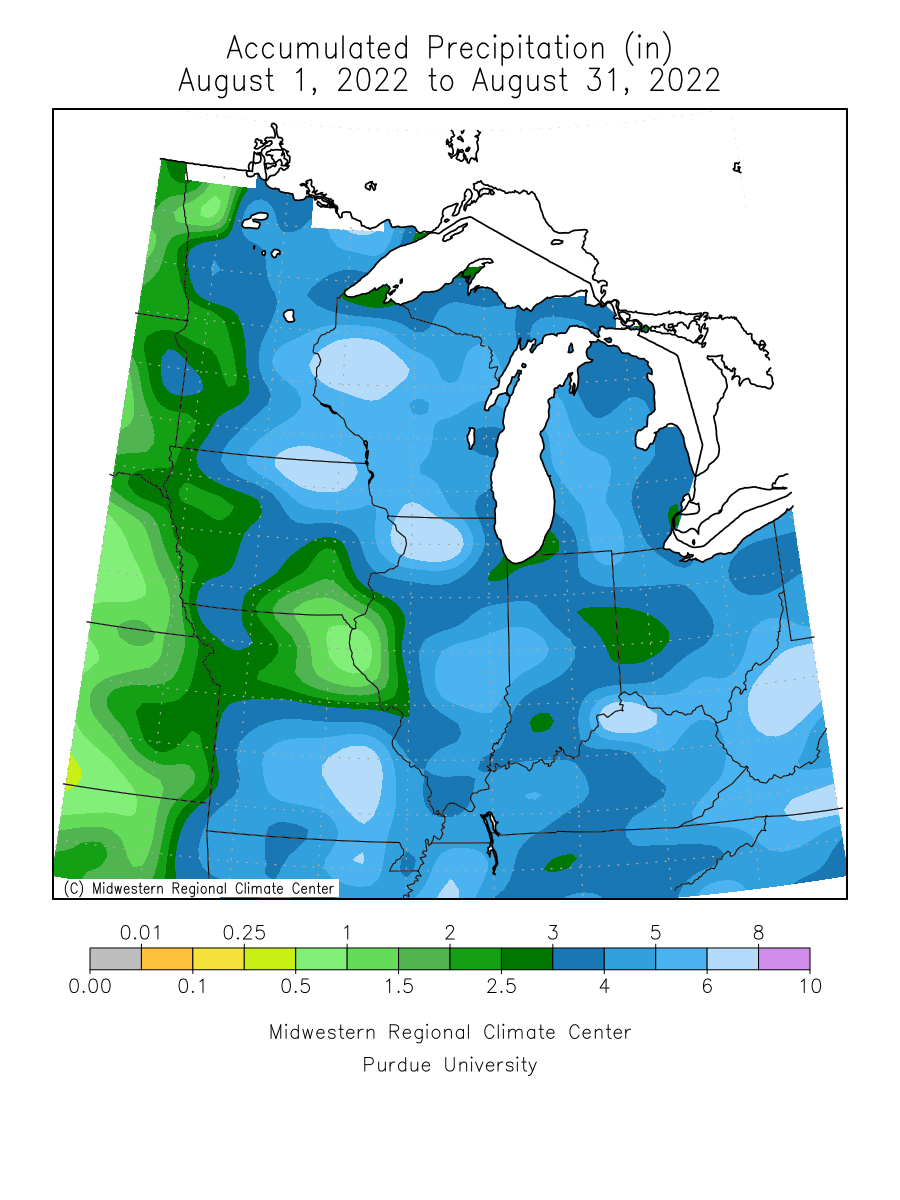
| Precipitation totals were about 1.5 inches above normal at Dubuque to 2.75 inches below normal at Burlington. | |||||||||||||||||||||||||||||||||||||||||||||||||||||||||||||
| Please see August Records for monthly record information. | |||||||||||||||||||||||||||||||||||||||||||||||||||||||||||||
| The climate maps below are courtesy of the Midwest Regional Climate Center. | |||||||||||||||||||||||||||||||||||||||||||||||||||||||||||||
| These maps become available around 10am on the first of the month. | |||||||||||||||||||||||||||||||||||||||||||||||||||||||||||||
|
|||||||||||||||||||||||||||||||||||||||||||||||||||||||||||||
| Climate/Almanac Data - Summer Normals - Summer Records | |||||||||||||||||||||||||||||||||||||||||||||||||||||||||||||
| Summer (Jun-Aug) |
|||||||||||||||||||||||||||||||||||||||||||||||||||||||||||||
|
|||||||||||||||||||||||||||||||||||||||||||||||||||||||||||||
|
The ranking is listed in parentheses (__) when within the "Top 10".
|
|||||||||||||||||||||||||||||||||||||||||||||||||||||||||||||
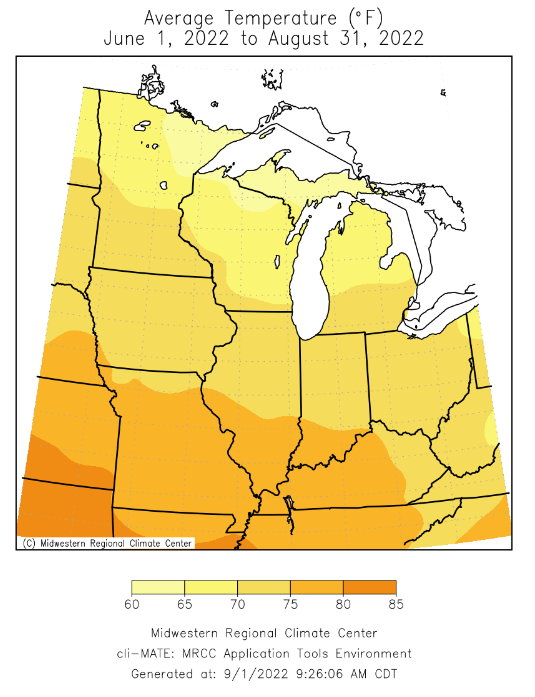
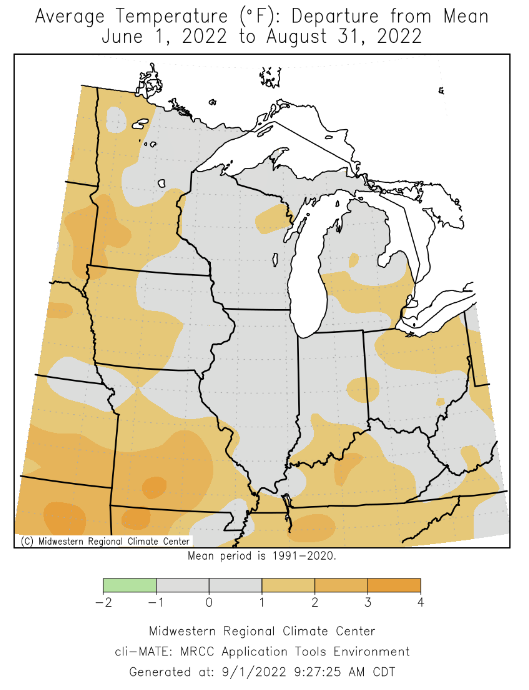
| Summer 2022 was near normal to about 1 degree above normal. | |||||||||||||||||||||||||||||||||||||||||||||||||||||||||||||
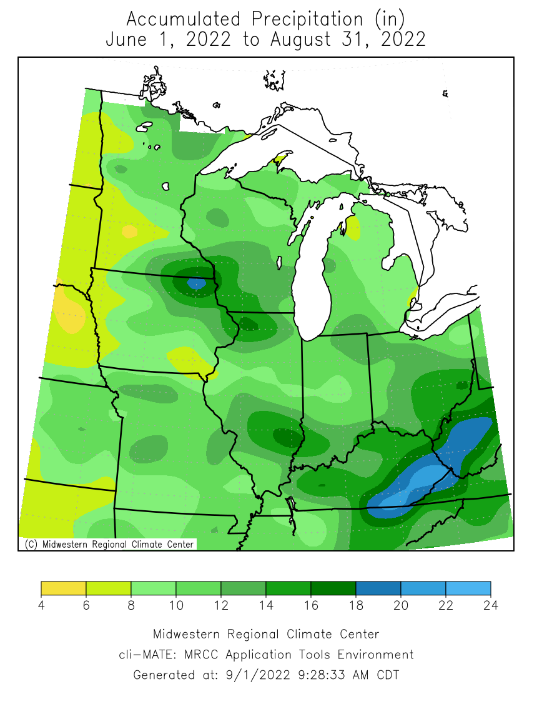
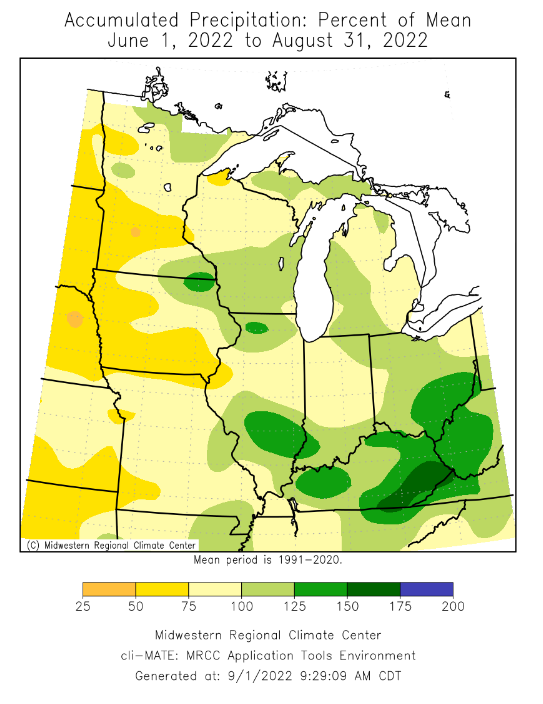
| Precipitation totals were near normal at Davenport to almost 7 inches below normal at Burlington. | |||||||||||||||||||||||||||||||||||||||||||||||||||||||||||||
| Please see Summer Records for seasonal record information. | |||||||||||||||||||||||||||||||||||||||||||||||||||||||||||||
| The climate maps below are courtesy of the Midwest Regional Climate Center. | |||||||||||||||||||||||||||||||||||||||||||||||||||||||||||||
| The maps below will be updated by late morning on the first of the month. | |||||||||||||||||||||||||||||||||||||||||||||||||||||||||||||
|
|||||||||||||||||||||||||||||||||||||||||||||||||||||||||||||
| A LOOK AHEAD | |||||||||||||||||||||||||||||||||||||||||||||||||||||||||||||
| Climate Prediction Center | |||||||||||||||||||||||||||||||||||||||||||||||||||||||||||||
|
|||||||||||||||||||||||||||||||||||||||||||||||||||||||||||||
|
|
|||||||||||||||||||||||||||||||||||||||||||||||||||||||||||||