Showers and thunderstorms will be possible from the northern Plains to the Gulf Coast on Monday. Thunderstorms with large hail and severe wind gusts are expected Monday afternoon and evening across parts of the central Plains. Read More >
| Climate/Almanac Data - August Normals - August Records | |||||||||||||||||||||||||||||||||||||||||||||||||||||||||||||
| August | |||||||||||||||||||||||||||||||||||||||||||||||||||||||||||||
The ranking is listed in parentheses (__) when within the "Top 10".
|
|||||||||||||||||||||||||||||||||||||||||||||||||||||||||||||
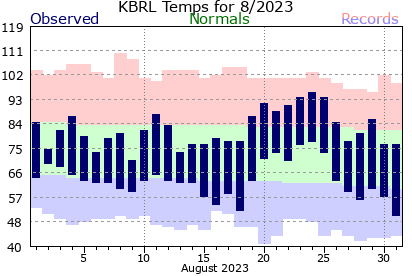
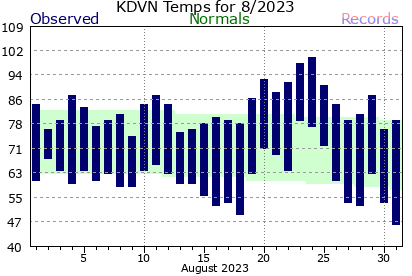
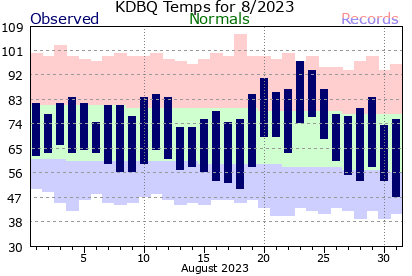
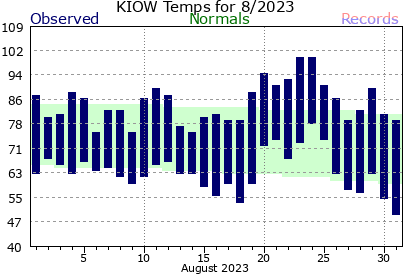
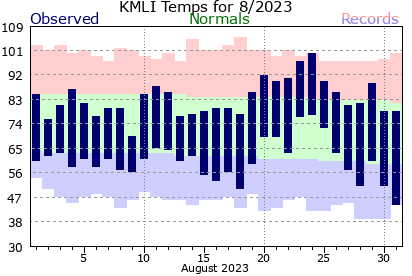
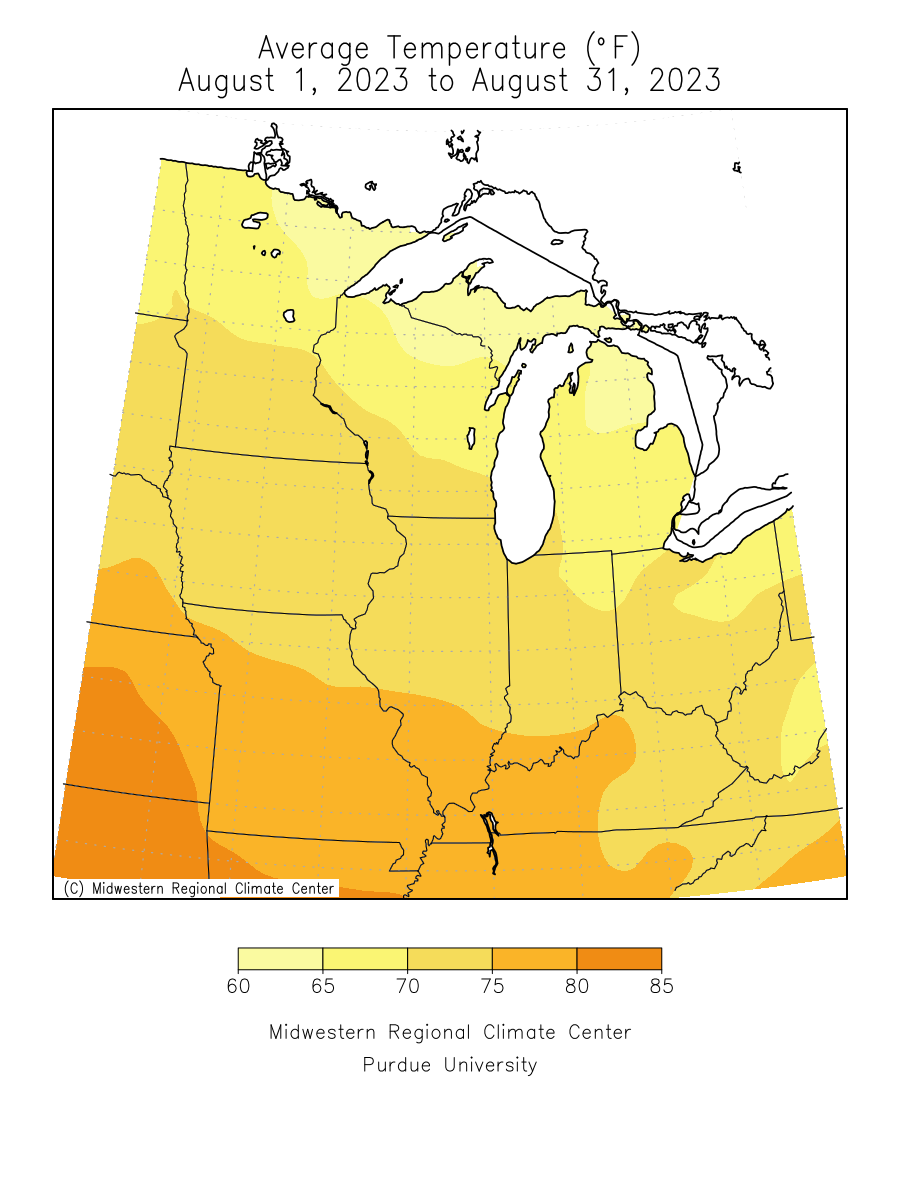
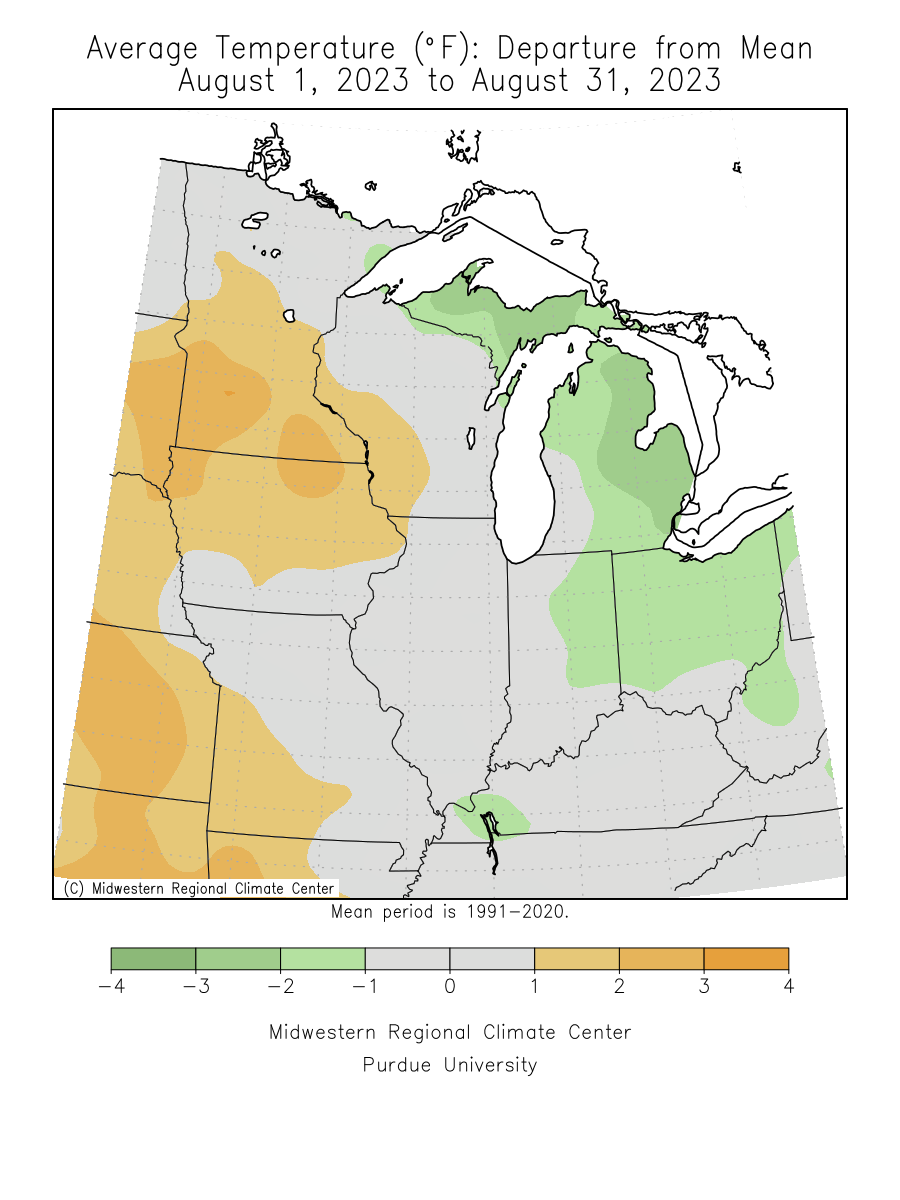
| August 2023 was about 1 degree below normal at Moline to 2.5 degrees above normal at Cedar Rapids. | |||||||||||||||||||||||||||||||||||||||||||||||||||||||||||||
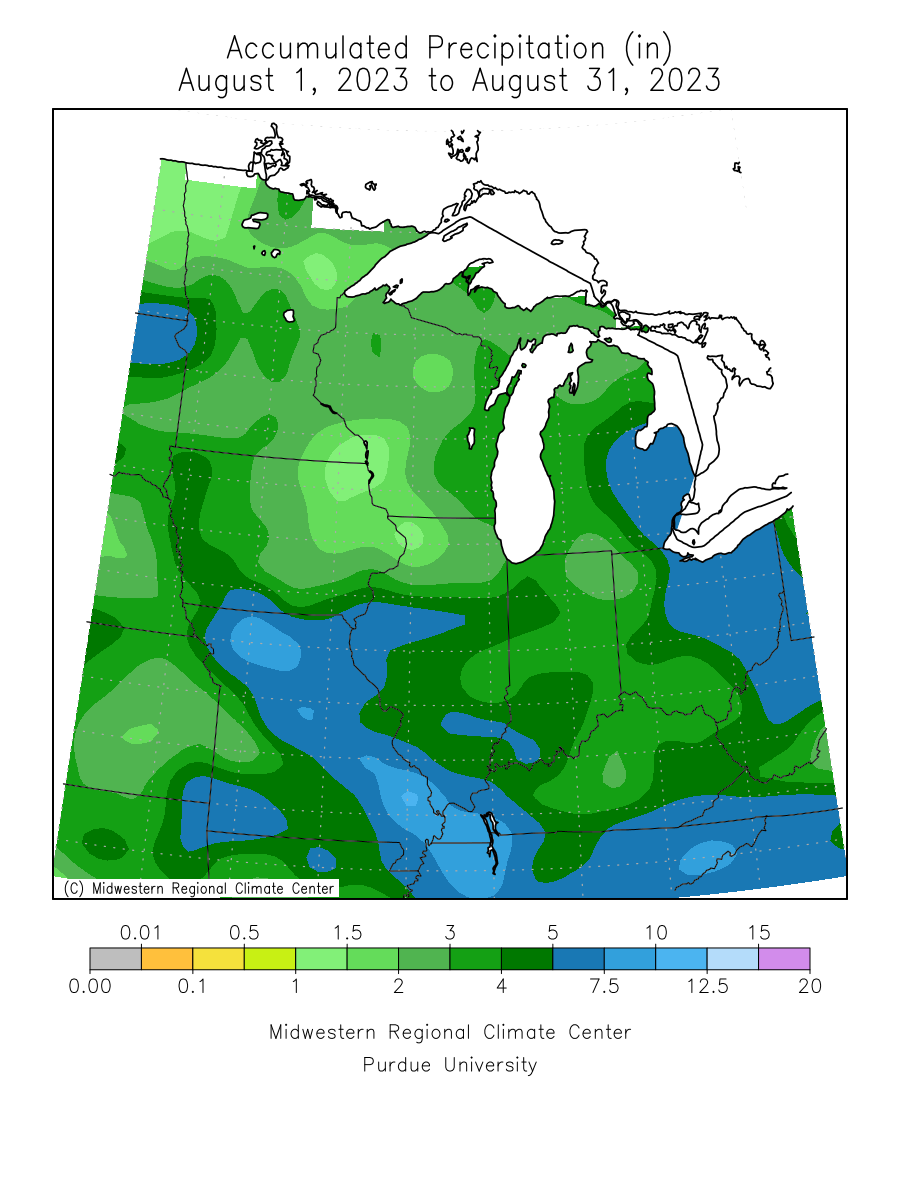
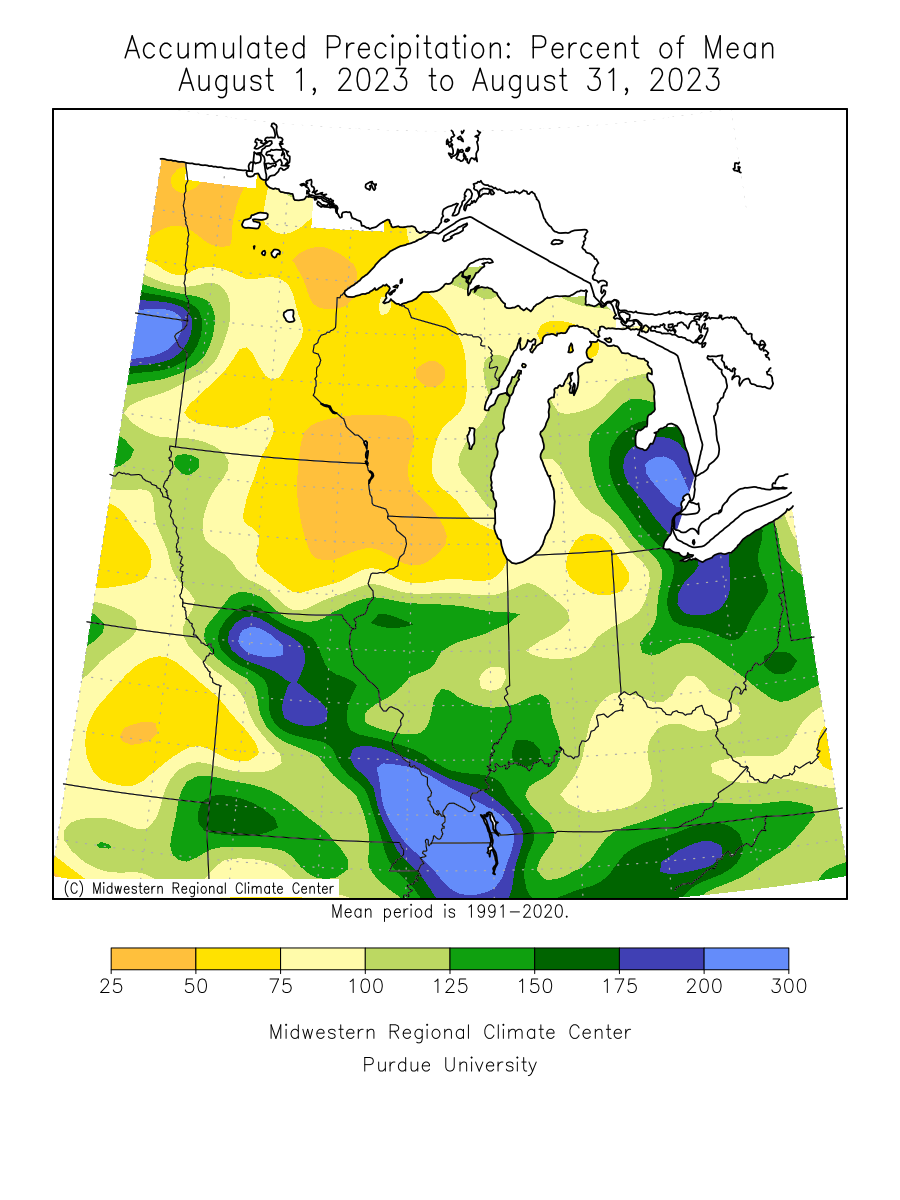
| Precipitation totals were normal near Dubuque, 1.5 to 2" below normal along I-80, and 3 3/4 inches above normal near Burlington. | |||||||||||||||||||||||||||||||||||||||||||||||||||||||||||||
| Please see August Records for monthly record information. | |||||||||||||||||||||||||||||||||||||||||||||||||||||||||||||
|
|||||||||||||||||||||||||||||||||||||||||||||||||||||||||||||
| The climate maps below are courtesy of the Midwest Regional Climate Center. | |||||||||||||||||||||||||||||||||||||||||||||||||||||||||||||
| These maps become available around 10am on the first of the month. | |||||||||||||||||||||||||||||||||||||||||||||||||||||||||||||
|
|||||||||||||||||||||||||||||||||||||||||||||||||||||||||||||
| Climate/Almanac Data - Summer Normals - Summer Records | |||||||||||||||||||||||||||||||||||||||||||||||||||||||||||||
| Summer (Jun-Aug) |
|||||||||||||||||||||||||||||||||||||||||||||||||||||||||||||
|
|||||||||||||||||||||||||||||||||||||||||||||||||||||||||||||
|
The ranking is listed in parentheses (__) when within the "Top 10".
|
|||||||||||||||||||||||||||||||||||||||||||||||||||||||||||||
| Summer 2023 was near normal to about 1.5 degrees above normal at Cedar Rapids. | |||||||||||||||||||||||||||||||||||||||||||||||||||||||||||||
| Precipitation totals were about 3.5 to 8 inches below normal, with the exception of Burlington which was about 4.5" above normal. | |||||||||||||||||||||||||||||||||||||||||||||||||||||||||||||
| Please see Summer Records for seasonal record information. | |||||||||||||||||||||||||||||||||||||||||||||||||||||||||||||
| The climate maps below are courtesy of the Midwest Regional Climate Center. | |||||||||||||||||||||||||||||||||||||||||||||||||||||||||||||
| The maps below will be updated by late morning on the first of the month. | |||||||||||||||||||||||||||||||||||||||||||||||||||||||||||||
|
|||||||||||||||||||||||||||||||||||||||||||||||||||||||||||||
| A LOOK AHEAD | |||||||||||||||||||||||||||||||||||||||||||||||||||||||||||||
| Climate Prediction Center | |||||||||||||||||||||||||||||||||||||||||||||||||||||||||||||
|
|||||||||||||||||||||||||||||||||||||||||||||||||||||||||||||
|
|
|||||||||||||||||||||||||||||||||||||||||||||||||||||||||||||