Scattered severe thunderstorms capable of damaging wind gusts and some hail are expected this afternoon and evening from the Upper Ohio River Valley into the Northeast, and from the Appalachians into the Mid-Atlantic States. Excessive rainfall from heavy thunderstorms may produce areas of flash flooding from southern New Mexico into the western and northern Gulf Coast into Wednesday. Read More >
| Climate/Almanac Data - Jan Normals - Jan Records | |||||||||||||||||||||||||||||||||||||||||||||||||||||||||||||||||||||||||||
| JANUARY | |||||||||||||||||||||||||||||||||||||||||||||||||||||||||||||||||||||||||||
|
|||||||||||||||||||||||||||||||||||||||||||||||||||||||||||||||||||||||||||
| The ranking is listed in parentheses (__) when within the "Top 10". | |||||||||||||||||||||||||||||||||||||||||||||||||||||||||||||||||||||||||||
|
|||||||||||||||||||||||||||||||||||||||||||||||||||||||||||||||||||||||||||
| Please see Jan Records for monthly record information. | |||||||||||||||||||||||||||||||||||||||||||||||||||||||||||||||||||||||||||
|
|||||||||||||||||||||||||||||||||||||||||||||||||||||||||||||||||||||||||||
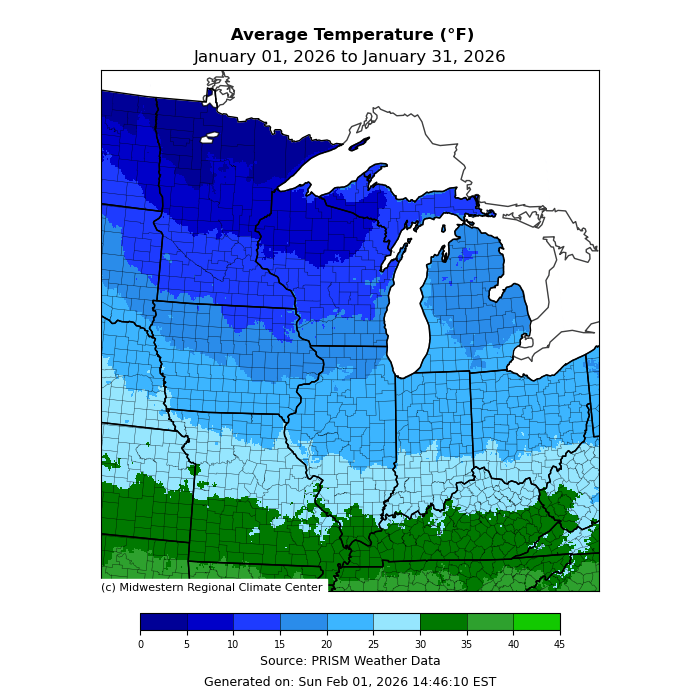
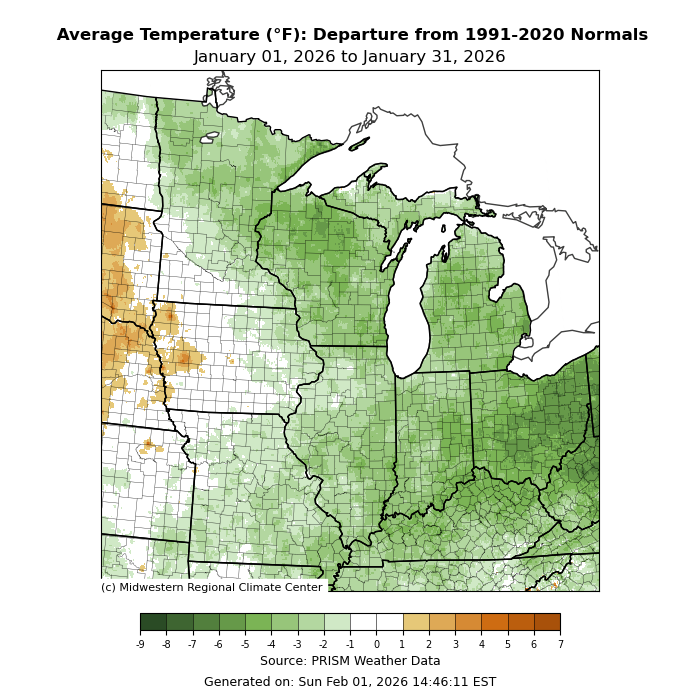
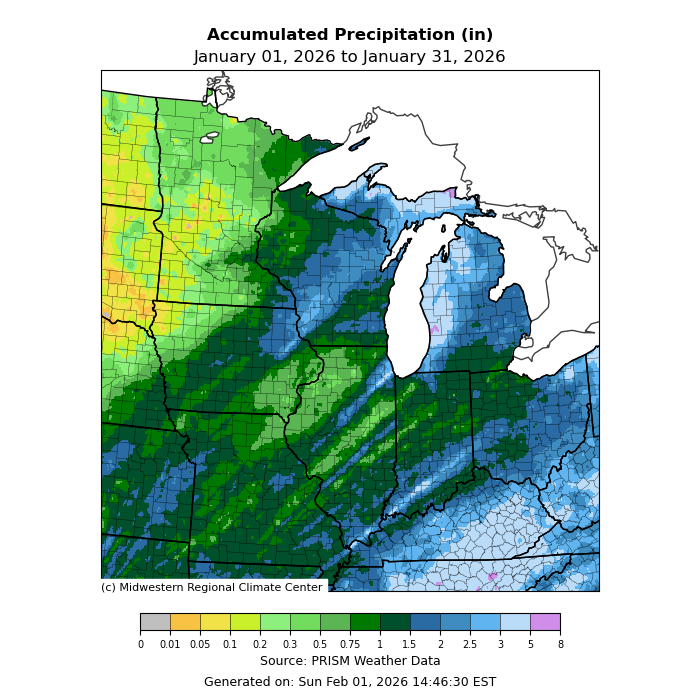
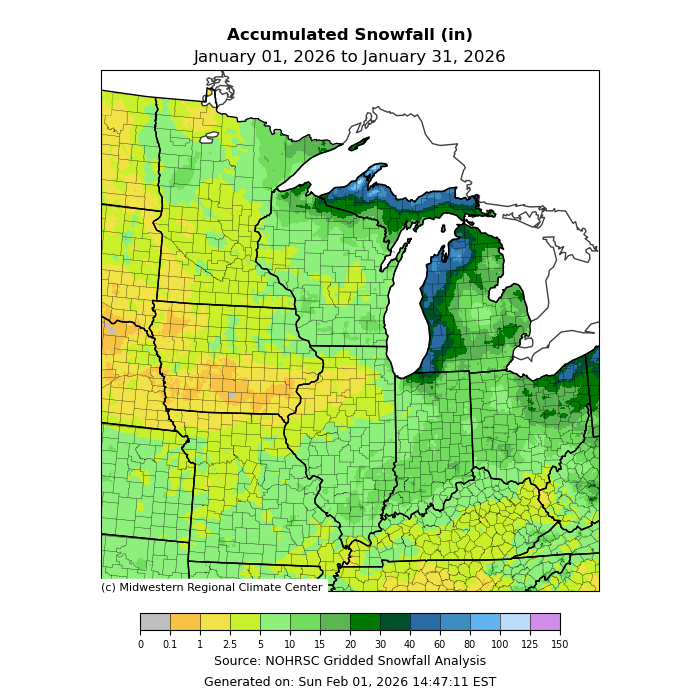
| The climate maps below are courtesy of the Northeast Regional Climate Center and Midwest Regional Climate Center. | |||||||||||||||||||||||||||||||||||||||||||||||||||||||||||||||||||||||||||
| These maps should update to the most recent "last month" on the first of the month. | |||||||||||||||||||||||||||||||||||||||||||||||||||||||||||||||||||||||||||
|
|||||||||||||||||||||||||||||||||||||||||||||||||||||||||||||||||||||||||||
| A LOOK AHEAD | |||||||||||||||||||||||||||||||||||||||||||||||||||||||||||||||||||||||||||
| For more information on the Climate Outlooks, see the Climate Prediction Center. | |||||||||||||||||||||||||||||||||||||||||||||||||||||||||||||||||||||||||||
|
|||||||||||||||||||||||||||||||||||||||||||||||||||||||||||||||||||||||||||