Gusty to high winds and low relative humidity will bring elevated to critical fire weather to the central and southern Plains into Wednesday. Two Pacific storms will impact the western U.S. into Wednesday with gusty winds, low elevation rain, and heavy mountain snow. Read More >
Overview
Find a recap of this past December's weather, as well as 2021 on the whole in the tabs below.
.
December 2021
December 2021 finished near to above average by about 1 to 3 degrees. That said, there was a clear difference between the beginning and end, from record-breaking warmth to bitter cold. Daily record highs were set or tied on the 23rd at Sisseton, 24th at Sisseton and Pierre, and on the 1st at Aberdeen, Sisseton and Mobridge. Mobridge also set a monthly record high on the 1st – Mobridge had never reached 71 F in December before this year in recorded history (70 on Dec 6th in 1939). This was only the 2nd time Mobridge had reached 70 F in December. Similarly, Pierre reached 71 F on the 1st, which was only the 7th time a 70 F temp had been recorded in December; Sisseton 62 F on the 1st, only the 10th time a 60 F temp had been recorded; Aberdeen 65 F on the 1st, only the 2nd time a 65 F temp had been recorded.
While central South Dakota finished below average in terms of precipitation and snowfall for the most part this December, there were several bouts of snow across northeastern SD and west central MN. This included events on the 4th, 7th, a heavy banded snow event on the 17th (totals of over a foot in Marshall County), and on the 25th and 26th. In fact, this was the 4th wettest December on record at Sisseton and the 2nd snowiest, and it was the 2nd wettest at Wheaton and 5th snowiest. Both Aberdeen and Sisseton set daily snowfall records on the 17th.
|
December 2021 |
||||
|
Temperature Data |
Aberdeen |
Sisseton |
Wheaton |
Watertown |
|
Warmest Temperature / Date |
65 / 1st |
62 / 1st |
55 / 2nd |
54 / 1st |
|
Coldest Temperature / Date |
-20 / 28, 29th |
-12 / 29th |
-16 / 29th |
-14 / 31st |
|
Average High / Departure from Normal |
29.5 / +0.8 |
33.2 / +5.4 |
26.0 / +0.4 |
29.4 / +3.1 |
|
Average Low / Departure from Normal |
9.5 / +1.6 |
13.5 / +3.1 |
9.7 / -0.2 |
10.6 / +1.3 |
|
Monthly Average / Departure from Normal |
19.5 / +1.2 |
23.4 / +4.3 |
17.9 / +0.2 |
20.0 / +2.2 |
|
Precipitation Data |
|
|
|
|
|
Monthly Precipitation / Departure from Normal |
0.78 / +0.17 |
1.75 / +1.15 |
1.78 / +0.96 |
1.06 / +0.38 |
|
Most Precipitation in 24 hours / Date |
0.17 / 17th |
0.47 / 17th |
0.47 / 27th |
0.26 / 15th |
|
Monthly Snowfall / Departure from Normal |
11.8 / +3.8 |
20.3 / +14.8 |
15.6 / +7.0 |
9.9 / +1.0 |
|
Most Snow in 24 hours / Date |
4.0 / 17th |
9.7 / 17th |
6.8 / 27th |
3.6 / 7th |
|
|
|
|
|
|
|
Temperature Data |
Pierre |
Kennebec |
Mobridge |
Timber Lake |
|
Warmest Temperature / Date |
71 / 1st |
71 / 1st |
71 / 1st |
67 / 1st |
|
Coldest Temperature / Date |
-8 / 28th |
-6 / 31st |
-16 / 28, 29th |
-9 / 18th |
|
Average High / Departure from Normal |
36.0 / +3.6 |
36.7 / +2.4 |
33.1 / +1.5 |
31.8 / +1.6 |
|
Average Low / Departure from Normal |
13.9 / +0.7 |
15.2 / +2.7 |
11.7 / -0.3 |
11.9 / +0.6 |
|
Monthly Average / Departure from Normal |
25.0 / +2.2 |
26.0 / +2.6 |
22.4 / +0.6 |
21.9 / +1.1 |
|
Precipitation Data |
|
|
|
|
|
Monthly Precipitation / Departure from Normal |
0.07 / -0.57 |
0.55 / +0.08 |
0.67 / +0.16 |
0.44 / -0.13 |
|
Most Precipitation in 24 hours / Date |
0.03 / 28th |
0.44 / 10th |
0.23 / 26th |
0.07 / 21,25,27th |
|
Monthly Snowfall / Departure from Normal |
1.1 / -5.1 |
10.5 / +3.3 |
4.9 / -0.8 |
5.7 / -2.6 |
|
Most Snow in 24 hours / Date |
0.5 / 28th |
7.0 / 10th |
2.5 / 26th |
1.2 / 27th |
December 2021 temperature departure from normal, from the Midwestern Regional Climate Center
Daily high temperatures (numbers) and departures from normal (shading) through December 2021 for 5 different sites.
December 2021 precipitation totals (left) and departures from normal (right), from the Midwestern Regional Climate Center
December 2021 snowfall totals (left) and departures from normal (right), from the Midwestern Regional Climate Center
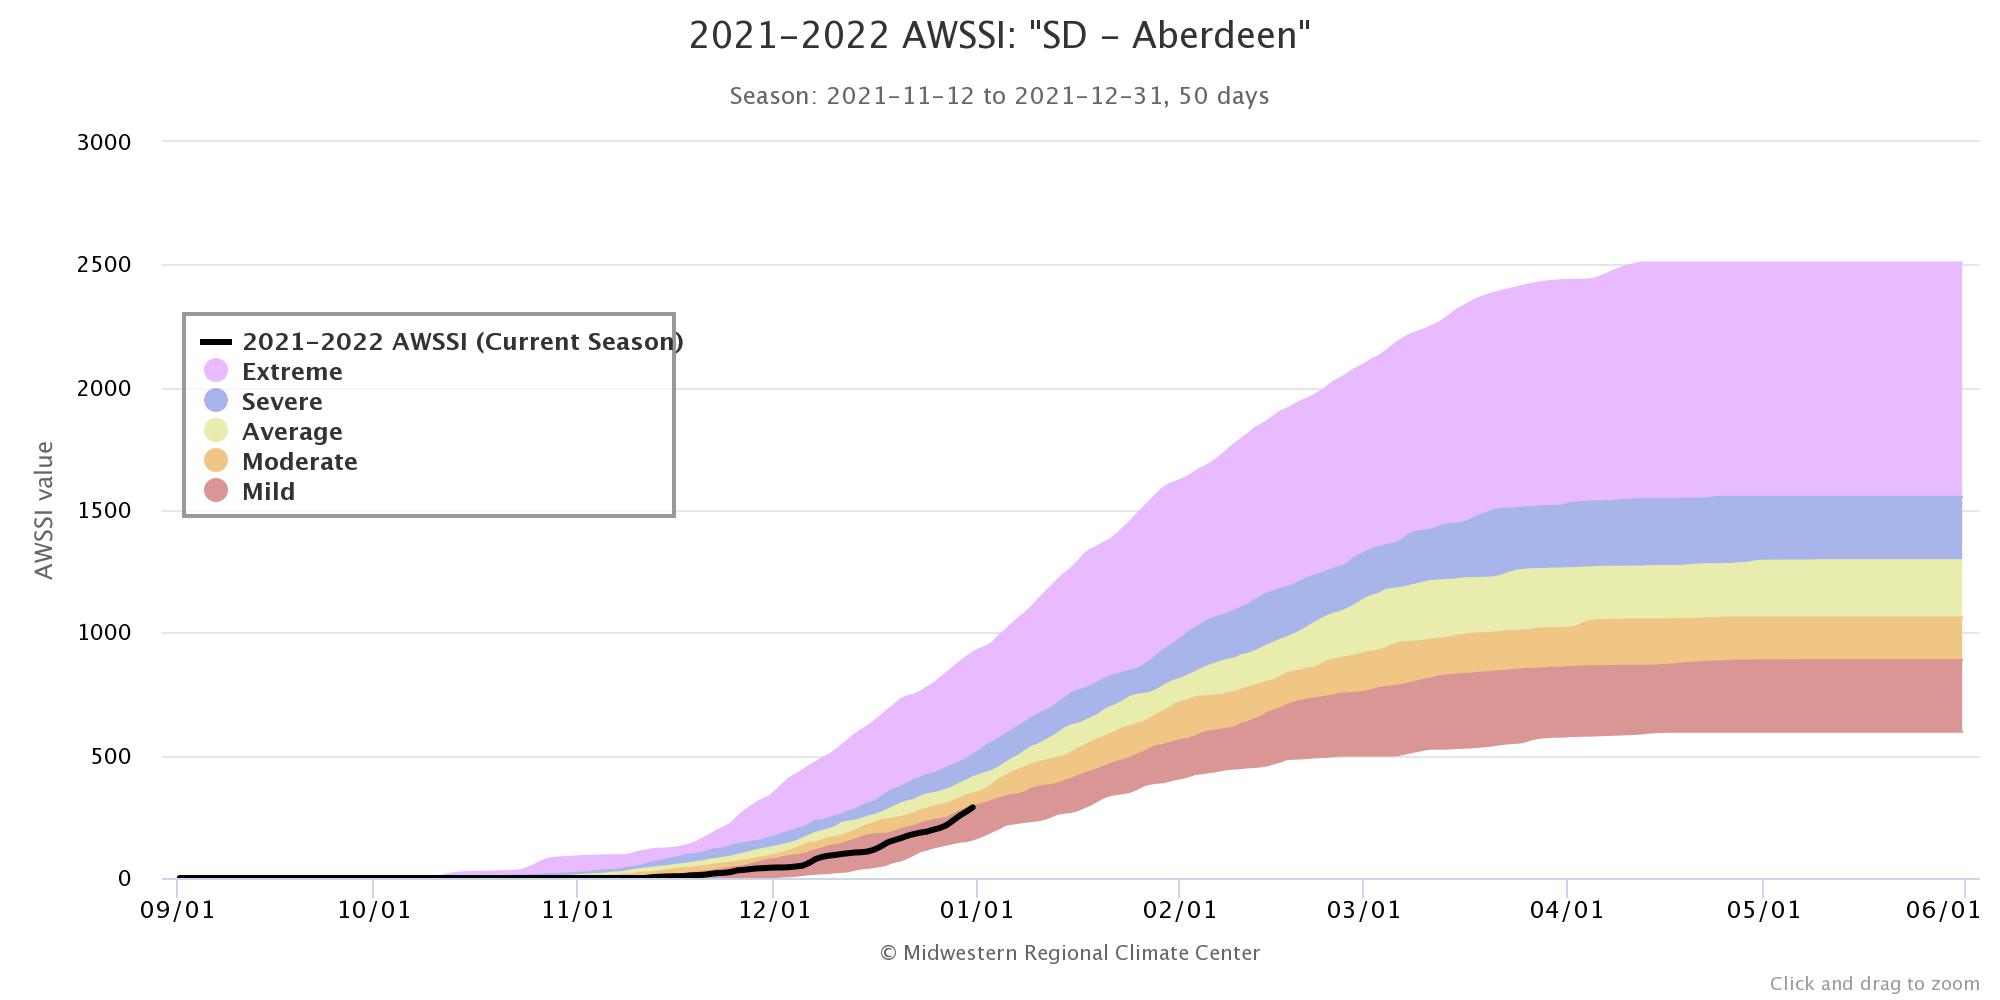
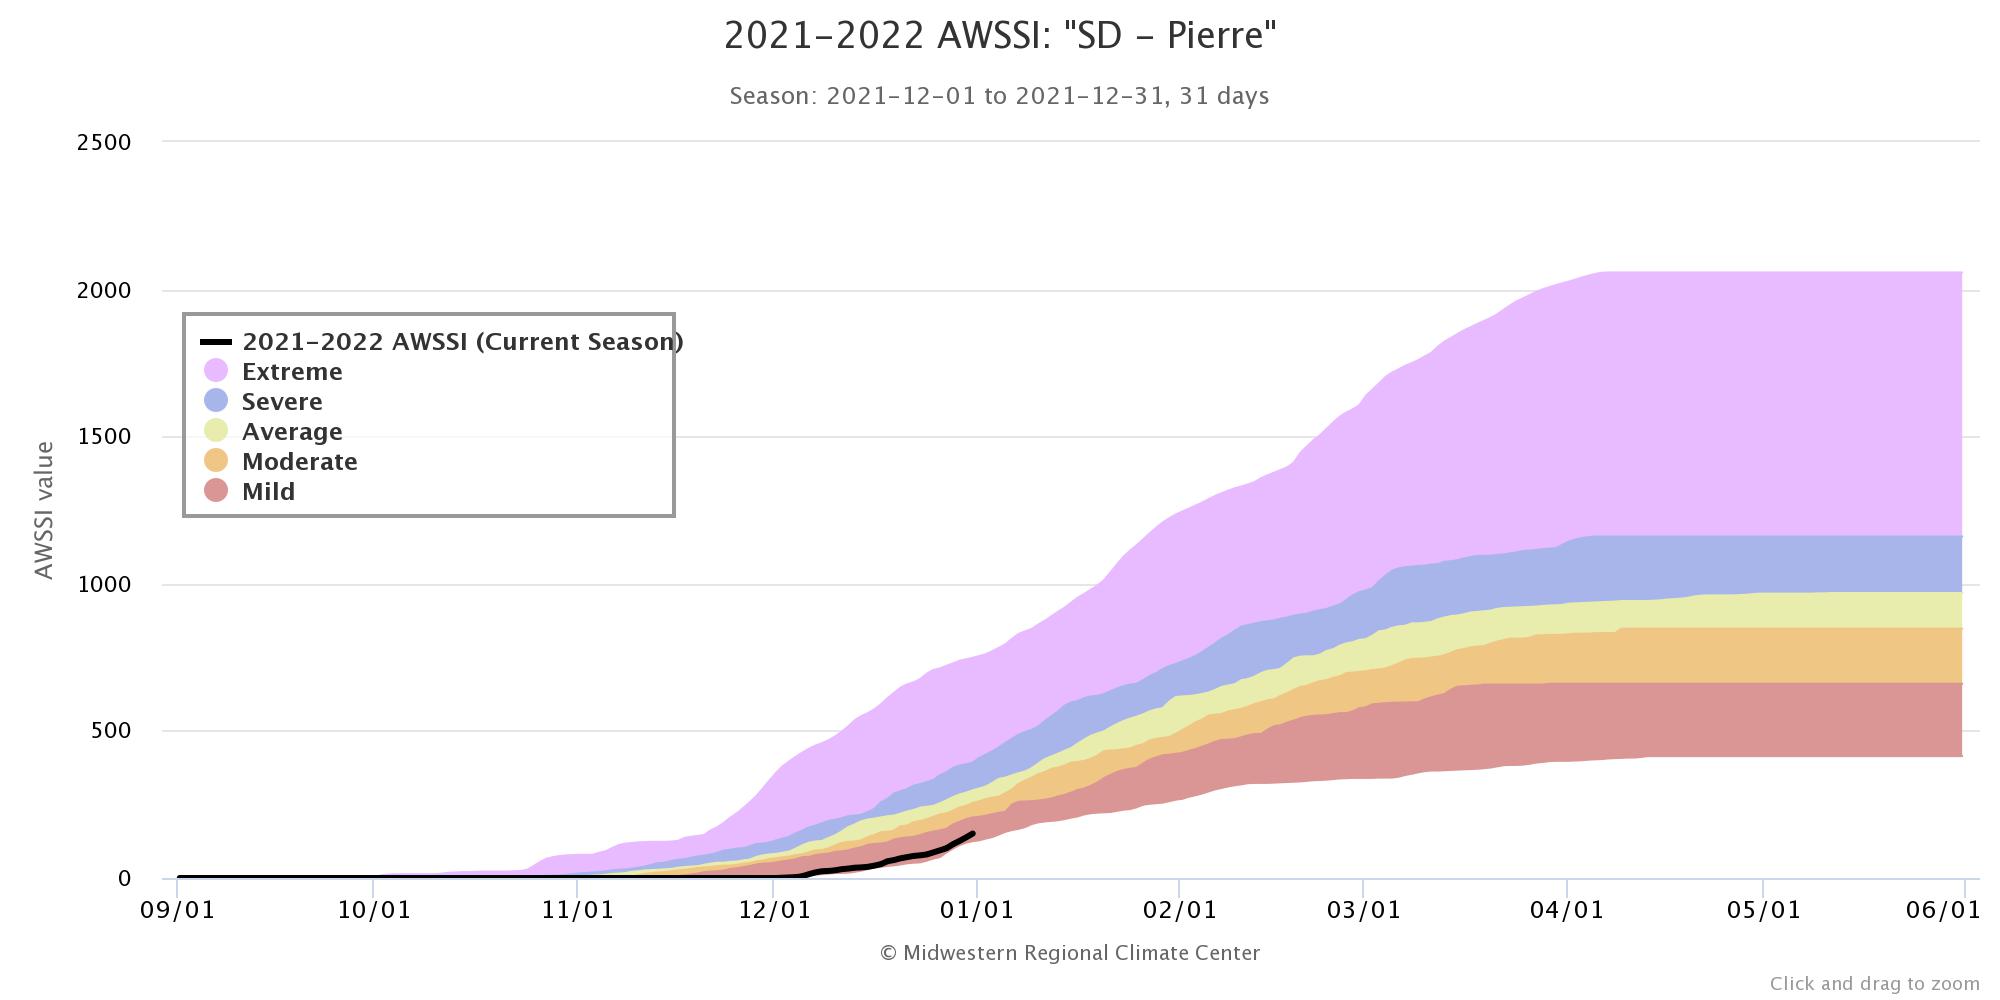
The Accumulated Winter Season Severity Index from the Midwestern Regional Climate Center depicts a top of the scale "Mild" start to the cold season (red dots), as of January 1st, 2022, across not only South Dakota, but much of the United States.
Below are specific AWSSI graphs for Aberdeen, Pierre and Watertown (in that order), showing the category for each location through time (solid line) compared to the range of what has been observed historically (background shading).


.
2021 on the Whole
2021 finished well above average temperature-wise across the board, by 1 to 4 degrees. In fact (after excluding years with excessive missing data), Watertown and Wheaton recorded their tied 9th warmest year on record, Aberdeen and Mobridge their 4th warmest year on record, Sisseton 2nd, and Timber Lake 1st. There were still periods of extreme cold however, particularly in February. The difference between the highest and lowest observed temperature was 120 F at Sisseton, 124 F at Wheaton, 126 F at Watertown, 129 F at Aberdeen, 132 F at Pierre, 133 F at Kennebec, and 134 F at Mobridge, and Timber Lake.
Yearly precipitation ranged quite a bit across the forecast area, from locally 6+ inches above normal in a pocket across far northeastern SD and west central MN (Sisseton recorded their 8th wettest year on record) to between 2 and 6+ inches below normal across much of the area along and west of the James River Valley. Severe to Extreme Drought peaked during the summer months for many across this area. Snowfall, however, was unanimously below normal this year (January 1st through December 31st, not seasonally from one year into another) from near normal to 30 inches or more. In fact (after excluding years with excessive missing data), Mobridge recorded their 5th least snowy year on record, and Timber Lake their least snowy year on record. For additional, more detailed information about 2021’s weather, see the bottom of the page.
|
2021 CLIMATE REVIEW |
||||
|
Temperature Data |
Aberdeen |
Sisseton |
Wheaton |
Watertown |
|
Warmest Temperature/Date |
104 / Jun 5 |
101 / Jun 5 |
98 / Jun 5 |
99 / Jun 5 |
|
Coldest Temperature/Date |
-25 / Feb 15 |
-19 / Feb 14 |
-26 / Feb 14 |
-27 / Feb 14 |
|
Average Yearly High/Departure from Normal |
60.4 / +4.1 |
59.1 / +4.4 |
56.2 / +1.7 |
56.5 / +3.2 |
|
Average Yearly Low/Departure from Normal |
35.0 / +3.2 |
36.8 / +3.5 |
36.4 / +2.5 |
35.0 / +2.3 |
|
Yearly Average/Departure from Normal |
47.7 / +3.6 |
48.0 / +4.0 |
46.3 / +2.1 |
45.8 / +2.8 |
|
Precipitation/Wind Data |
||||
|
Yearly Precipitation / Departure from Normal |
19.26 / -2.56 |
28.98 / +6.04 |
27.35 / +2.25 |
26.79 / +4.08 |
|
Yearly Snowfall / Departure from Normal |
25.6 / -17.1 |
30.6 / -5.7 |
25.7 / -17.2 |
30.7 / -10.4 |
|
Highest Wind Gust MPH / Date |
61 / Aug 7 |
72 / Mar 29 |
N/A |
75 / Aug 26 |
|
Temperature Data |
Pierre |
Kennebec |
Mobridge |
Timber Lake |
|
Warmest Temperature/Date |
108 / Jul 27 |
107/Jul 28,29 |
104 / July 3 |
103 / Jul 27 |
|
Coldest Temperature/Date |
-24 / Feb 14 |
-26 / Feb 15 |
-30 / Feb 14 |
-31 / Feb 14 |
|
Average Yearly High/Departure from Normal |
62.7 / +3.8 |
64.0 / +2.4 |
62.1 / +3.9 |
61.3 / +4.6 |
|
Average Yearly Low/Departure from Normal |
36.9 / +1.7 |
36.9 / +1.6 |
36.3 / +1.7 |
35.8 / +2.3 |
|
Yearly Average/Departure from Normal |
49.8 / +2.8 |
50.4 / +1.9 |
49.2 / +2.8 |
48.6 / +3.5 |
|
Precipitation/Wind Data |
||||
|
Yearly Precipitation / Departure from Normal |
14.13 / -6.07 |
21.30 / +0.61 |
15.91 / -2.08 |
15.87 / -3.32 |
|
Yearly Snowfall / Departure from Normal |
15.4 / -21.8 |
30.1 / -10.5 |
7.8 / -23.2 |
8.1 / -31.1 |
|
Highest Wind Gust MPH / Date |
67 / Nov 13 |
N/A |
68 / Jan 14 |
N/A |
2021 temperature departure from normal, from the Midwestern Regional Climate Center
2021 precipitation totals (left) and departures from normal (right), from the Midwestern Regional Climate Center
2021 snowfall totals (left) and departures from normal (right), from the Midwestern Regional Climate Center
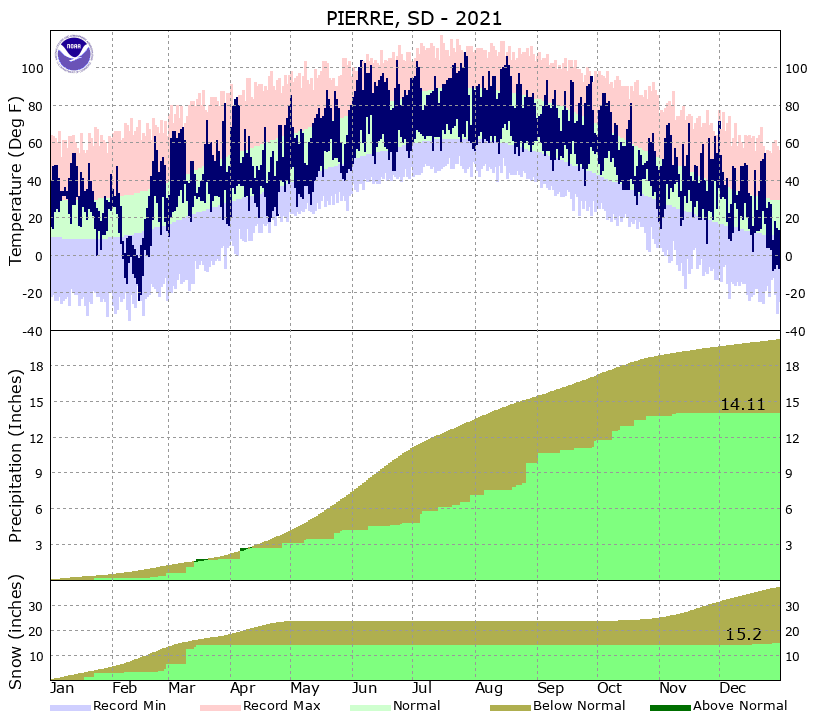
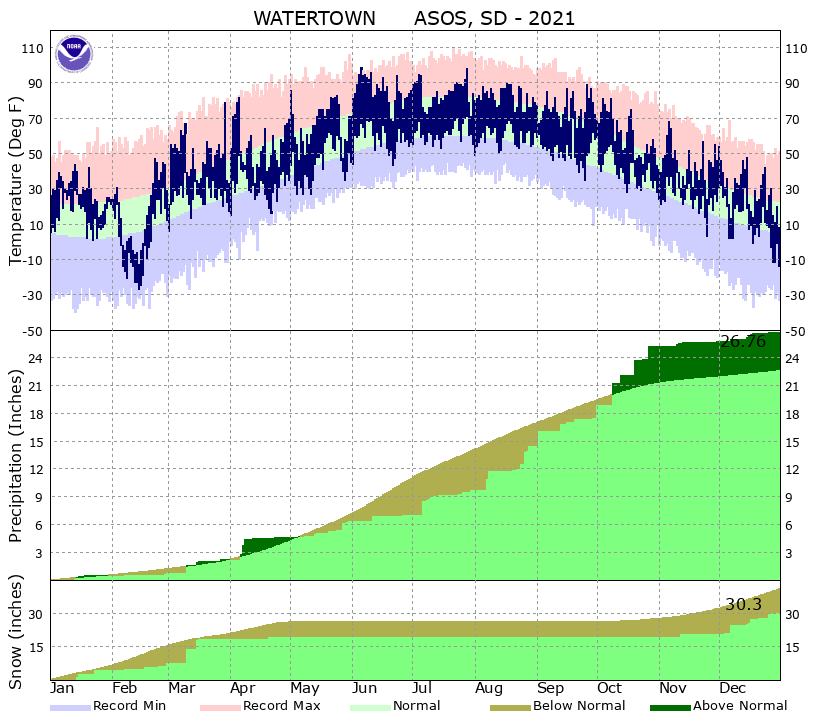
2021 temperature, precipitation and snow observations at Aberdeen, Pierre and Watertown:


For write-ups on some of the more notable events from 2021 (and before), visit
https://www.weather.gov/abr/events
Links to all the 2021 monthly summaries:
Jan: https://www.weather.gov/abr/January2021InReviewVeryMild
Feb: https://www.weather.gov/abr/February2021InReview
Mar: https://www.weather.gov/abr/March2021InReview
Apr: https://www.weather.gov/abr/April2021InReview
May: https://www.weather.gov/abr/May2021InReview
June: https://www.weather.gov/abr/June2021InReview
July: https://www.weather.gov/abr/July2021InReview
Aug: https://www.weather.gov/abr/August2021InReview
Sept: https://www.weather.gov/abr/September2021InReview
Oct: https://www.weather.gov/abr/October2021InReview
Nov: https://www.weather.gov/abr/November2021InReview
.
 |
Media use of NWS Web News Stories is encouraged! Please acknowledge the NWS as the source of any news information accessed from this site. |
 |