Bitter cold temperatures and dangerous wind chills will persist from Florida to the Northeast through Monday. Daily record low temperatures are forecast across the Southeast and Florida, with some all-time February low temperature records possible across Florida. An Alberta clipper will spread wintry precipitation across the Northern Plains today and into the upper Great Lakes into tonight. Read More >
A persistent pattern of weak winds and sufficient low-level moisture from the snow pack led to extended periods of fog this January, especially across/near the Prairie Coteau. How much fog was observed, and was it an unusual amount? Below are fog observations from our ASOS weather stations in Watertown, Aberdeen and Pierre for the month of January from the 1990s to 2023, both in terms total number of hours (grey) and days (teal). *Note: Fog is reported by the ASOS when visibility is 1/2 mile or less (mist or light fog, not represented in the charts below, is reported when the visibility is between 1/2 and 7 miles).
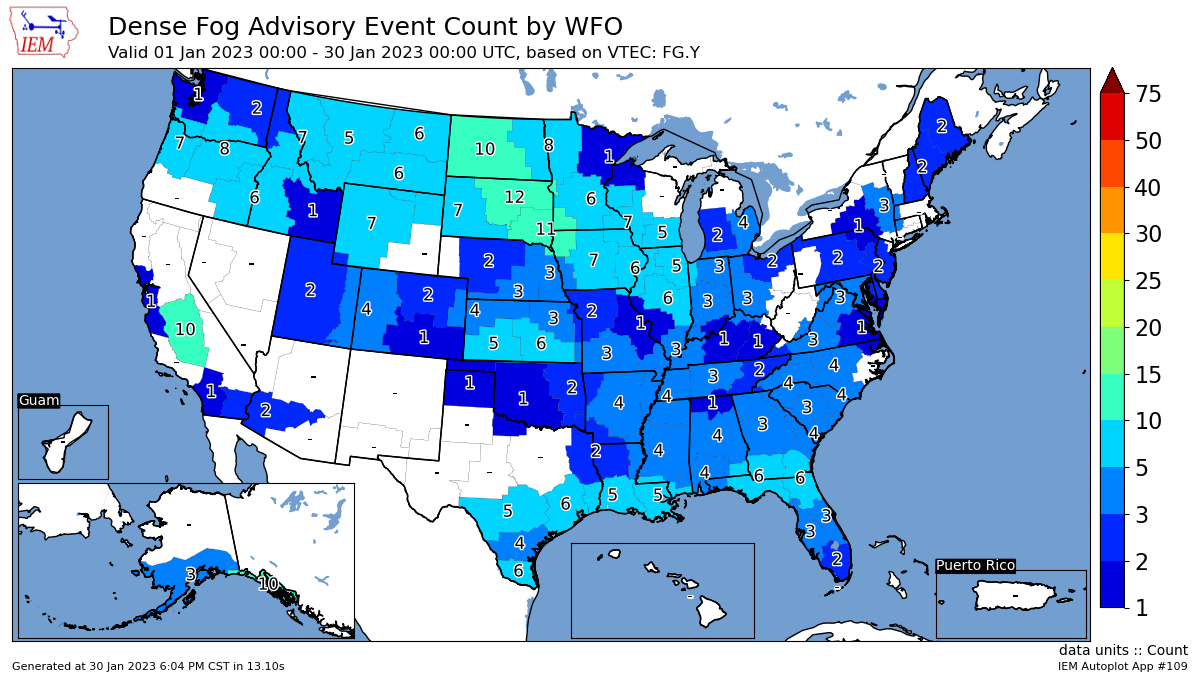
As you can see, Watertown observed their 2nd foggiest January on record in 2023 since the late 1990s in terms of total number of hours of fog, and their foggiest in terms of total number of days (different observation methods before the late 1990s makes it more difficult to compare apples to apples). 2023 also featured the foggiest January since 2010 in Aberdeen. If you count all the days that the ASOS reported fog and mist/light fog this January, you'd get 21 for Aberdeen and Pierre, and 26 for Watertown. Additionally, our office issued more Dense Fog Advisories (for 1/4 mile or less visibility) this January than any other National Weather Service office in the country! Graphic below from the Iowa Environmental Mesonet.
What's the average for number of hours (grey) and days (teal) of fog as reported by the ASOS for January and the other months of the year? Find out below, for Watertown, Aberdeen and Pierre. December through March are typically the foggiest months of the year.
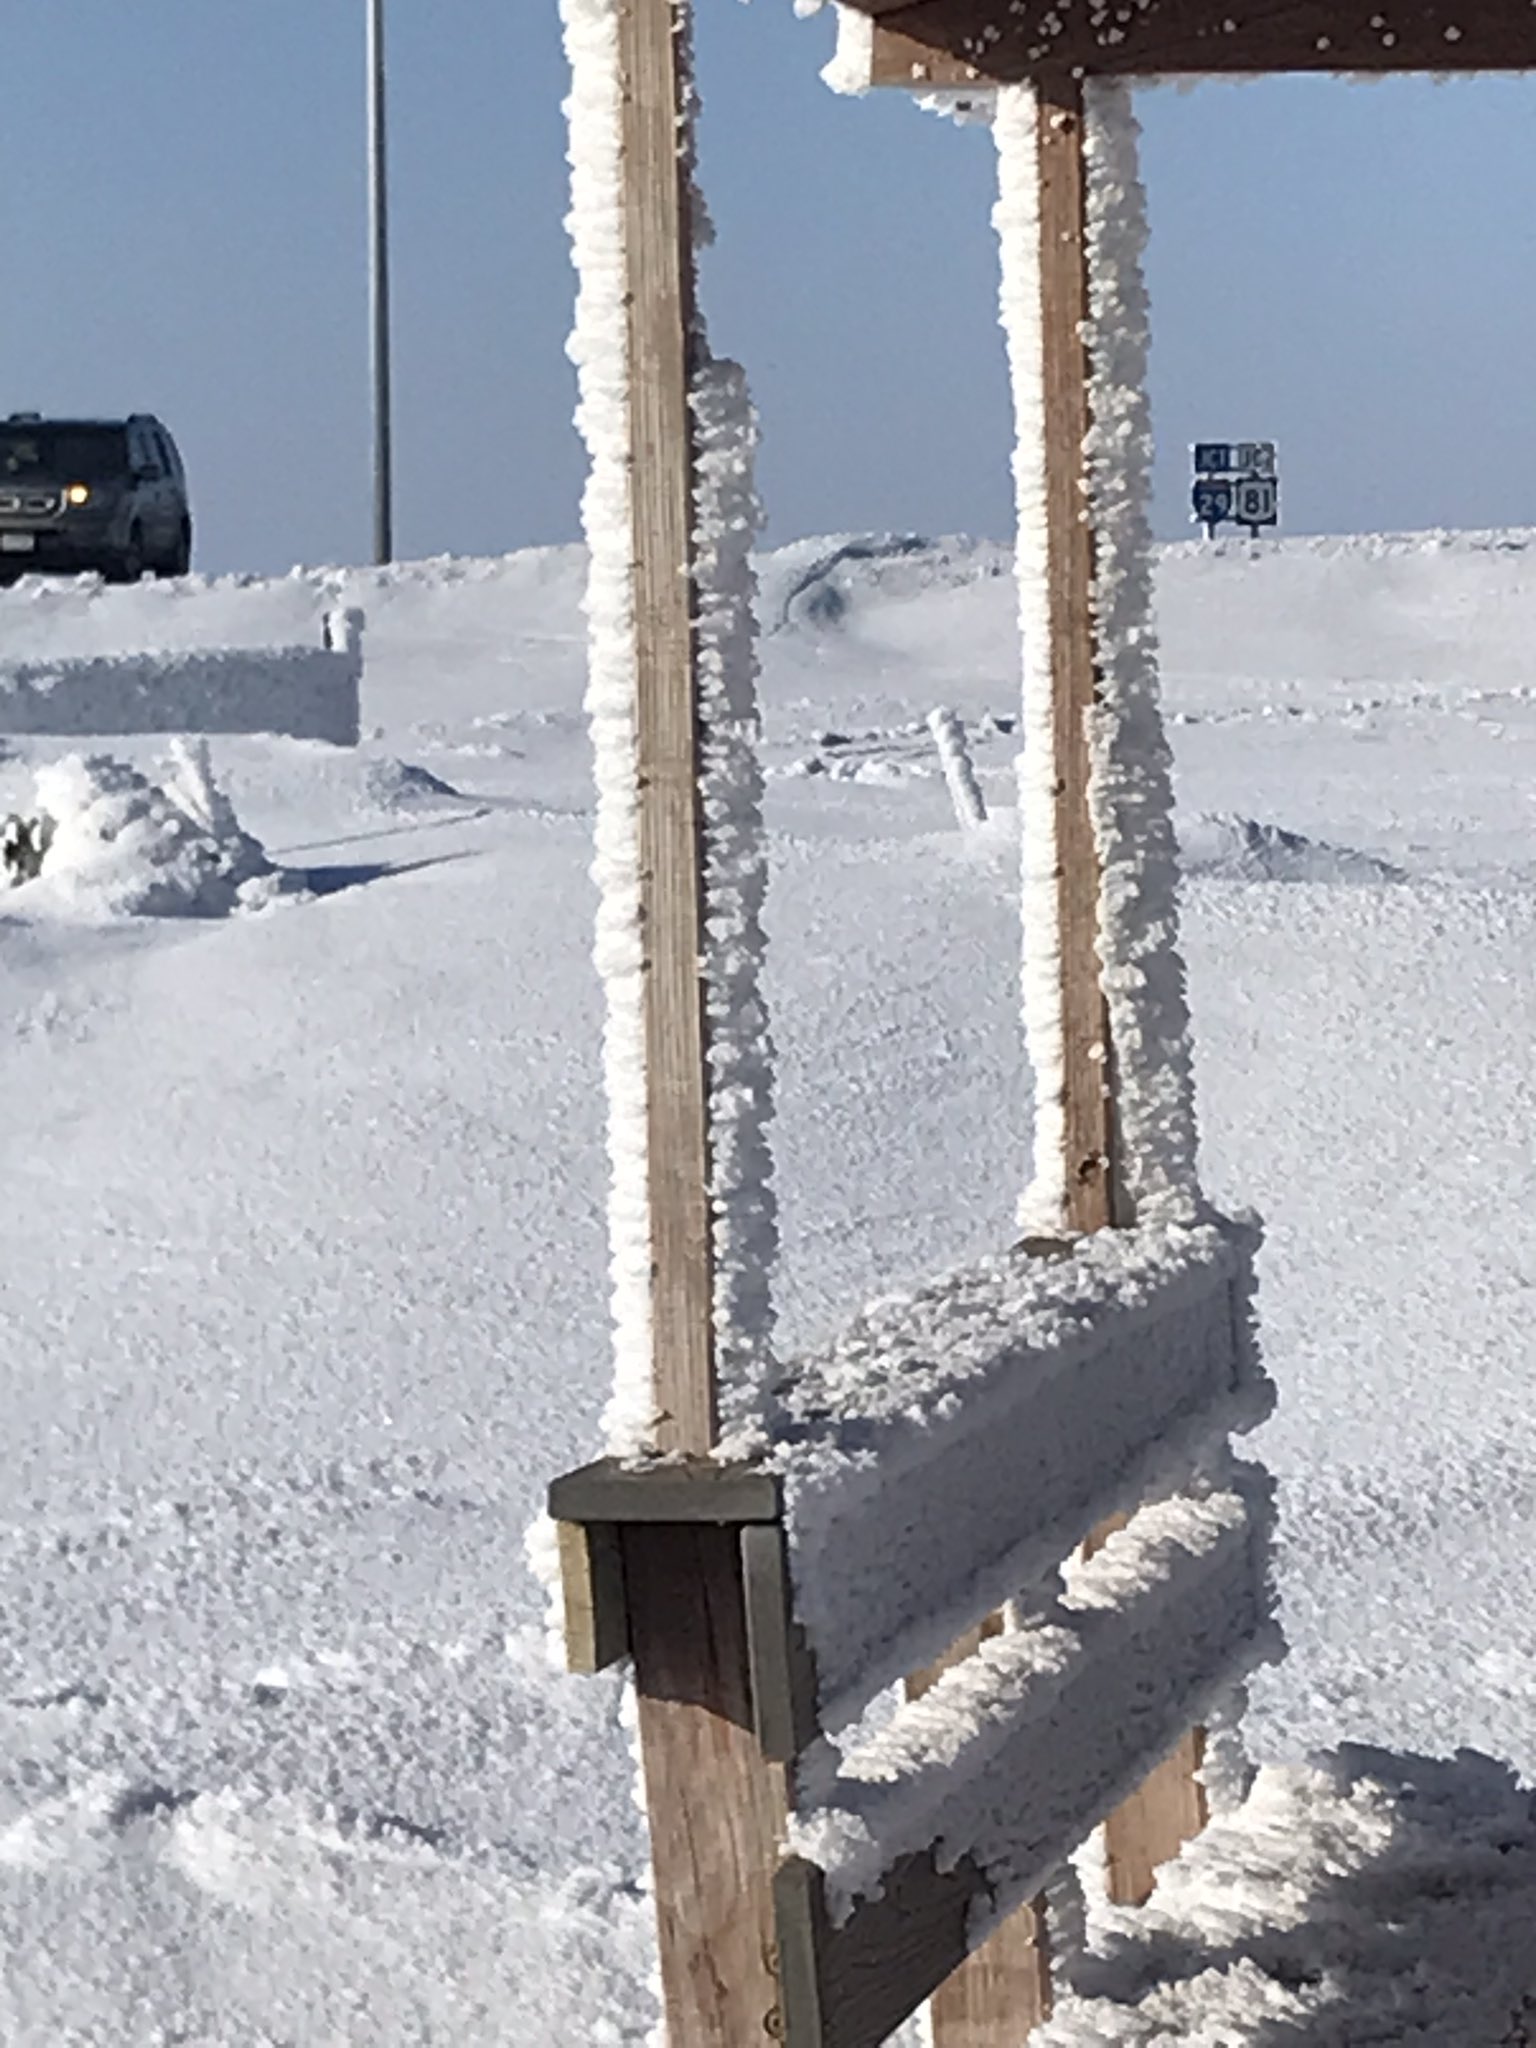
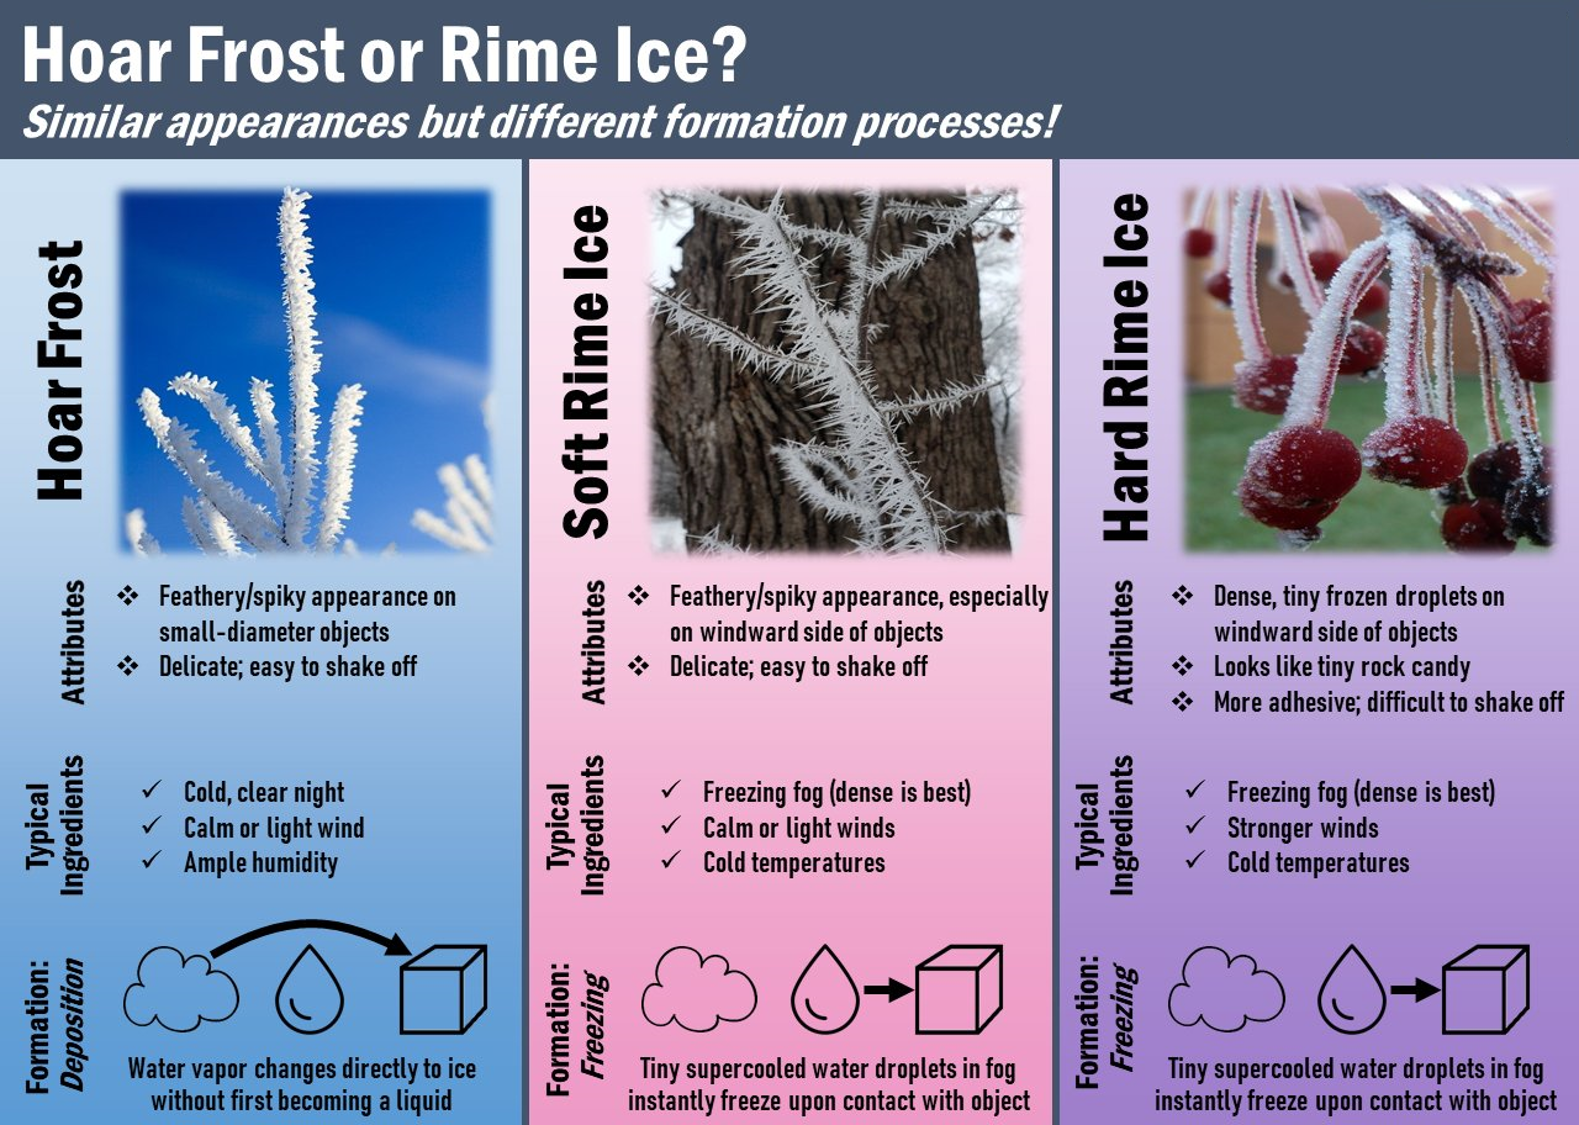
All of this fog led to a build-up of rime ice on outdoor surfaces. These photos of thick rime ice were taken on January 21st, 2023 in Summit by a NWS employee.
.jpg)
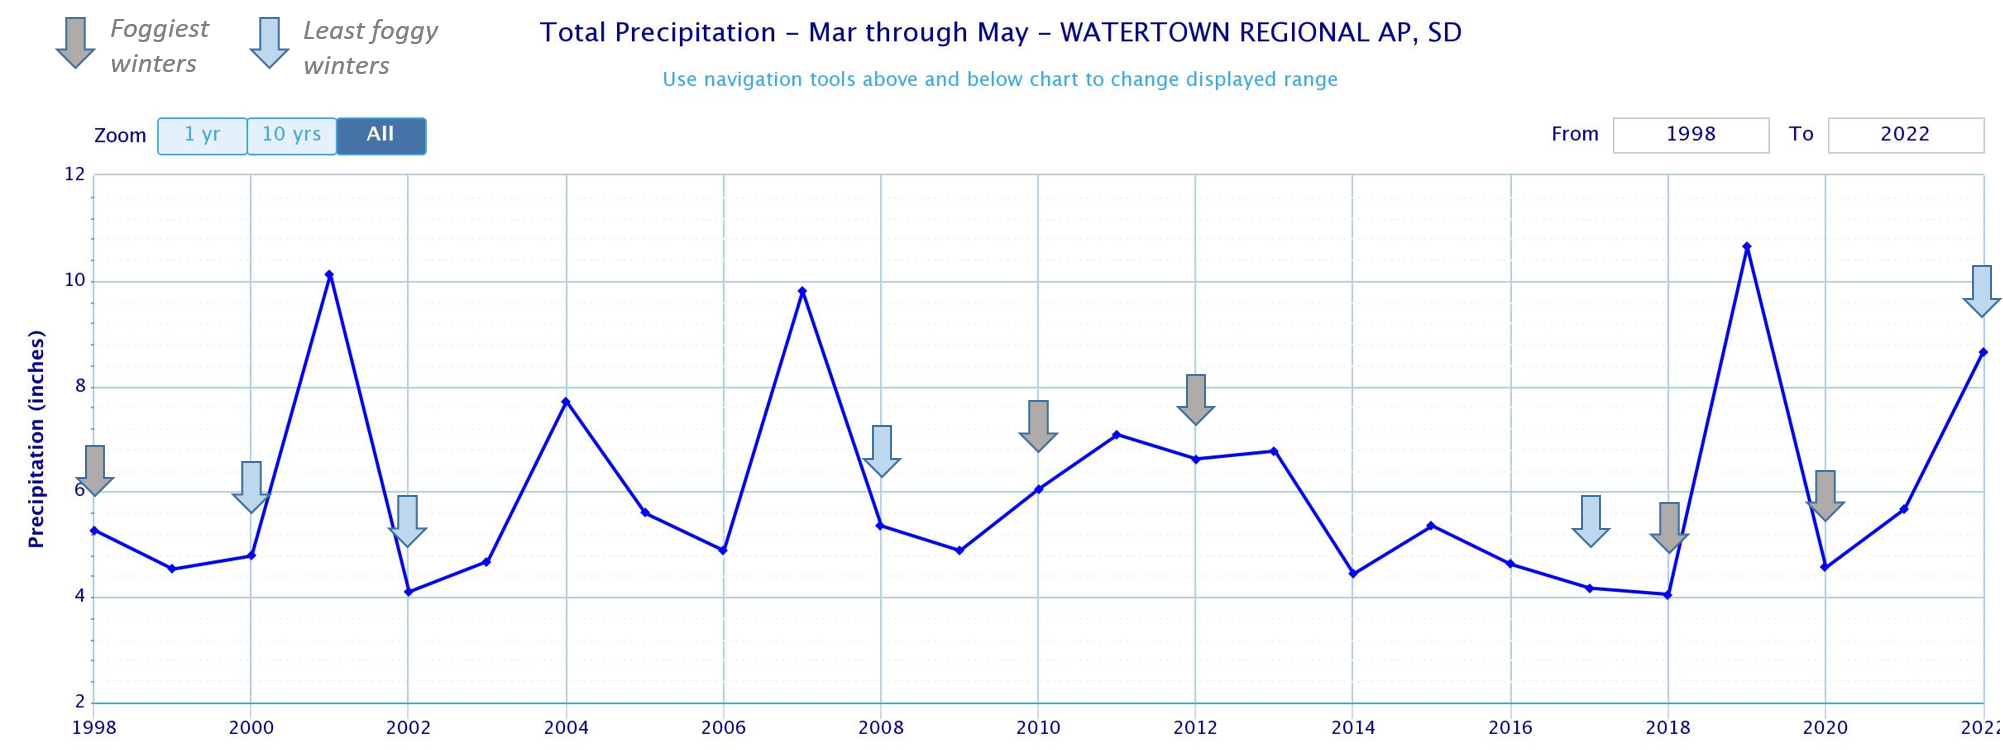
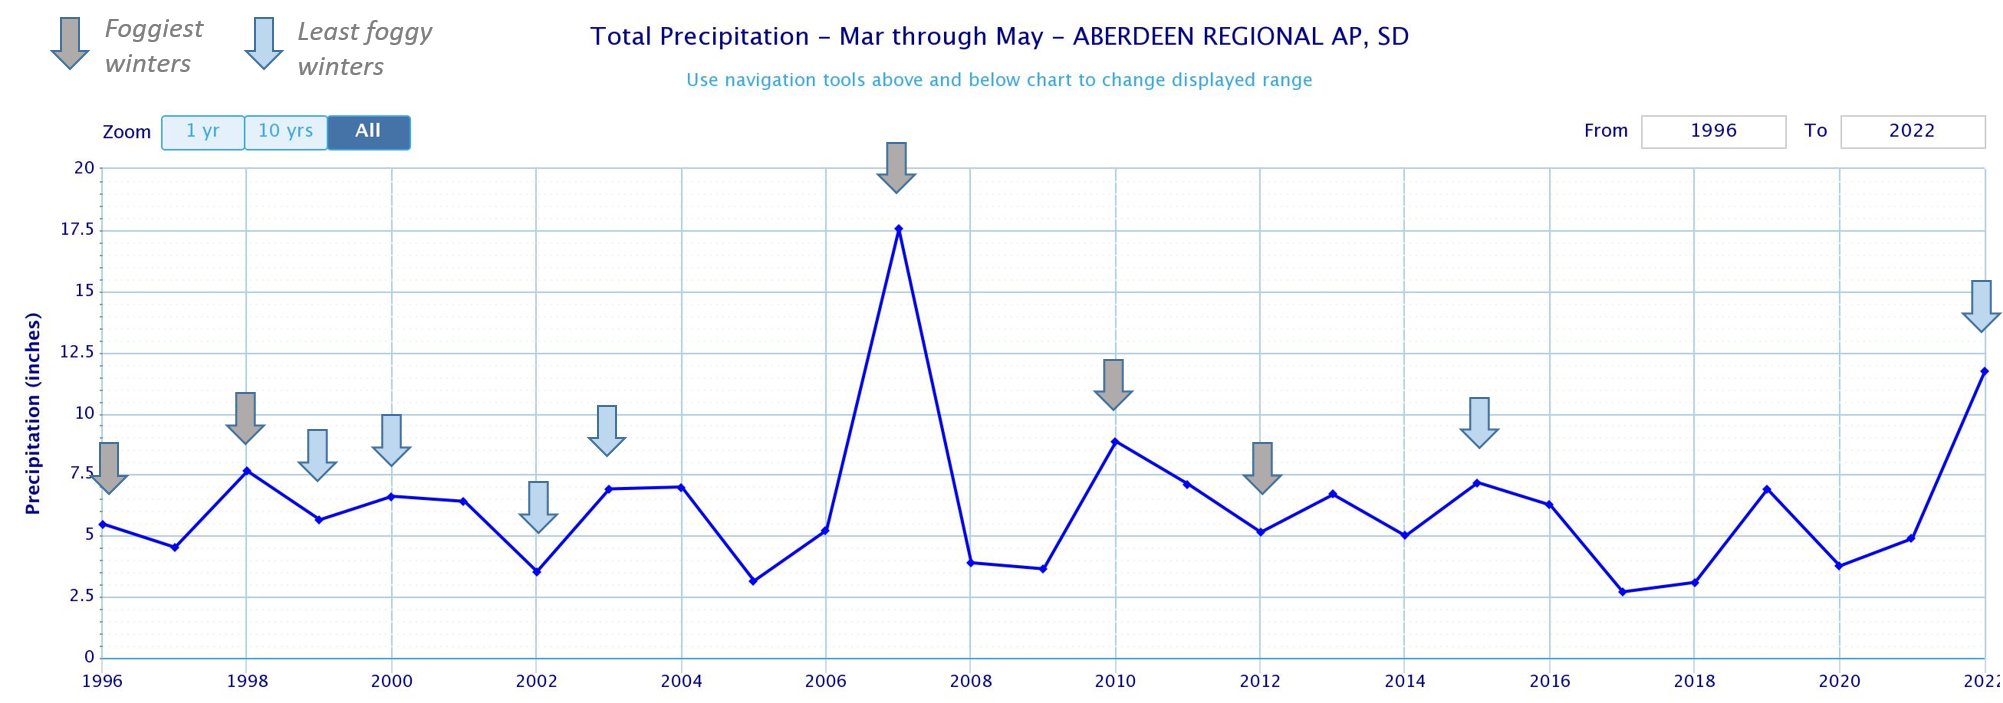
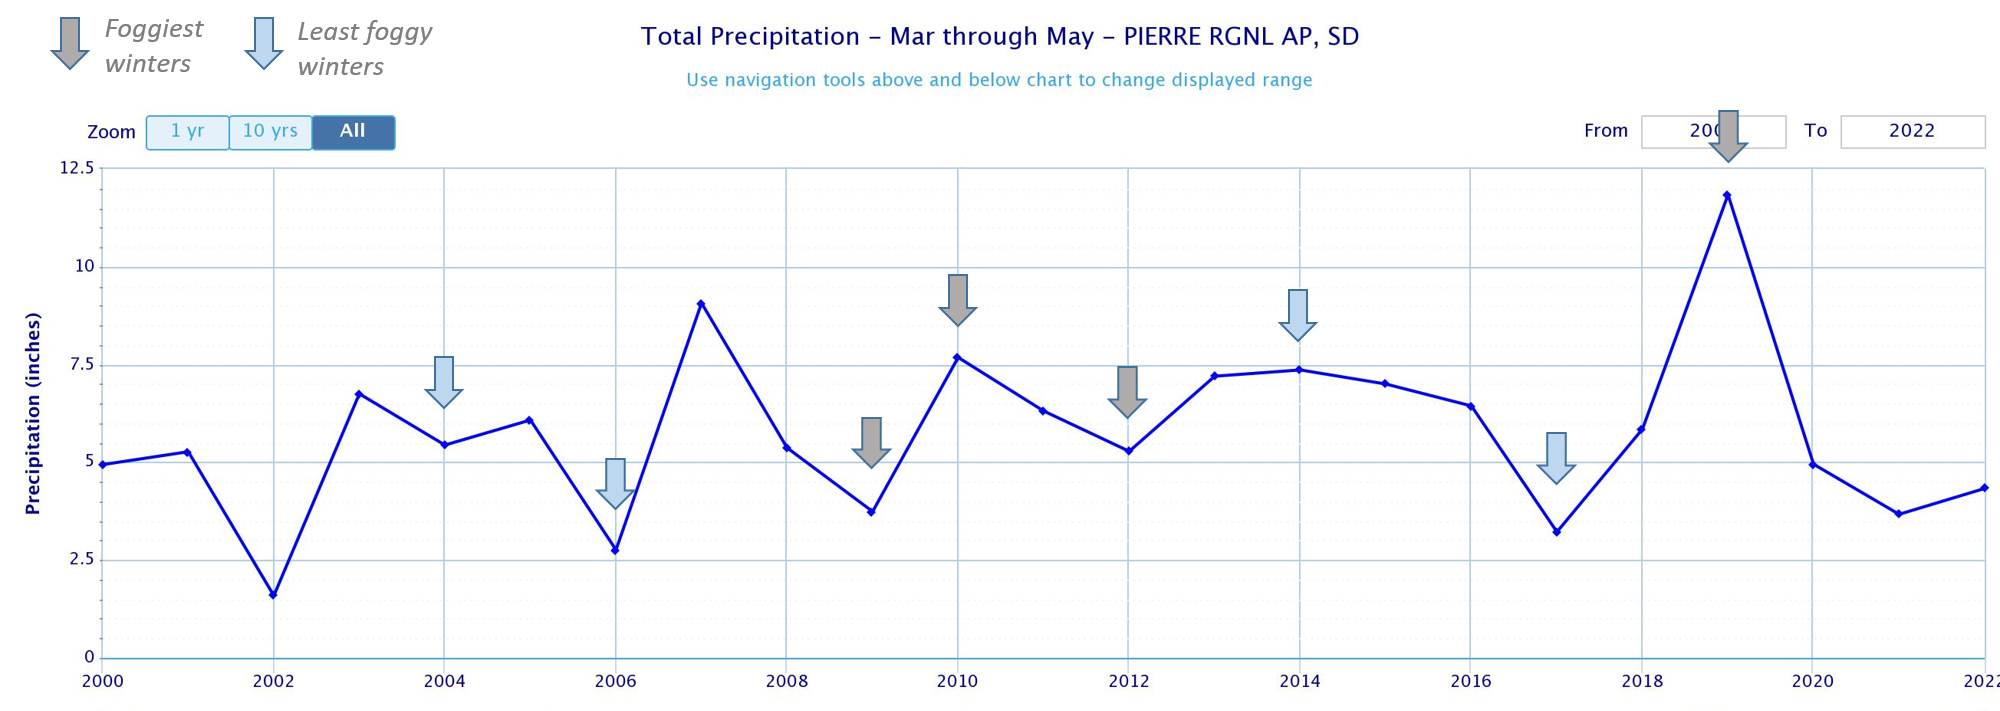
Lastly, there's an idea out there that a bunch of fog during the winter (Dec/Jan/Feb) leads to a bunch of precipitation ~90 days later during the following spring (Mar/Apr/May). Does it? Below are graphs of total spring moisture in inches each year for Watertown, Aberdeen and Pierre. Overlaid are arrows showing which springs were followed by the foggiest (grey arrows) and least foggy (blue arrows) winters in terms of total hours of fog. As you can see, sometimes a foggy winter leads to a wet spring, but sometimes it doesn't. Similarly, sometimes a winter with very little fog leads to a wet spring, but sometimes it doesn't. Overall, the amount of fog in winter does not appear to be a good predictor of total moisture in spring.
