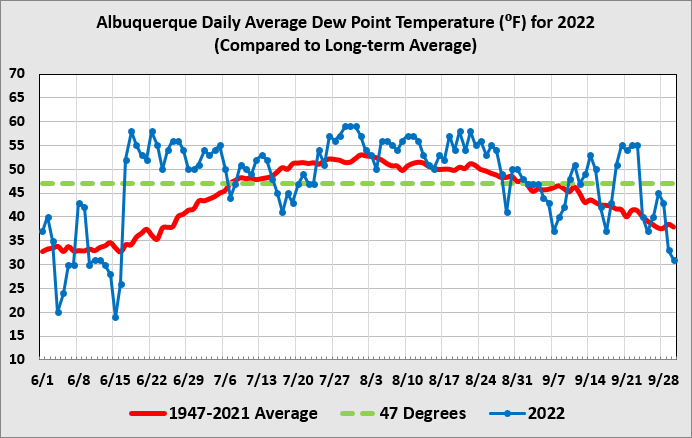
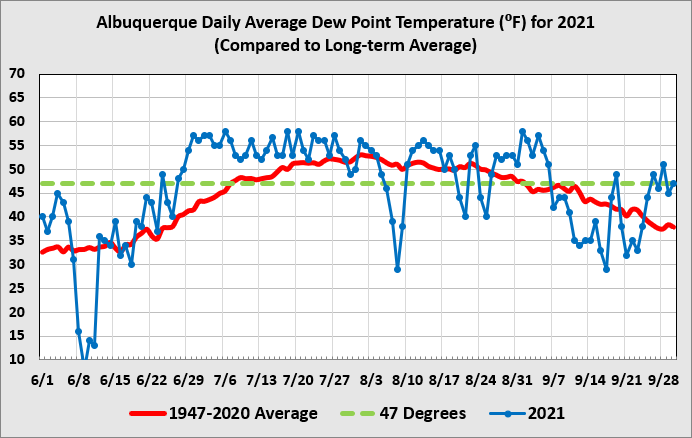
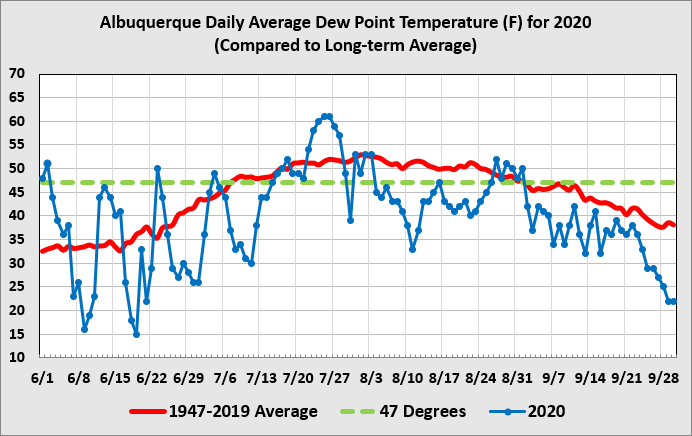
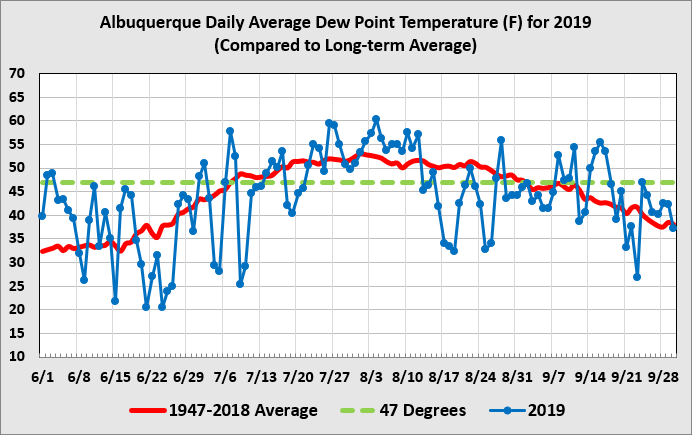
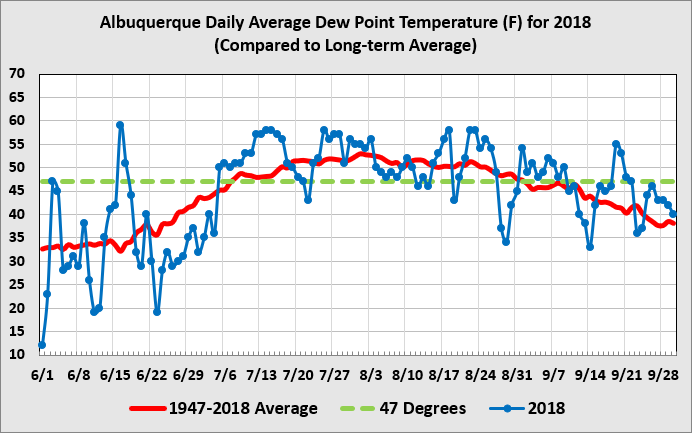
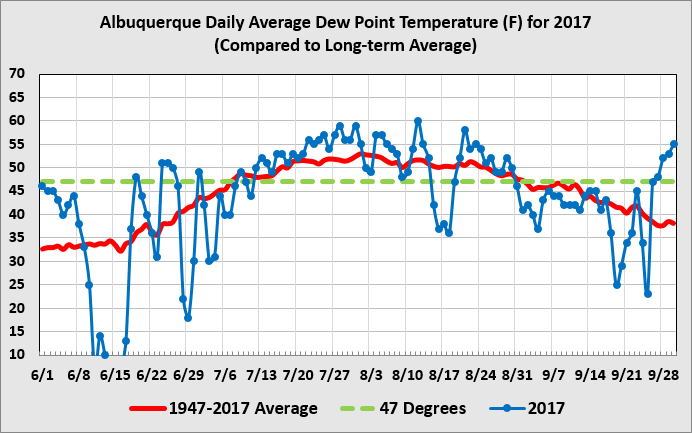
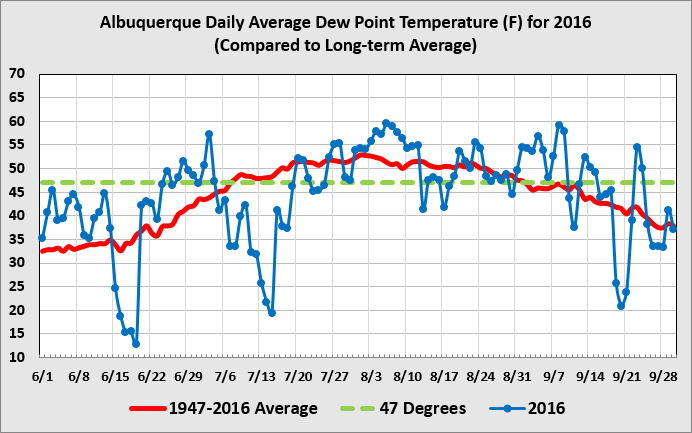
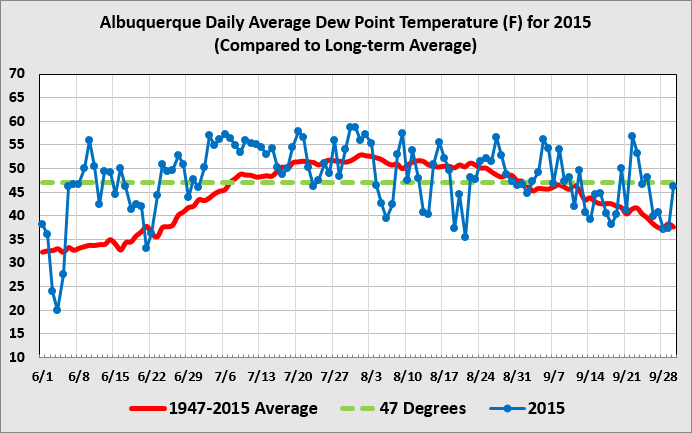
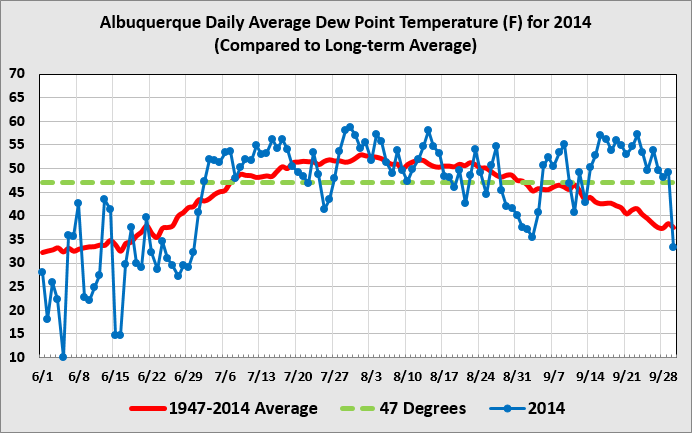
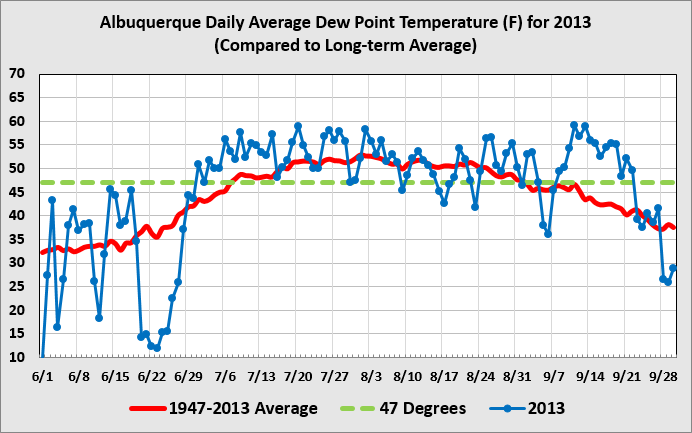
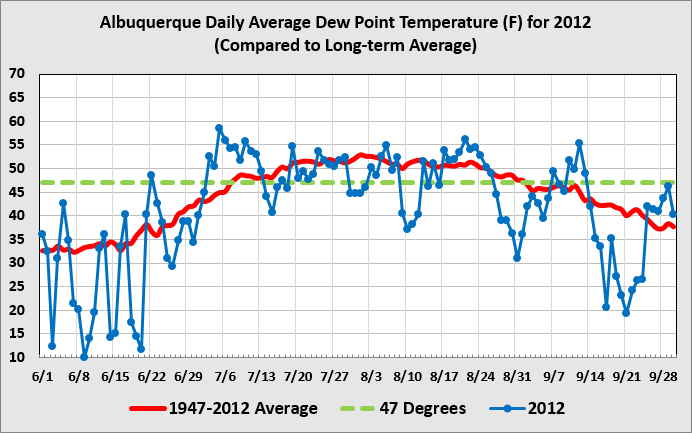
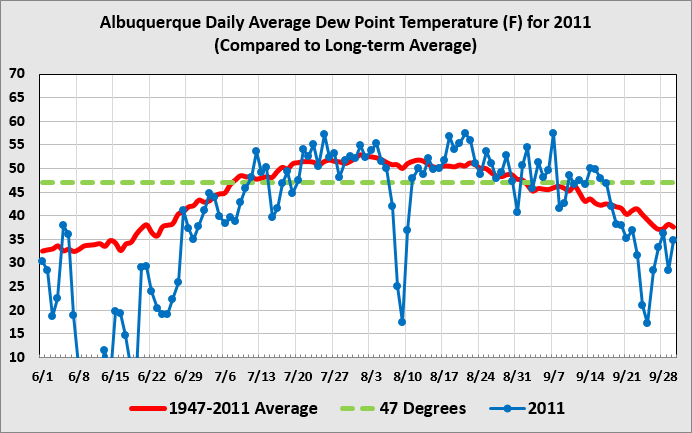
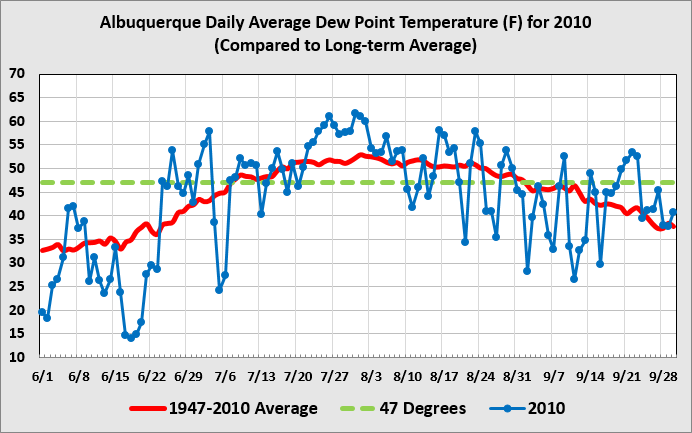
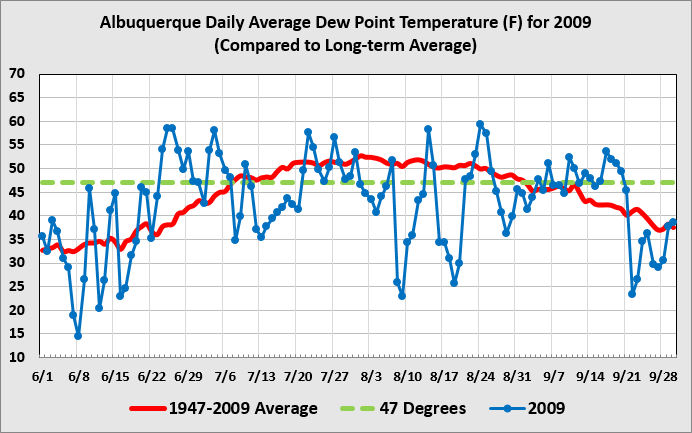
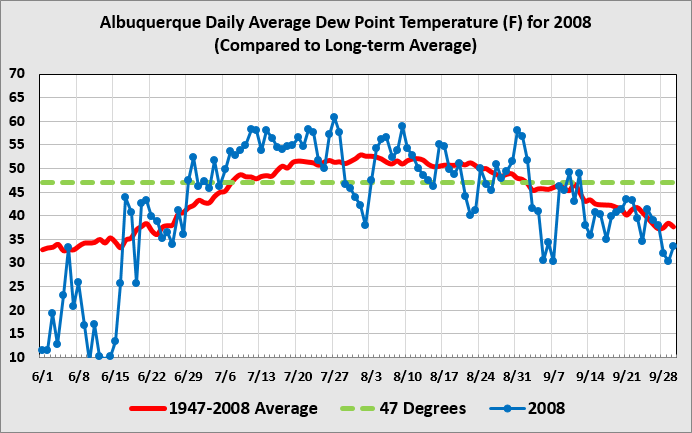
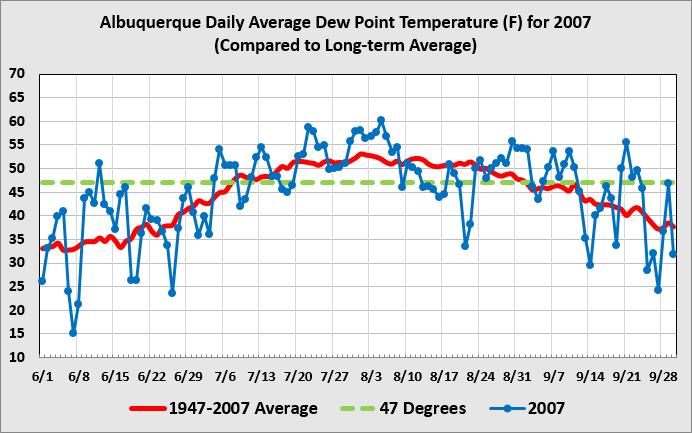
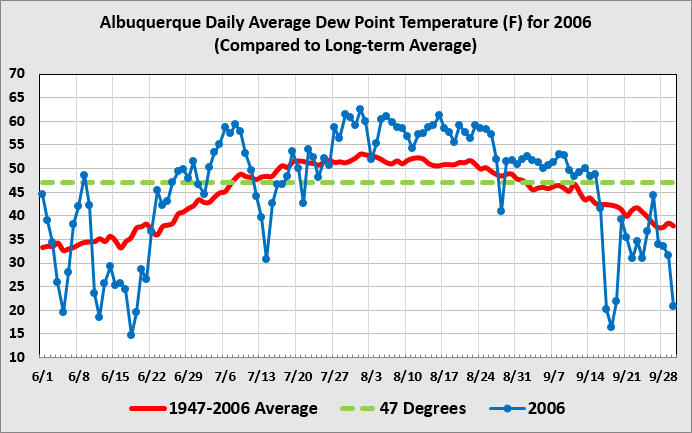
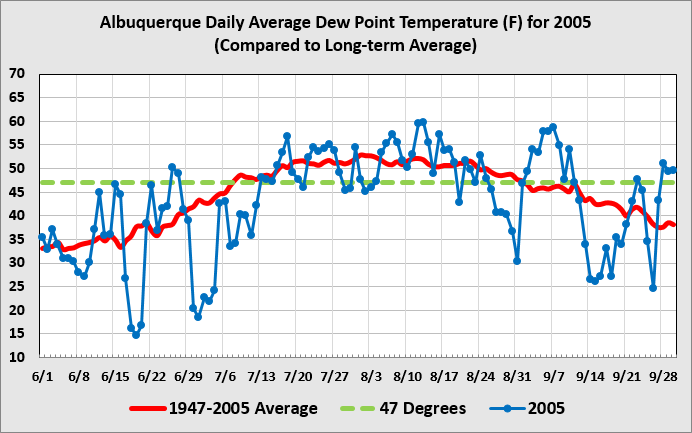
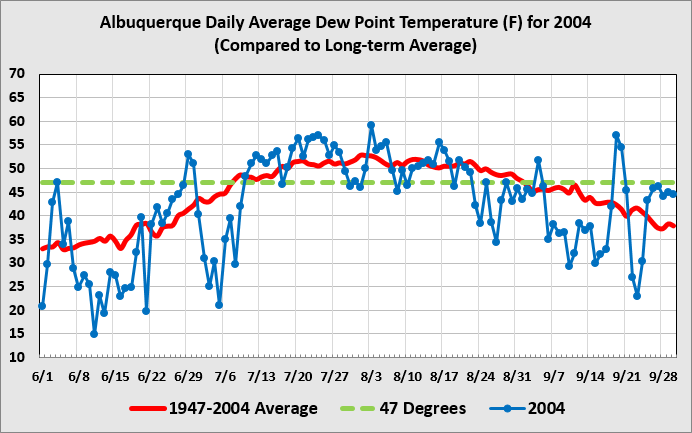
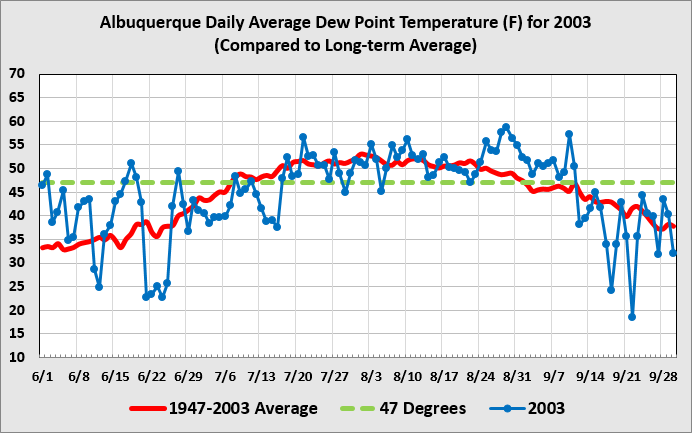
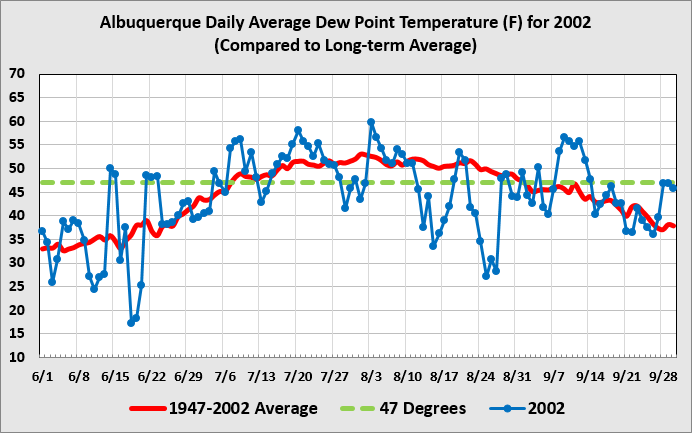
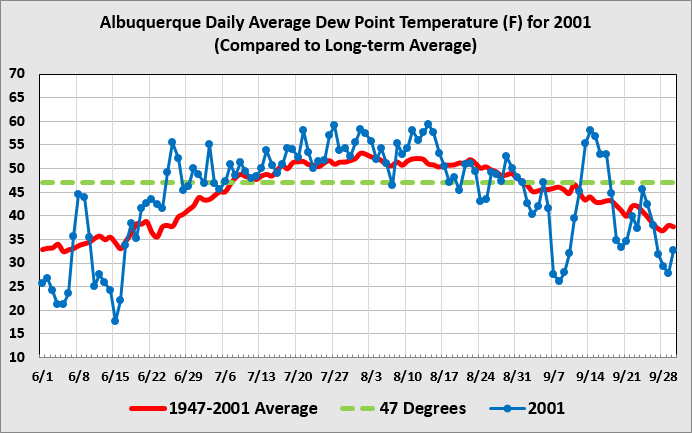
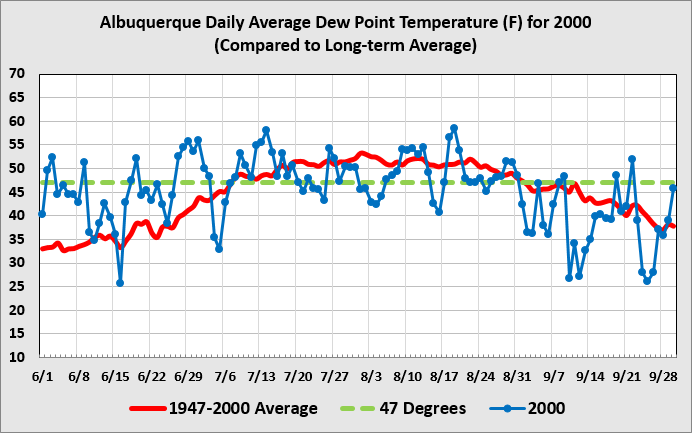
The evolution of the North American Monsoon from Mexico to the United States is noted by the northward progression of convective precipitation from southern Mexico in early June that spreads northward into the southwest U.S. by early July. The onset of the moist phase of the monsoon in New Mexico varies, but average onset occurs around July 3 for the southwest corner of the state and around July 9 for the central Rio Grande valley, including Albuquerque. Although a large-scale circulation change supports the wet phase of the monsoon with an increase in atmospheric moisture, once onset occurs there is considerable variability in the day-to-day precipitation. Active periods of precipitation are known as monsoon "bursts", and are separated by drier, less active monsoon "breaks". Dewpoint temperature is one of many parameters used to monitor moisture surges of the North American Monsoon across the southwest U.S. The charts below show how much variability can occur from year-to-year at the Albuquerque Sunport.
|
Statistics
|
| Data Summary Table: |
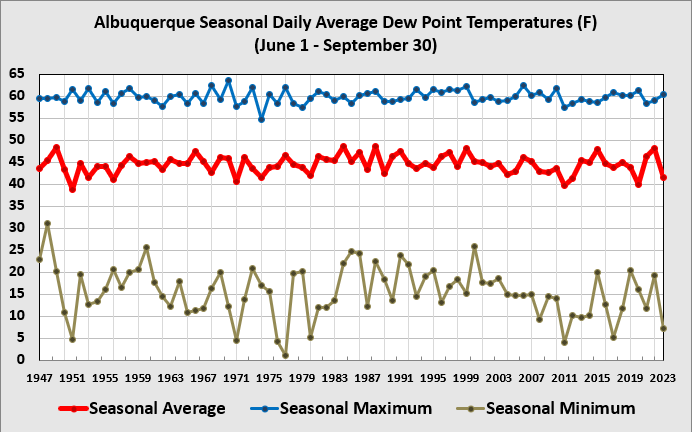
Albuquerque Dewpoint Temperature Statistics
June 1 - September 30 (1947-2023) |
Value |
Year |
| Seasonal Average Dew Point |
44.5° |
-- |
| Maximum Seasonal Average Dew Point |
48.6° |
1984, 1988 |
| Minimum Seasonal Average Dew Point |
38.8° |
1951 |
| Highest Daily Average Dew Point |
63.6° |
8/4/1970 |
| Lowest Daily Average Dew Point |
1.1° |
6/16/1977 |
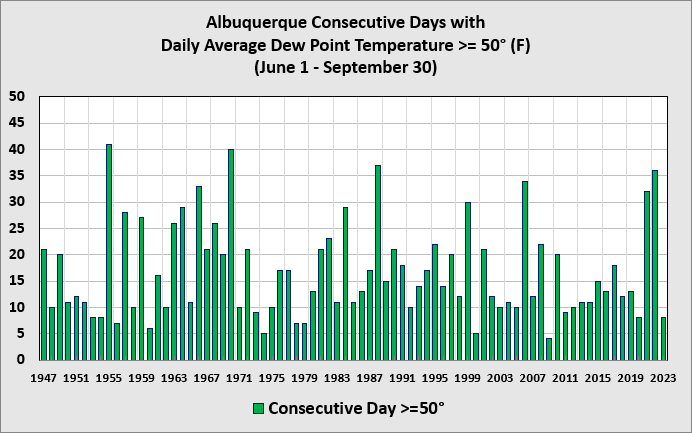
| Greatest Consecutive Days >= 50° |
41 |
1955 |
| Least Consecutive Days >= 50° |
4 |
2009 |
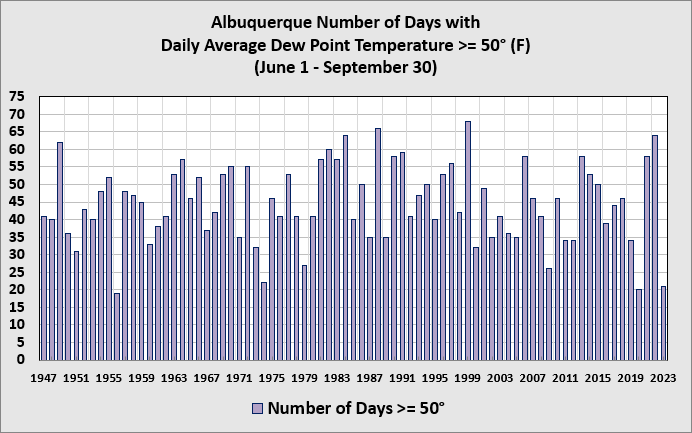
| Greatest Number of Days >= 50° |
68 |
1999 |
| Least Number of Days >= 50° |
19 |
1956 |
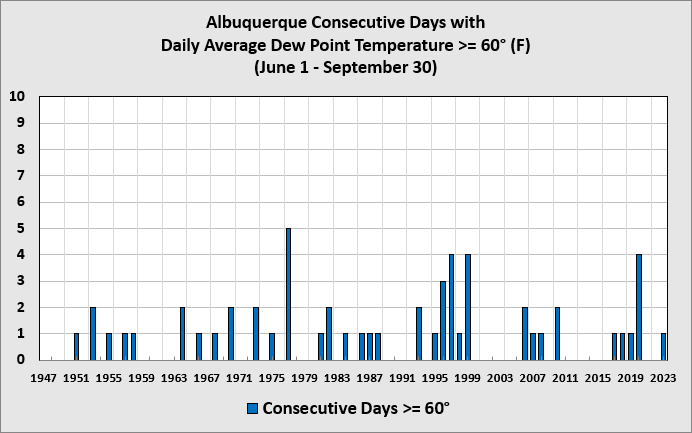
| Greatest Consecutive Days >= 60° |
5 |
1977 |
| Greatest Number of Days >= 60° |
9 |
1977 |
|
| |
| Seasonal Average, Seasonal Maximum, and Seasonal Minimum: |
|
| Consecutive Days with Daily Average Dew Point Temperature >=50°: |
|
| Consecutive Days with Daily Average Dew Point Temperature >=60°: |
|
| Number of Days with Daily Average Dew Point Temperature >=50°: |
|
| Number of Days with Daily Average Dew Point Temperature >=60°: |
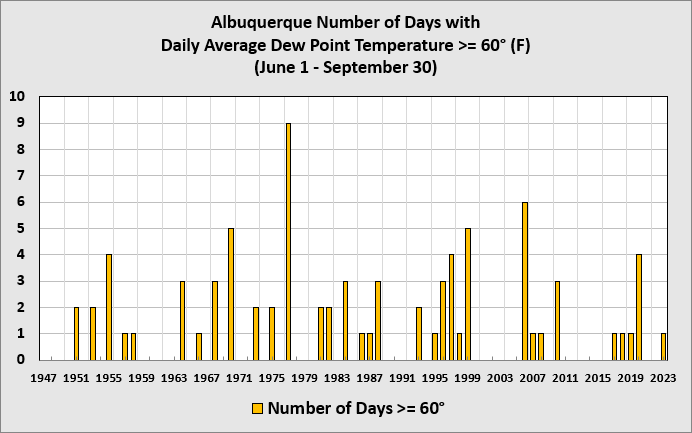
|
Annual Archives
|
| 2025: |
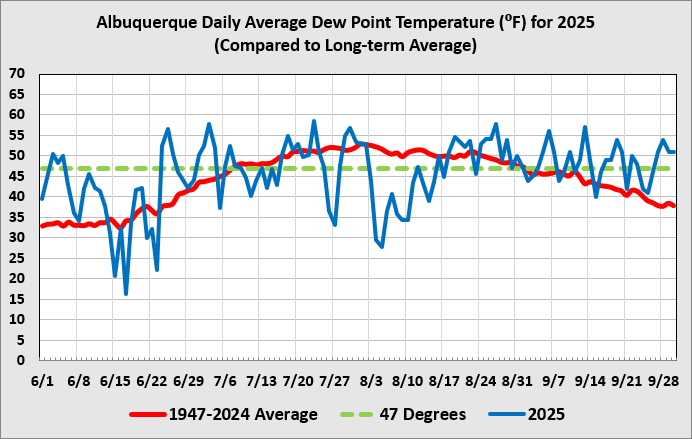 |
| 2024: |
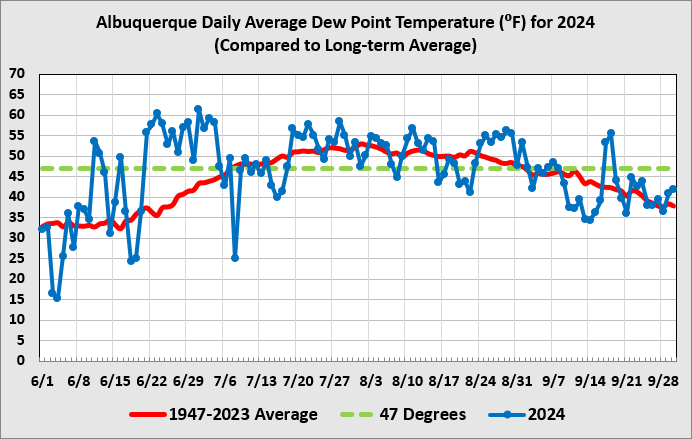 |
| 2023: |
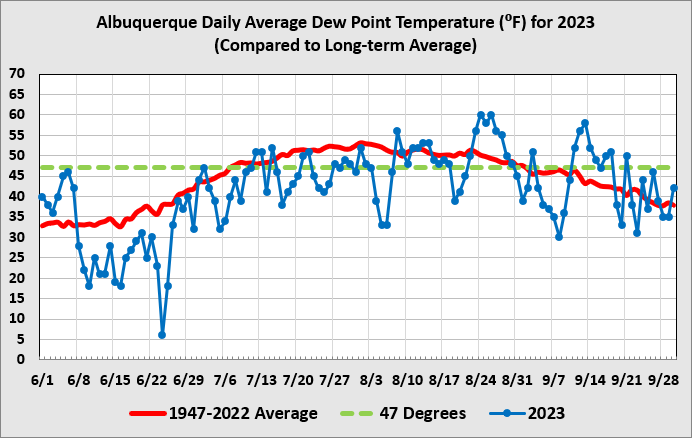 |
| 2022: |
 |
| 2021: |
 |
| 2020: |
|
|
| 2019: |
|
|
| 2018: |
|
|
| 2017: |
|
|
| 2016: |
|
|
| 2015: |
|
|
| 2014: |
|
|
| 2013: |
|
|
| 2012: |
|
|
| 2011: |
|
|
| 2010: |
|
|
| 2009: |
|
|
| 2008: |
|
|
| 2007: |
|
|
| 2006: |
|
|
| 2005: |
|
|
| 2004: |
|
|
| 2003: |
|
|
| 2002: |
|
|
| 2001: |
|
|
| 2000: |
|
|


