Network Equipment
Cooperative observers use a variety of equipment. The type used will depend on what services are needed at a particular station. Most observers report at least 24-hour precipitation; some will also report snowfall, high and low temperature. Fewer observers report evaporation measurements, river stages, soil temperatures, or solar readings.
Precipitation Gauges
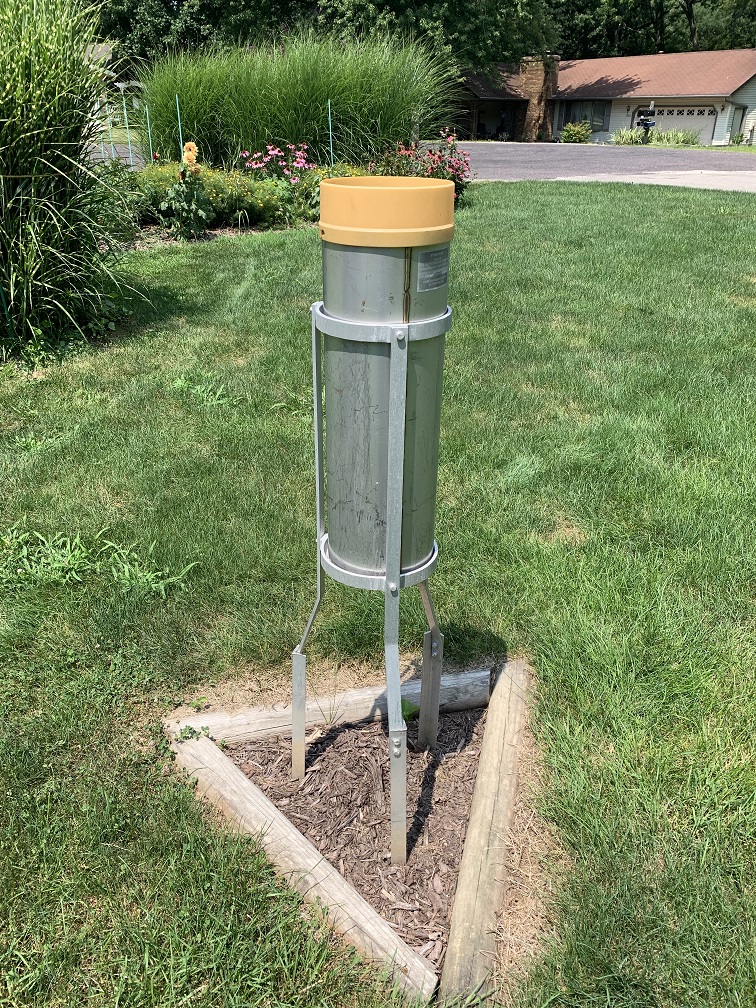
(Standard rain gauge.
Click to enlarge.) |
This rain gauge is what most observers use. It is called a "Standard Rain Gauge" (SRG), and consists of a funnel 8 inches in diameter, leading to a tube inside the gage. The inside tube can hold up to 2 inches of rain; any excess will flow into the main container to be measured after the inside tube is emptied. The rainfall is measured using a specially calibrated dipstick. During the winter, the funnel and inside tube are removed; snow falls into the main container, and then is melted to determine the liquid equivalent of the snowfall. |
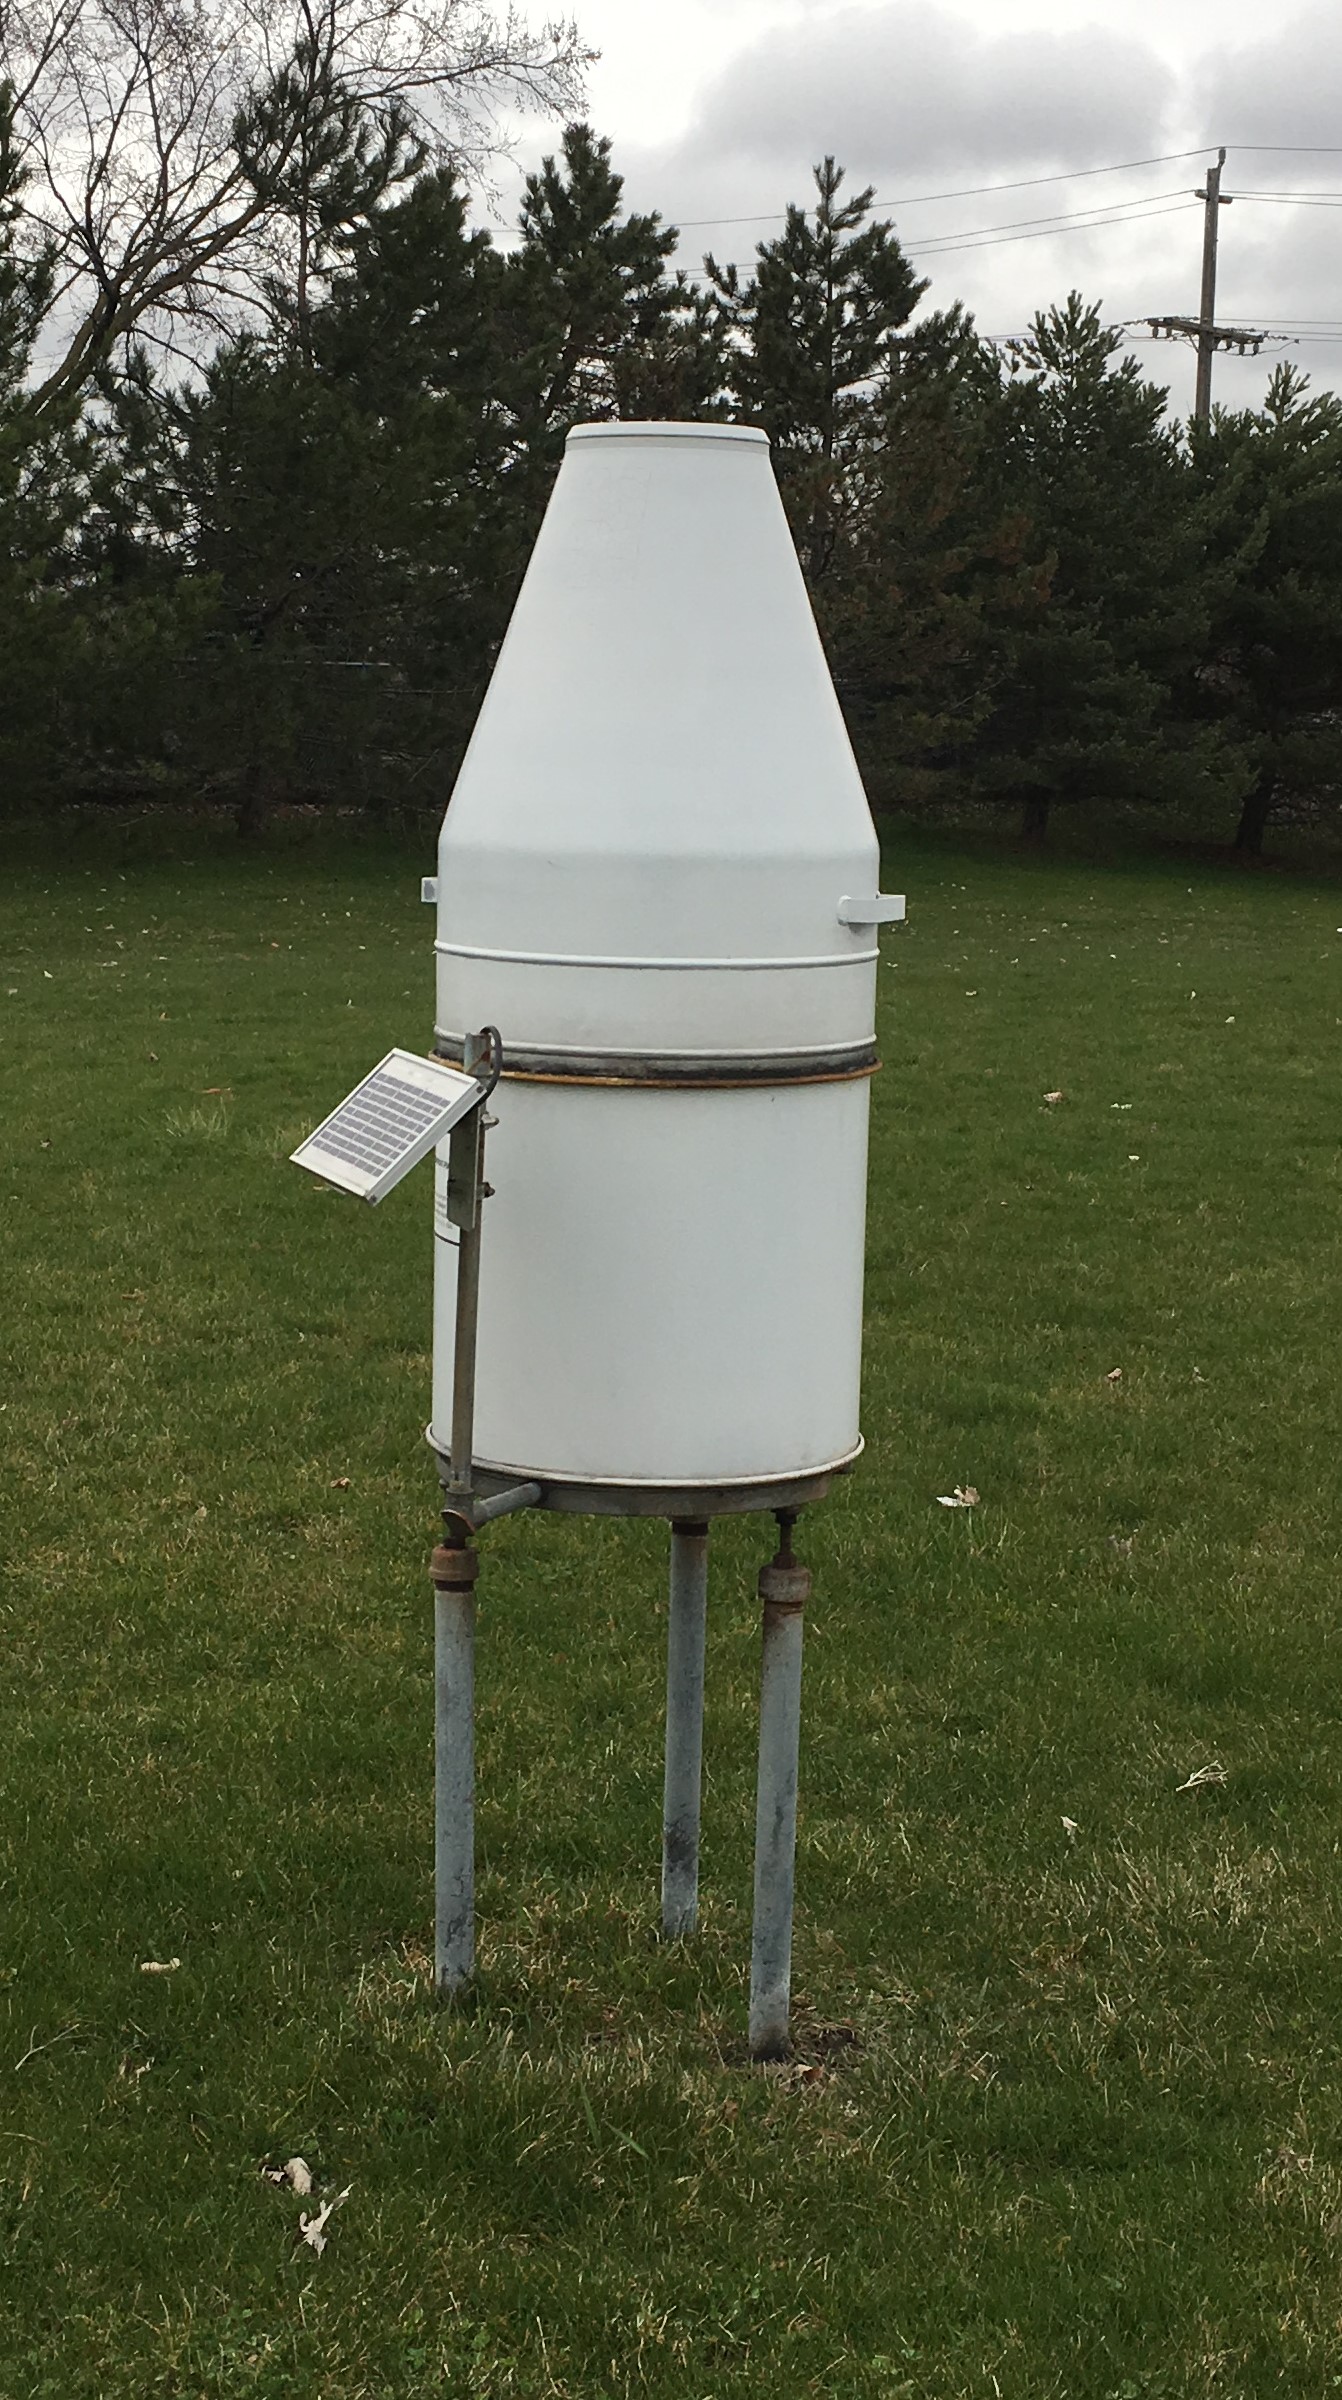
(Recording rain gage.
Click to enlarge.) |
The Fischer Porter rain gage originally was a weighing rain gage that, through a mechanical system, translated the weight of water in a bucket into a water equivalent amount in tenths of an inch. A paper tape was punched every 15 minutes with the level of water in this bucket, and 15-minute precipitation was determined by the change in the bucket level between punches.
These gages have been upgraded with electronics, which track the observations. These observations are then downloaded onto a USB flash drive, and either E-mailed to the NWS, or the flash drive itself is mailed. After the data on the flash drives are quality controlled, the NWS office transmits the data files to the National Centers for Environmental Information. |
Temperature Gauges
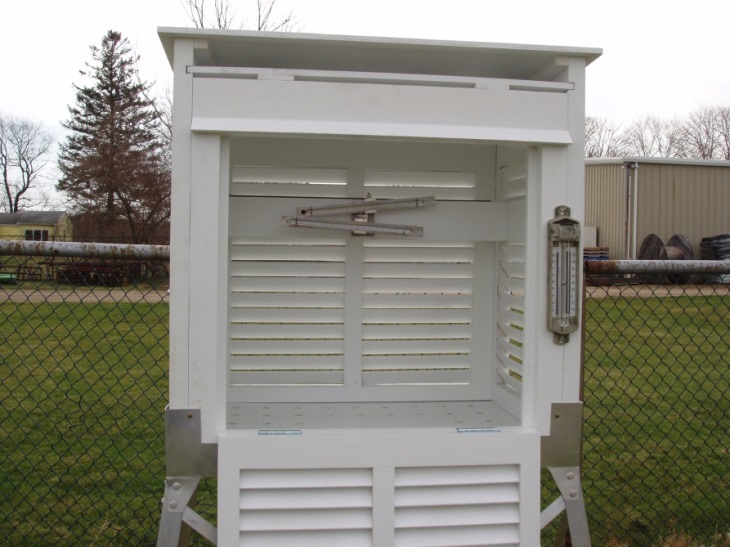
(Cotton Region Shelter.
Click to enlarge.) |
Some stations use mercury and alcohol thermometers to register high and low temperatures. The thermometers are kept inside a ventilated box called a Cotton Region Shelter (CRS, so named because of the location where they were first used). The maximum thermometer pushes the mercury to the highest temperature observed that day, where it stays until it is reset by the observer. The minimum thermometer has a small pin inside, which marks the low temperature. |
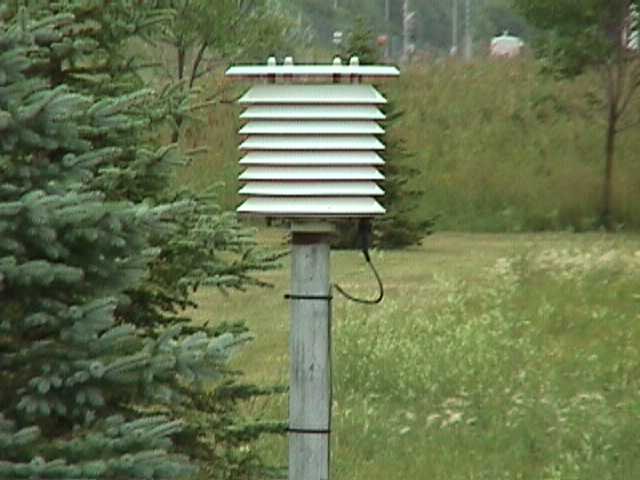
(Electronic temperature shelter. Click to enlarge.) |
Many temperature-reporting stations use electronic thermometers in place of the mercury thermometers. This particular system is called a Maximum-Minimum Temperature System (MMTS). The sensor is mounted outside, and cables are routed to a digital display inside a nearby building. The digital readout logs the high and low temperatures until reset by the observer, and the system also stores the last 30 days of observations in memory.
|
River Gauges
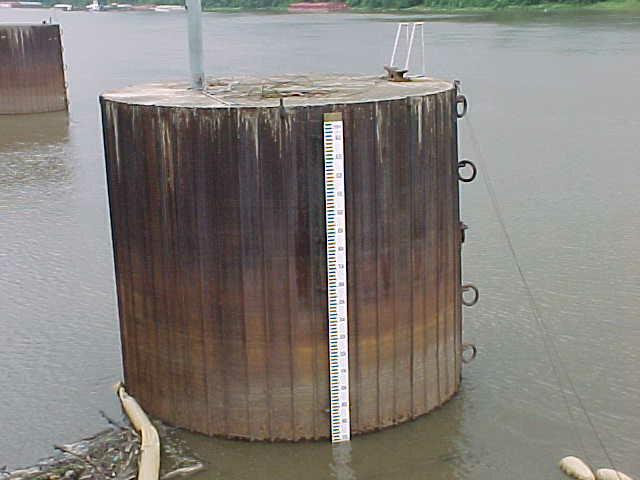
(Staff gauge. Click to enlarge.)
|
Some observers read river levels using a staff gauge. These gages are basically large rulers mounted or painted onto objects such as bridge supports, walls, etc. River levels are read from this gauge to the nearest tenth of a foot. |
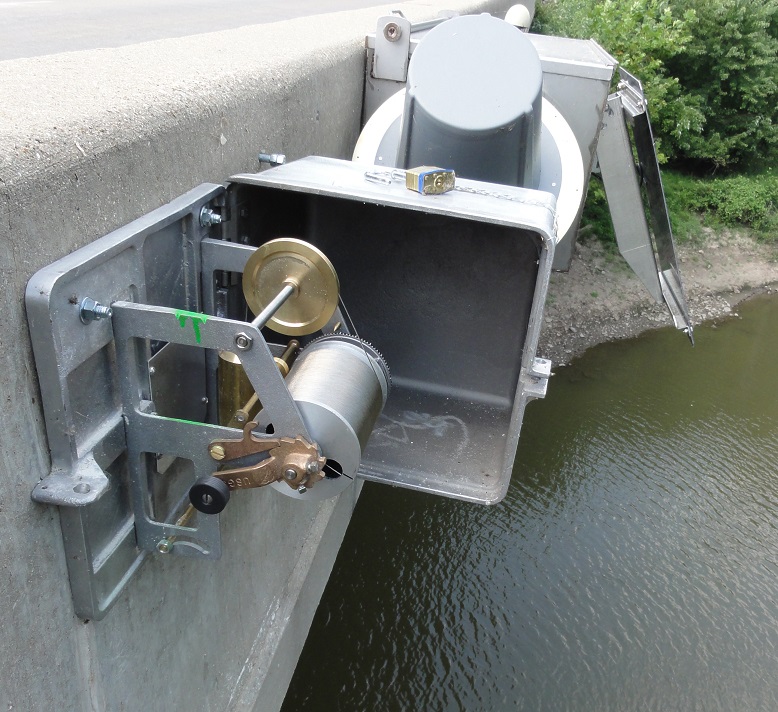
(Wire weight gauge. Click to enlarge.)
|
At some locations, river levels are read using a wire weight gauge. This type of gauge has cable wound around a drum; a brass or bronze weight is attached to the end of the cable. A crank is used to lower the weight to the surface of the water; a counter and disk on the crank handle indicates the river reading, usually to a hundredth of a foot. |
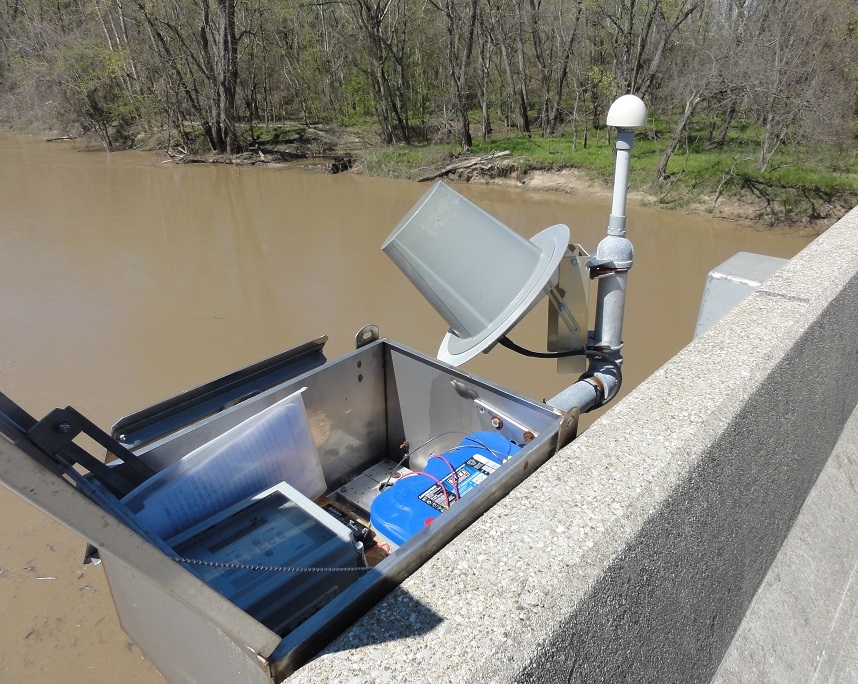
(Data Collection Platform. Click to enlarge.)
|
Many river levels are read using automated methods. Data Collection Platforms (DCP) collect the river level readings, and relay them via satellite or telephone lines. Inside the DCP houses, river levels may be determined using nitrogen gas, voltmeters, or electrical tapes. Many of these DCP sites also have a staff or wire weight gauge for backup purposes, especially if river forecasts are issued. |