Record setting heat is expected over the next several days from the Intermountain West through the northern Plains. Furthermore, fire weather concerns increase with dry and breezy conditions. Meanwhile, heavy rainfall and severe thunderstorm threats for the Ohio/Tennessee Valleys, central Appalachians and Southeast today. The threat shifts to central Gulf Coast and across central Texas this week. Read More >
| North & Central Texas Tornado Climatology |
|
|
Updated Through 5/15/2026
Visit our event reviews of past significant tornado outbreaks.
|
| County Name (Click for individual County Tornado Climatology Page) |
WFO Fort Worth Tornado Maps |
2026 Tornado Count
|
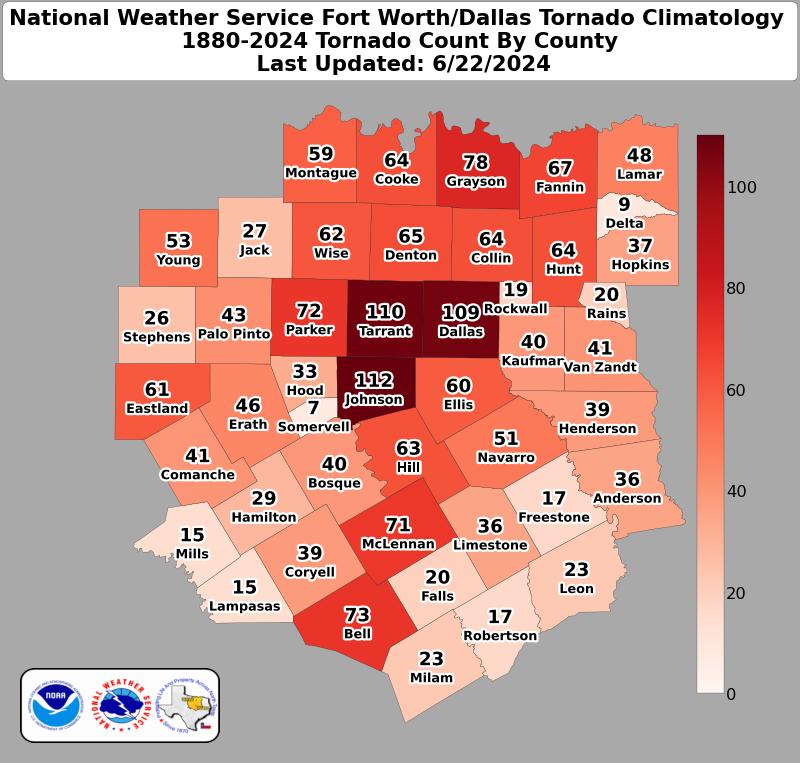
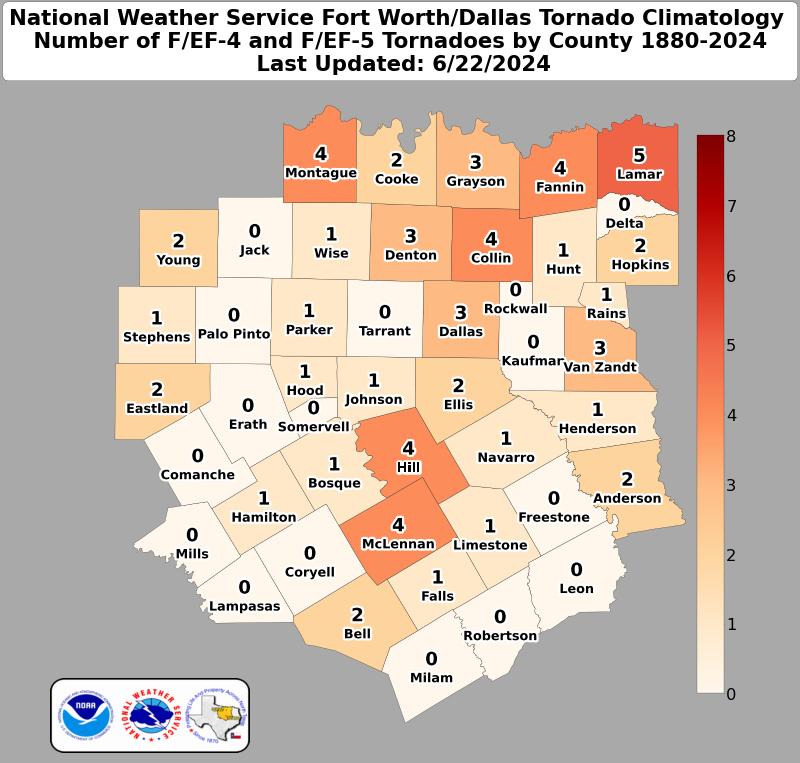
1880-2026 Tornado Count
|
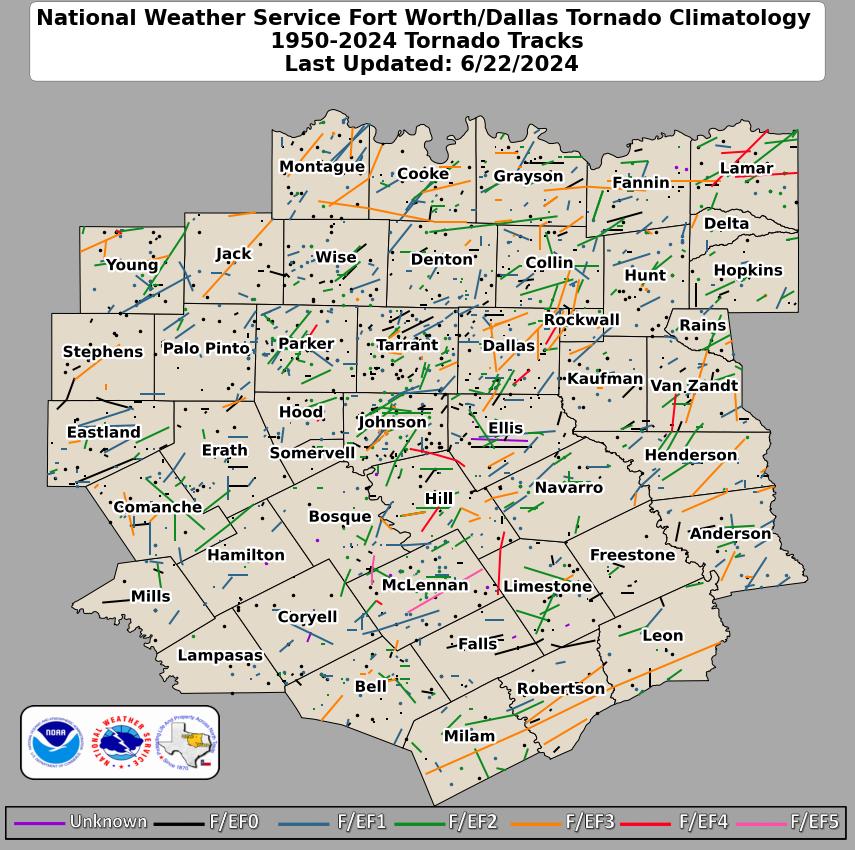
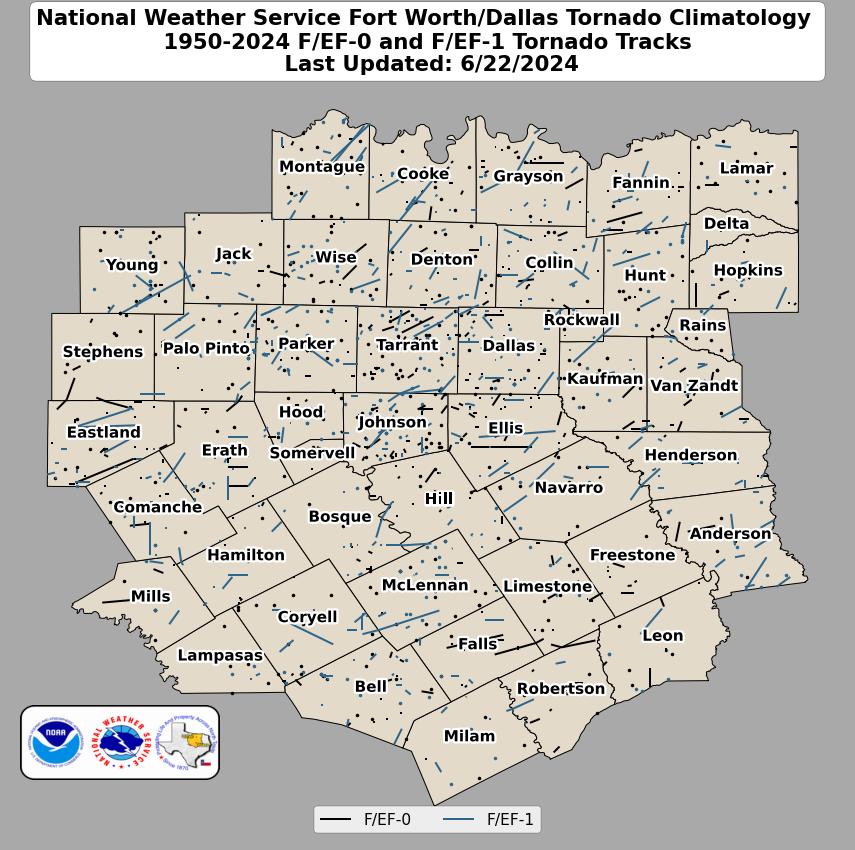
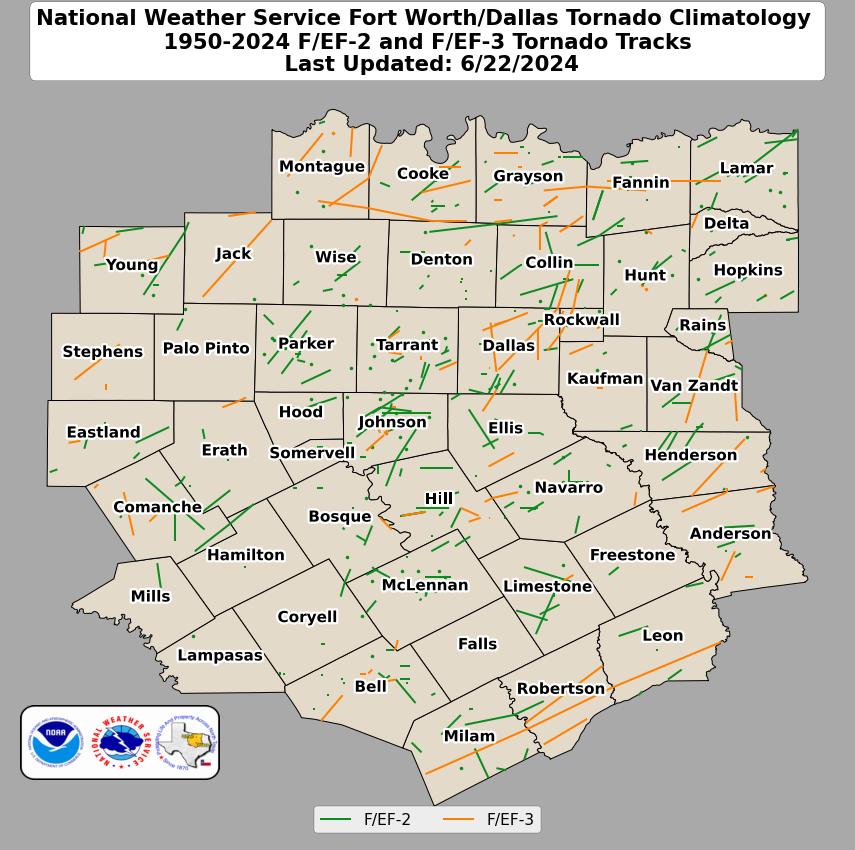
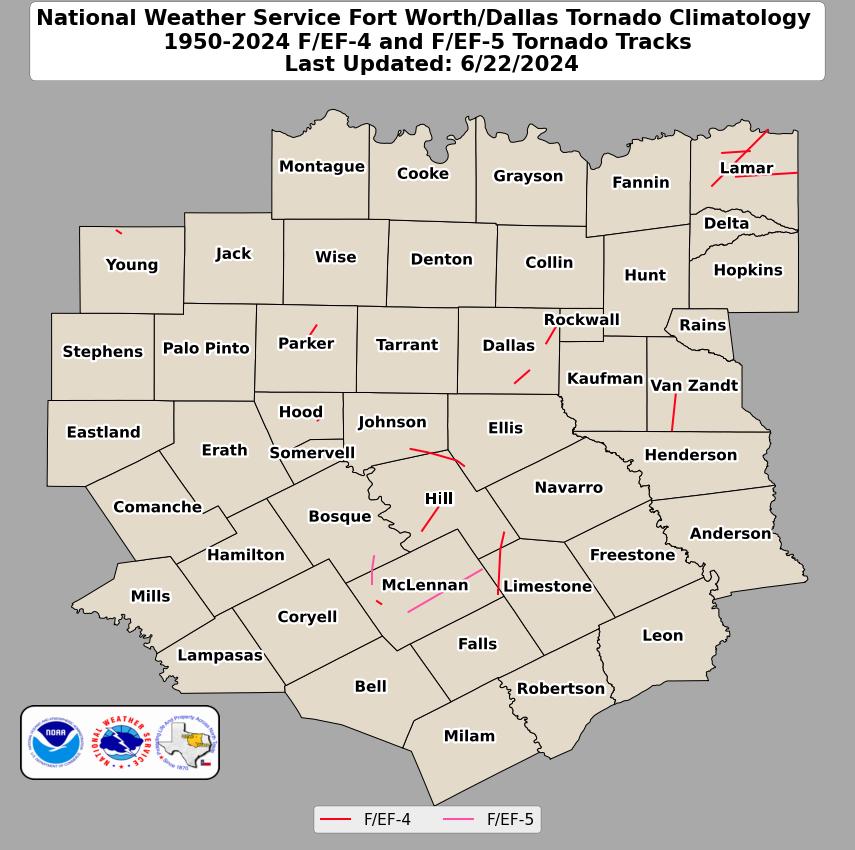
1950-2026 Tornado
|
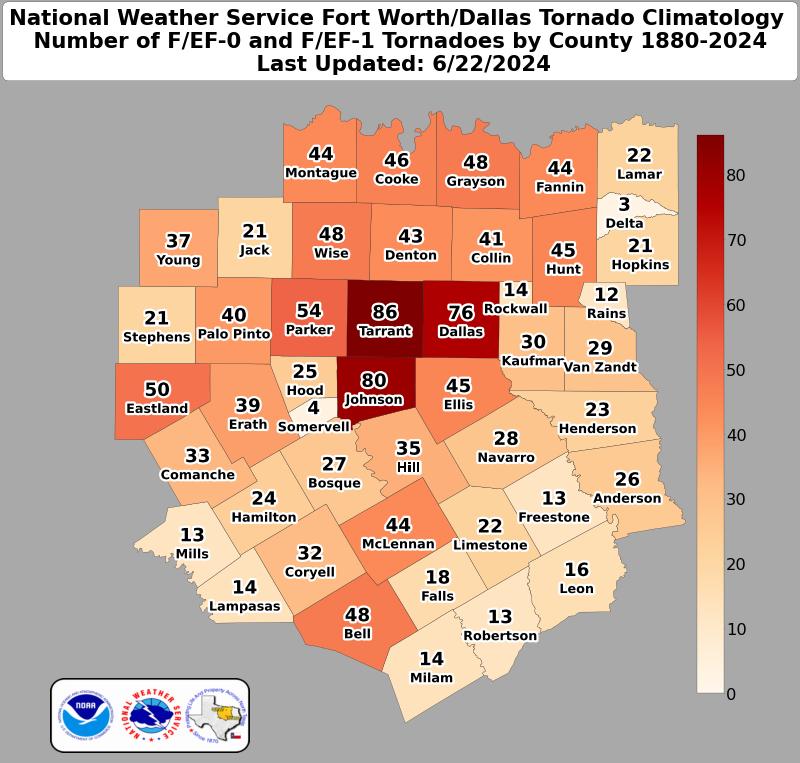
1880-2026 F/EF0-F/EF1
|
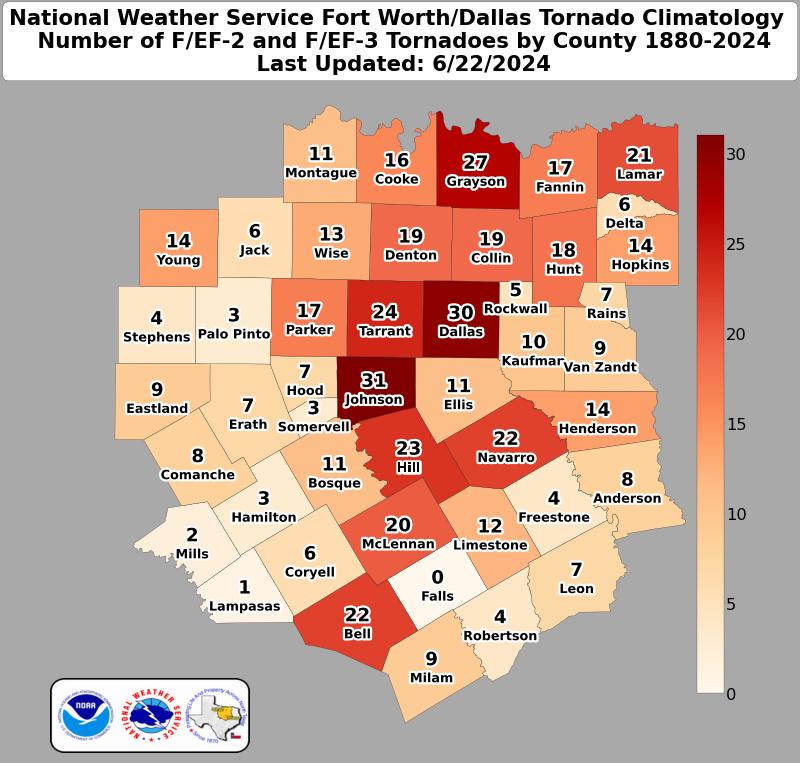
1880-2026 F/EF2-F/EF3
|
1880-2026 F/EF4-F/EF5
|
1950-2026 F/EF0-F/EF1
|
1950-2026 F/EF2-F/EF3
|
1950-2026 F/EF4-F/EF5
|
| Archived Tornado Count By County Maps |
| Tornado Maps (2020s) |
Tornado Maps (2010s) |
Tornado Maps (2000s) |
Tornado Maps (1990s) |
| Tornado Maps (1980s) | Tornado Maps (1970s) | Tornado Maps (1960s) |
| Tornado Maps (1950s) |
Tornado Maps (1940s) |
Tornado Maps (1930s) |
| Tornado Maps (1920s) |
Tornado Maps (1910s) |
Tornado Maps (1900s) |
| Tornado Maps (1890s) |
Tornado Maps (1880s) |
WFO Fort Worth Tornado Statistics |
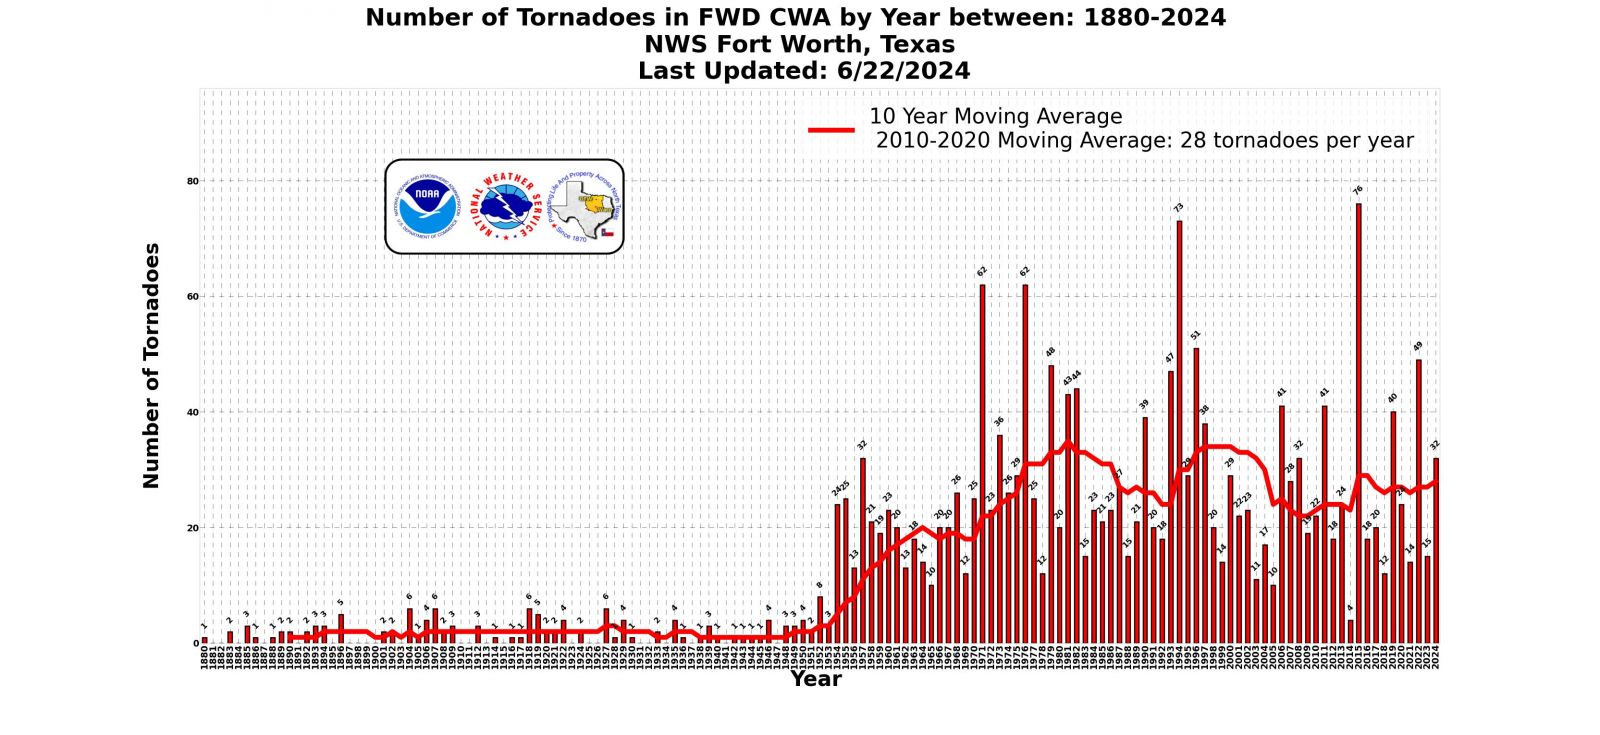
Tornadoes by Year |
|
Tornadoes by Month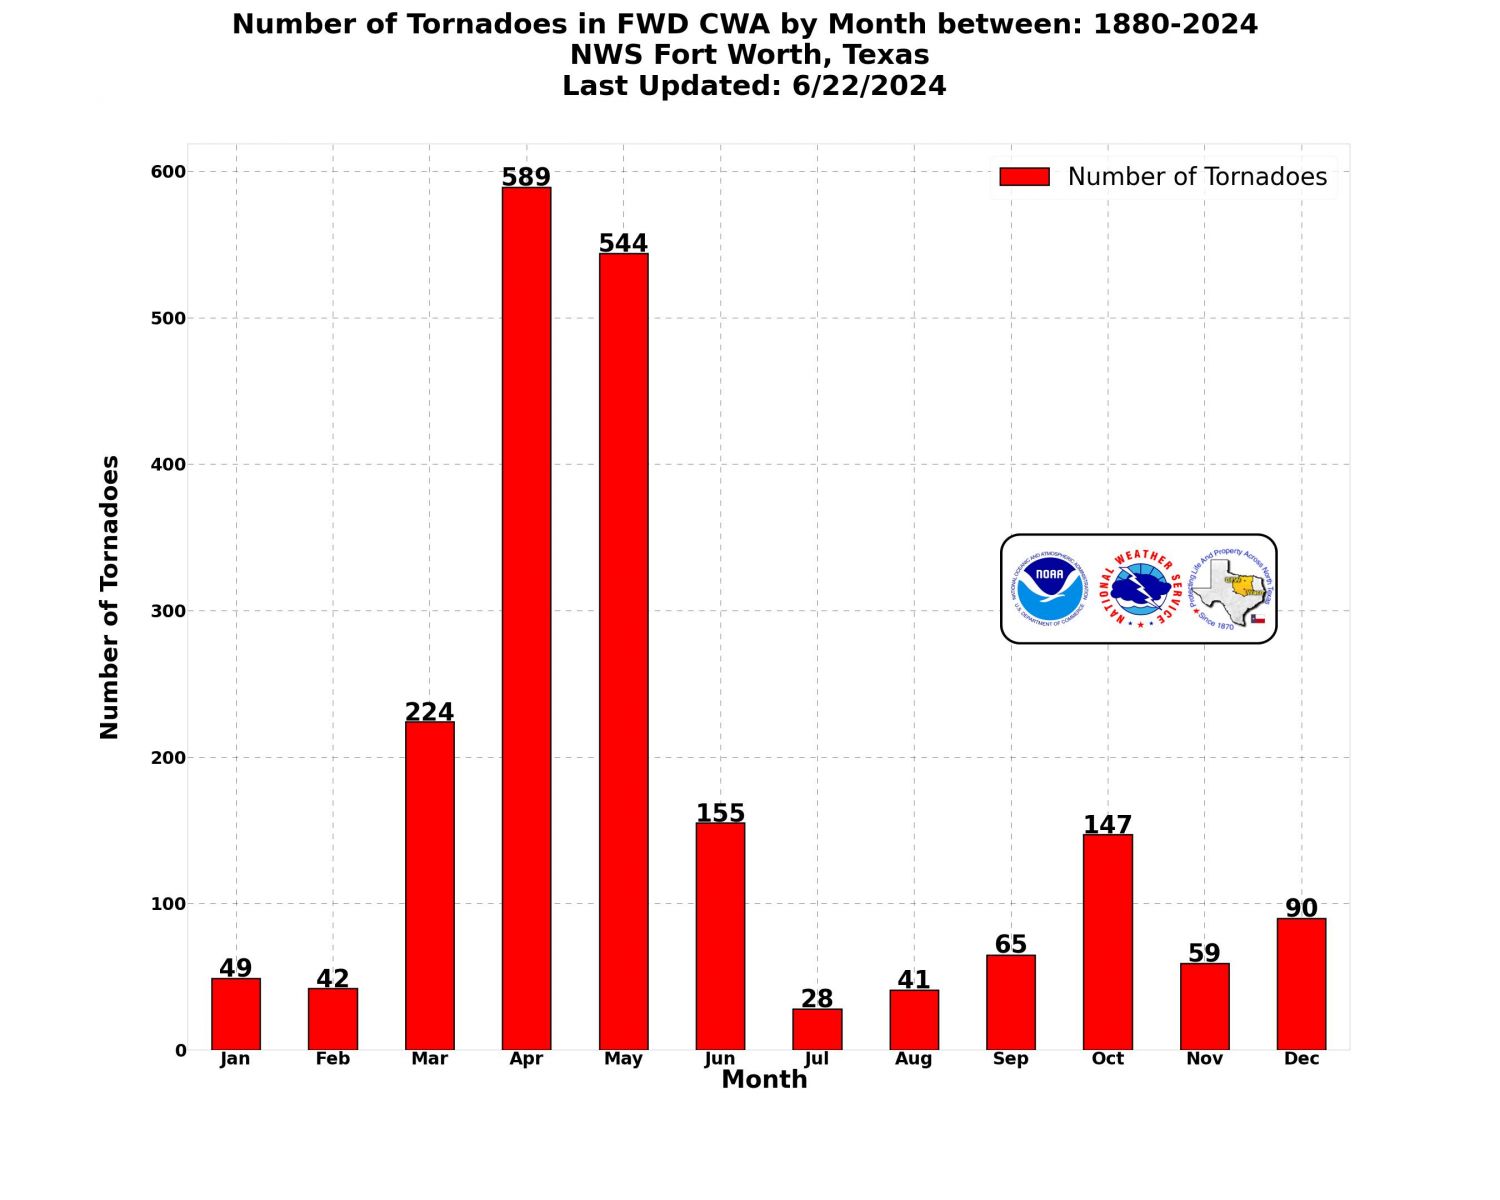 Click image for larger figure |
Tornadoes by Time of Day Click image for larger figure |
Tornadoes by Intensity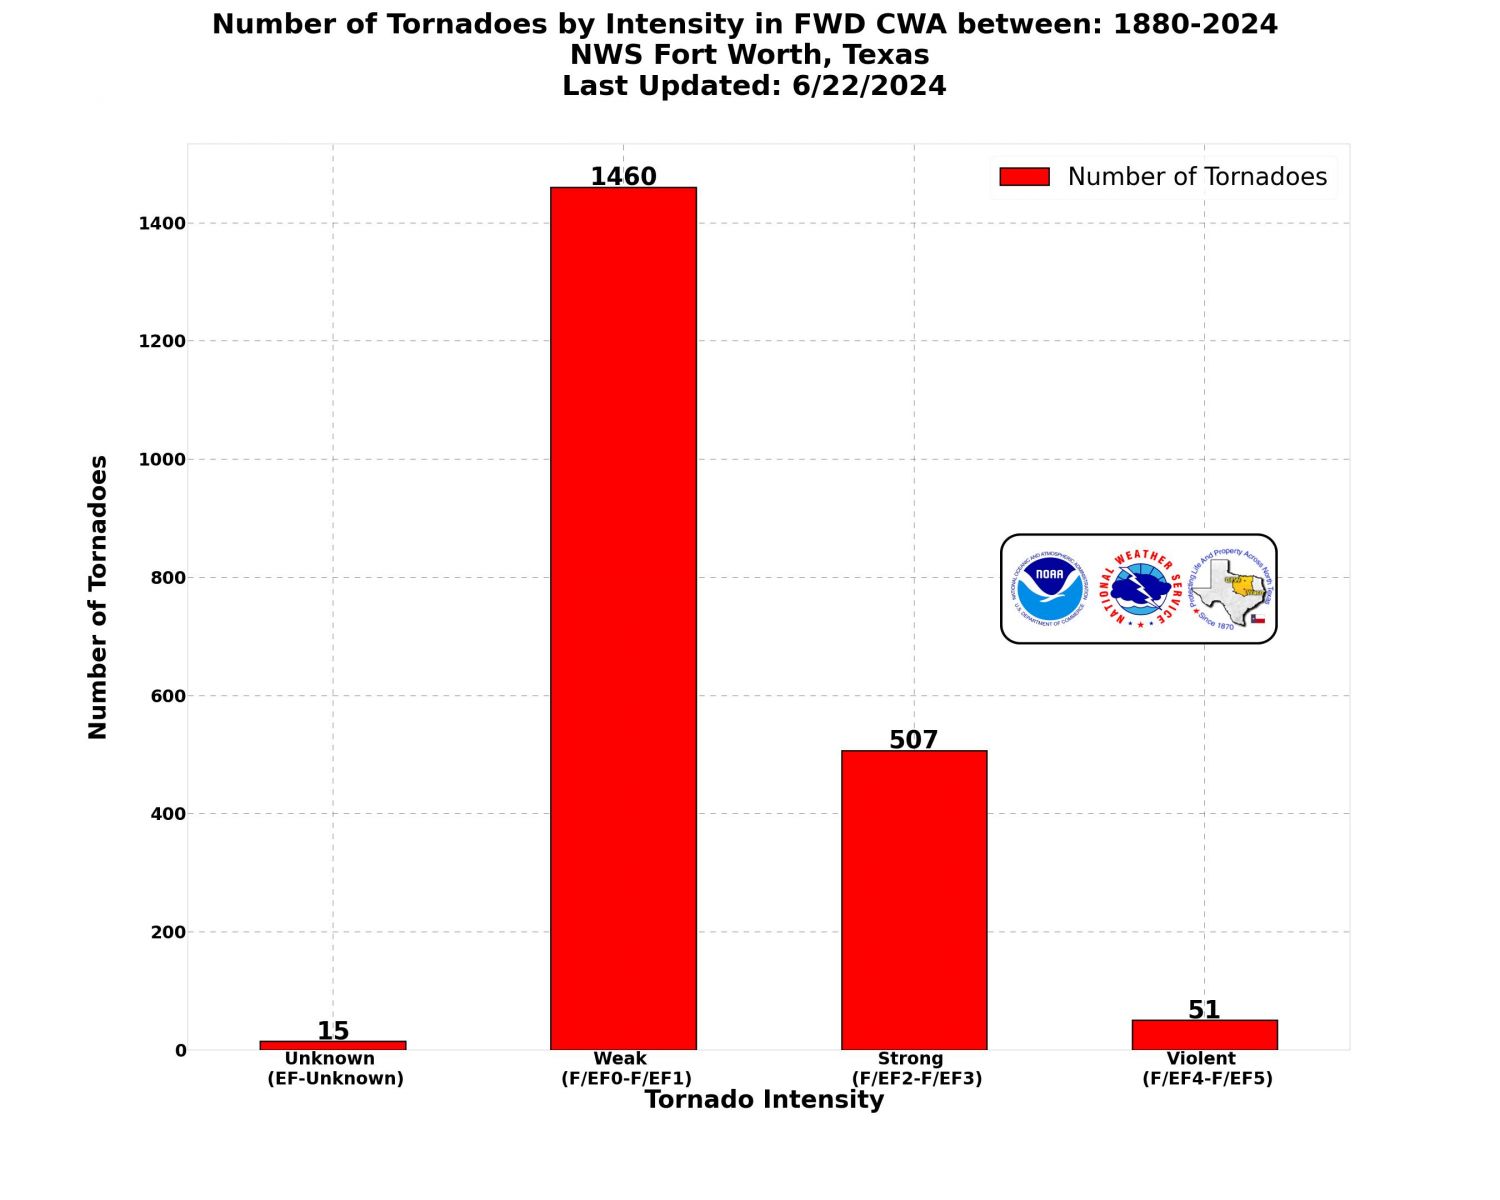 Click image for larger figure |
Tornadoes by Fujita Rating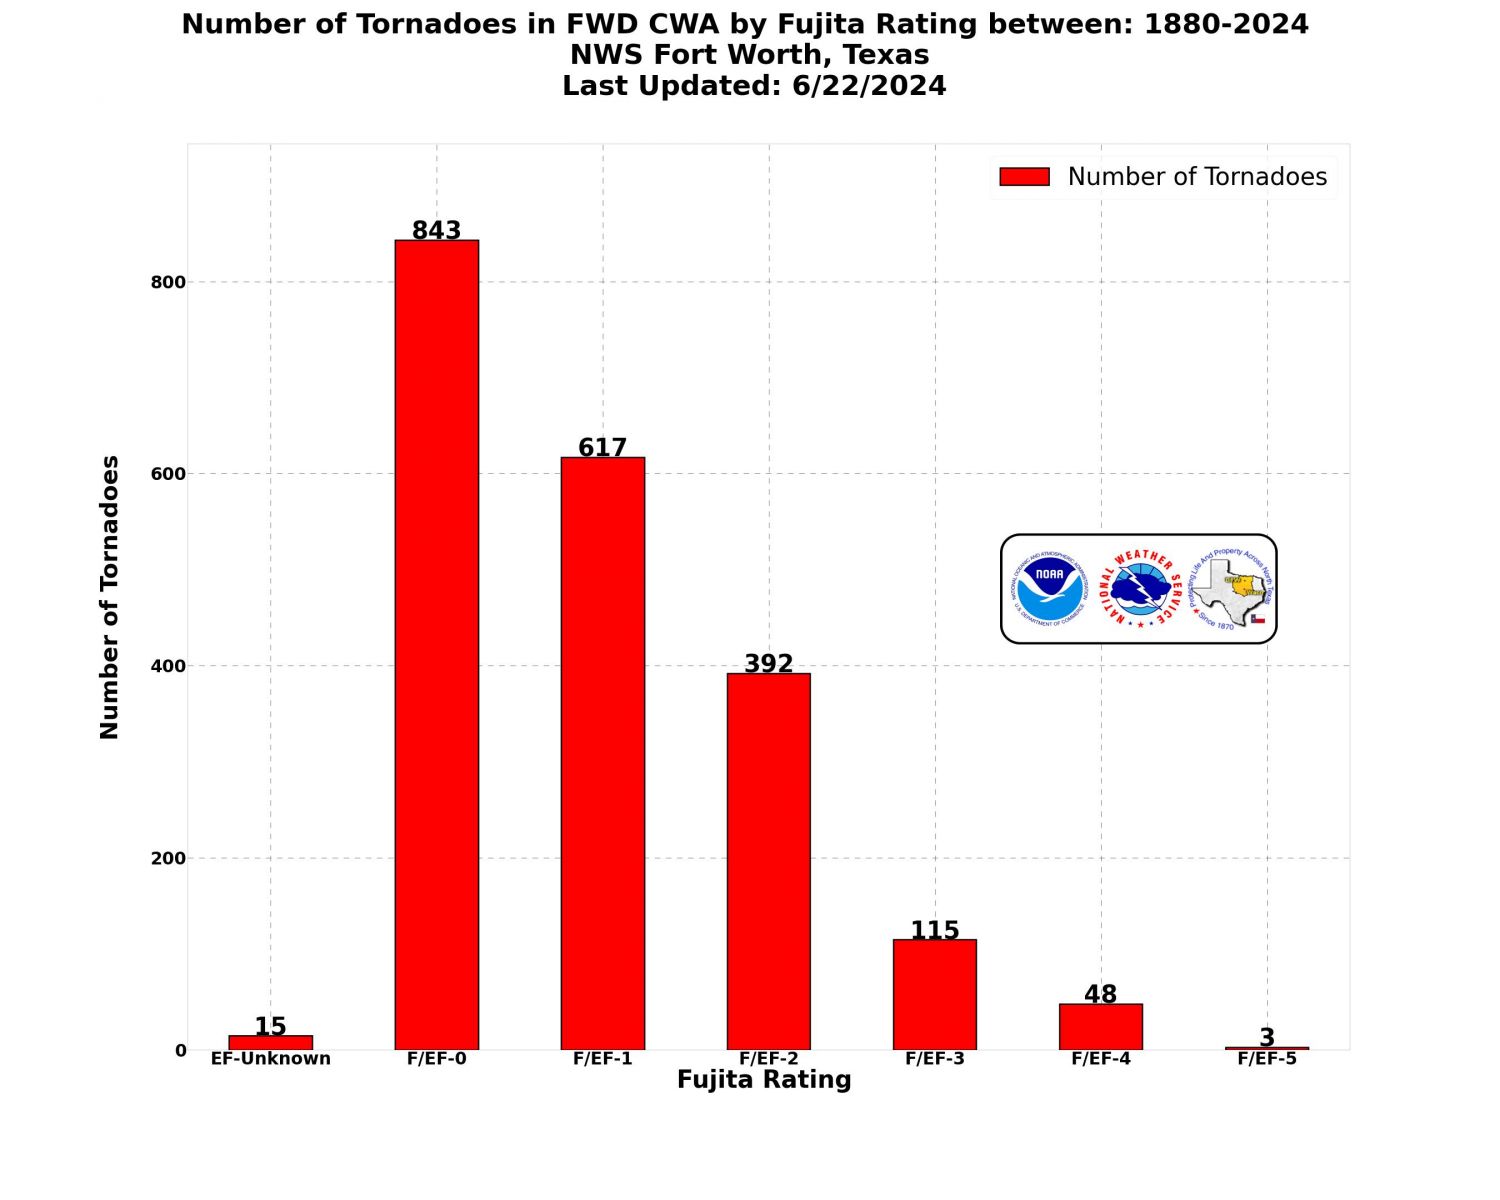 Click image for larger figure |
| North & Central TX 1950-2026 Tornado Table | |||||||||||||
| North & Central TX 2020s Tornado Table | |||||||||||||
| Jan. | Feb. | Mar. | Apr. | May. | Jun. | Jul. | Aug. | Sep. | Oct. | Nov. | Dec. | Total | |
| 2026 | 0 | 0 | 0 | 11 | - | - | - | - | - | - | - | - | 11 |
| 2025 | 0 | 0 | 2 | 16 | 14 | 4 | 0 | 0 | 0 | 0 | 0 | 0 | 36 |
| 2024 | 0 | 0 | 1 | 14 | 16 | 1 | 0 | 0 | 0 | 0 | 0 | 1 | 33 |
| 2023 | 0 | 0 | 6 | 7 | 1 | 0 | 0 | 0 | 0 | 1 | 0 | 0 | 15 |
| 2022 | 0 | 0 | 19 | 9 | 0 | 0 | 0 | 0 | 0 | 0 | 4 | 17 | 49 |
| 2021 | 0 | 0 | 2 | 0 | 12 | 0 | 0 | 0 | 0 | 0 | 0 | 0 | 14 |
| 2020 | 6 | 0 | 7 | 6 | 3 | 0 | 0 | 0 | 0 | 0 | 1 | 1 | 24 |
| North & Central TX 2010s Tornado Table | |||||||||||||
| Jan. | Feb. | Mar. | Apr. | May. | Jun. | Jul. | Aug. | Sep. | Oct. | Nov. | Dec. | Total | |
| 2019 | 0 | 0 | 3 | 8 | 14 | 5 | 0 | 0 | 0 | 10 | 0 | 0 | 40 |
| 2018 | 2 | 0 | 3 | 0 | 0 | 0 | 0 | 0 | 0 | 7 | 0 | 0 | 12 |
| 2017 | 6 | 0 | 3 | 9 | 1 | 0 | 0 | 0 | 0 | 0 | 0 | 0 | 19 |
| 2016 | 0 | 0 | 11 | 6 | 1 | 0 | 0 | 0 | 0 | 0 | 0 | 0 | 18 |
| 2015 | 0 | 0 | 0 | 19 | 42 | 0 | 0 | 0 | 0 | 0 | 3 | 12 | 76 |
| 2014 | 0 | 0 | 0 | 3 | 1 | 0 | 0 | 0 | 0 | 0 | 0 | 0 | 4 |
| 2013 | 0 | 0 | 0 | 0 | 23 | 0 | 0 | 0 | 0 | 1 | 0 | 0 | 24 |
| 2012 | 0 | 0 | 0 | 17 | 0 | 1 | 0 | 0 | 0 | 0 | 0 | 0 | 18 |
| 2011 | 0 | 0 | 1 | 25 | 14 | 1 | 0 | 0 | 0 | 0 | 0 | 0 | 41 |
| 2010 | 5 | 0 | 0 | 3 | 3 | 0 | 0 | 0 | 8 | 3 | 0 | 0 | 22 |
| North & Central TX 2000s Tornado Table | |||||||||||||
| Jan. | Feb. | Mar. | Apr. | May. | Jun. | Jul. | Aug. | Sep. | Oct. | Nov. | Dec. | Total | |
| 2009 | 0 | 3 | 2 | 5 | 1 | 8 | 0 | 0 | 0 | 0 | 0 | 0 | 19 |
| 2008 | 0 | 0 | 4 | 20 | 5 | 0 | 0 | 0 | 0 | 1 | 0 | 2 | 32 |
| 2007 | 1 | 0 | 7 | 10 | 3 | 5 | 0 | 0 | 2 | 0 | 0 | 0 | 28 |
| 2006 | 0 | 0 | 3 | 6 | 9 | 0 | 0 | 0 | 0 | 0 | 0 | 23 | 41 |
| 2005 | 0 | 0 | 4 | 5 | 0 | 1 | 0 | 0 | 0 | 0 | 0 | 0 | 10 |
| 2004 | 0 | 0 | 9 | 1 | 0 | 6 | 0 | 0 | 0 | 0 | 1 | 0 | 17 |
| 2003 | 0 | 0 | 2 | 3 | 4 | 1 | 1 | 0 | 0 | 0 | 0 | 0 | 11 |
| 2002 | 0 | 0 | 9 | 12 | 0 | 0 | 0 | 0 | 0 | 0 | 0 | 2 | 23 |
| 2001 | 0 | 0 | 0 | 4 | 6 | 1 | 0 | 0 | 3 | 8 | 0 | 0 | 22 |
| 2000 | 0 | 2 | 10 | 7 | 7 | 2 | 0 | 0 | 0 | 1 | 0 | 0 | 29 |
| North & Central TX 1990s Tornado Table | |||||||||||||
| Jan. | Feb. | Mar. | Apr. | May. | Jun. | Jul. | Aug. | Sep. | Oct. | Nov. | Dec. | Total | |
| 1999 | 0 | 0 | 2 | 5 | 4 | 2 | 0 | 0 | 0 | 0 | 0 | 1 | 14 |
| 1998 | 6 | 1 | 2 | 2 | 1 | 1 | 0 | 0 | 0 | 7 | 0 | 0 | 20 |
| 1997 | 1 | 3 | 1 | 2 | 21 | 8 | 0 | 0 | 1 | 1 | 0 | 0 | 38 |
| 1996 | 9 | 0 | 0 | 22 | 2 | 1 | 1 | 0 | 8 | 7 | 1 | 0 | 51 |
| 1995 | 0 | 0 | 1 | 19 | 7 | 0 | 2 | 0 | 0 | 0 | 0 | 0 | 29 |
| 1994 | 0 | 0 | 1 | 41 | 14 | 2 | 1 | 0 | 0 | 8 | 6 | 0 | 73 |
| 1993 | 0 | 1 | 0 | 3 | 18 | 2 | 0 | 0 | 12 | 11 | 0 | 0 | 47 |
| 1992 | 0 | 0 | 1 | 1 | 8 | 0 | 0 | 0 | 1 | 5 | 2 | 0 | 18 |
| 1991 | 0 | 0 | 0 | 14 | 0 | 5 | 0 | 0 | 0 | 0 | 1 | 0 | 20 |
| 1990 | 1 | 1 | 3 | 29 | 5 | 0 | 0 | 0 | 0 | 0 | 0 | 0 | 39 |
| North & Central TX 1980s Tornado Table | |||||||||||||
| Jan. | Feb. | Mar. | Apr. | May. | Jun. | Jul. | Aug. | Sep. | Oct. | Nov. | Dec. | Total | |
| 1989 | 1 | 0 | 2 | 1 | 11 | 6 | 0 | 0 | 0 | 0 | 0 | 0 | 21 |
| 1988 | 0 | 0 | 0 | 3 | 0 | 1 | 1 | 1 | 2 | 4 | 3 | 0 | 15 |
| 1987 | 0 | 0 | 4 | 0 | 4 | 9 | 1 | 0 | 1 | 0 | 6 | 2 | 27 |
| 1986 | 0 | 2 | 3 | 9 | 5 | 3 | 0 | 1 | 0 | 0 | 0 | 0 | 23 |
| 1985 | 0 | 0 | 1 | 7 | 11 | 0 | 0 | 0 | 0 | 2 | 0 | 0 | 21 |
| 1984 | 0 | 7 | 6 | 3 | 2 | 3 | 0 | 0 | 0 | 1 | 0 | 1 | 23 |
| 1983 | 0 | 0 | 3 | 1 | 2 | 7 | 0 | 1 | 0 | 0 | 1 | 0 | 15 |
| 1982 | 0 | 0 | 2 | 8 | 25 | 5 | 1 | 0 | 0 | 0 | 3 | 0 | 44 |
| 1981 | 0 | 0 | 1 | 1 | 19 | 3 | 1 | 0 | 0 | 15 | 3 | 0 | 43 |
| 1980 | 0 | 0 | 0 | 8 | 5 | 2 | 0 | 1 | 0 | 4 | 0 | 0 | 20 |
| North & Central TX 1970s Tornado Table | |||||||||||||
| Jan. | Feb. | Mar. | Apr. | May. | Jun. | Jul. | Aug. | Sep. | Oct. | Nov. | Dec. | Total | |
| 1979 | 0 | 2 | 6 | 6 | 17 | 4 | 1 | 2 | 0 | 10 | 0 | 0 | 48 |
| 1978 | 0 | 0 | 0 | 9 | 3 | 0 | 0 | 0 | 0 | 0 | 0 | 0 | 12 |
| 1977 | 0 | 0 | 2 | 9 | 2 | 2 | 1 | 2 | 7 | 0 | 0 | 0 | 25 |
| 1976 | 0 | 0 | 1 | 20 | 31 | 3 | 2 | 0 | 3 | 2 | 0 | 0 | 62 |
| 1975 | 0 | 0 | 5 | 2 | 12 | 5 | 3 | 0 | 1 | 1 | 0 | 0 | 29 |
| 1974 | 0 | 0 | 0 | 8 | 4 | 3 | 0 | 0 | 0 | 11 | 0 | 0 | 26 |
| 1973 | 2 | 0 | 8 | 3 | 13 | 3 | 0 | 0 | 0 | 1 | 4 | 2 | 36 |
| 1972 | 0 | 0 | 4 | 2 | 3 | 0 | 0 | 2 | 2 | 6 | 4 | 0 | 23 |
| 1971 | 0 | 6 | 6 | 12 | 8 | 2 | 3 | 1 | 0 | 2 | 1 | 21 | 62 |
| 1970 | 0 | 0 | 1 | 12 | 0 | 3 | 0 | 1 | 1 | 7 | 0 | 0 | 25 |
| North & Central TX 1960s Tornado Table | |||||||||||||
| Jan. | Feb. | Mar. | Apr. | May. | Jun. | Jul. | Aug. | Sep. | Oct. | Nov. | Dec. | Total | |
| 1969 | 0 | 0 | 0 | 3 | 4 | 0 | 0 | 3 | 1 | 1 | 0 | 0 | 12 |
| 1968 | 1 | 0 | 1 | 5 | 11 | 2 | 0 | 0 | 0 | 1 | 0 | 5 | 26 |
| 1967 | 0 | 0 | 5 | 5 | 6 | 3 | 0 | 0 | 0 | 0 | 0 | 1 | 20 |
| 1966 | 0 | 1 | 0 | 5 | 10 | 1 | 0 | 2 | 1 | 0 | 0 | 0 | 20 |
| 1965 | 0 | 0 | 1 | 2 | 4 | 1 | 0 | 2 | 0 | 0 | 0 | 0 | 10 |
| 1964 | 0 | 0 | 0 | 5 | 1 | 0 | 2 | 3 | 1 | 0 | 2 | 0 | 14 |
| 1963 | 0 | 0 | 2 | 3 | 3 | 1 | 1 | 3 | 3 | 0 | 2 | 0 | 18 |
| 1962 | 0 | 0 | 4 | 0 | 0 | 6 | 1 | 1 | 1 | 0 | 0 | 0 | 13 |
| 1961 | 0 | 0 | 11 | 4 | 1 | 2 | 0 | 1 | 0 | 0 | 1 | 0 | 20 |
| 1960 | 2 | 0 | 0 | 1 | 16 | 1 | 0 | 1 | 0 | 1 | 1 | 0 | 23 |
| North & Central TX 1950s Tornado Table | |||||||||||||
| Jan. | Feb. | Mar. | Apr. | May. | Jun. | Jul. | Aug. | Sep. | Oct. | Nov. | Dec. | Total | |
| 1959 | 0 | 0 | 4 | 0 | 3 | 2 | 1 | 0 | 2 | 4 | 3 | 0 | 19 |
| 1958 | 2 | 0 | 1 | 6 | 0 | 3 | 1 | 5 | 0 | 0 | 3 | 0 | 21 |
| 1957 | 0 | 0 | 0 | 24 | 5 | 1 | 0 | 1 | 0 | 0 | 1 | 0 | 32 |
| 1956 | 0 | 1 | 4 | 1 | 3 | 0 | 1 | 3 | 0 | 0 | 0 | 0 | 13 |
| 1955 | 0 | 0 | 5 | 7 | 6 | 5 | 0 | 2 | 0 | 0 | 0 | 0 | 25 |
| 1954 | 0 | 1 | 1 | 3 | 10 | 3 | 0 | 1 | 4 | 1 | 0 | 0 | 24 |
| 1953 | 0 | 0 | 0 | 0 | 2 | 0 | 0 | 0 | 0 | 0 | 1 | 0 | 3 |
| 1952 | 0 | 0 | 2 | 3 | 1 | 1 | 0 | 1 | 0 | 0 | 0 | 0 | 8 |
| 1951 | 0 | 0 | 0 | 0 | 1 | 1 | 0 | 0 | 0 | 0 | 0 | 0 | 2 |
| 1950 | 0 | 2 | 0 | 1 | 1 | 0 | 0 | 0 | 0 | 0 | 0 | 0 | 4 |
| North & Central TX 1950-2025 Total & Average Tornadoes Table | |||||||||||||
| Jan. | Feb. | Mar. | Apr. | May. | Jun. | Jul. | Aug. | Sep. | Oct. | Nov. | Dec. | Total | |
| TOTAL | 45 | 33 | 215 | 555 | 525 | 154 | 26 | 41 | 65 | 145 | 58 | 91 | 1953 |
| AVERAGE | 1 | 0 | 3 | 7 | 7 | 2 | 0 | 1 | 1 | 2 | 1 | 1 | 26 |
| North & Central TX 1880-2025 Deadliest Individual Tornadoes (10+ Deaths) | ||||
| Rank | Date | Location | County | Deaths |
| 1 | May 11, 1953 | Waco | McLennan | 114 |
| 2 | May 15, 1896 | Sherman | Grayson | 73 |
| 3 | May 6, 1930 | Frost | Hill/Navarro/Ellis | 41 |
| 4 | April 28, 1893 | Cisco | Eastland | 23 |
| 5 | April 9, 1919 | Eustace/Grand Saline | Henderson/Van Zandt | 20 |
| 6 | May 9, 1927 | Nevada | Collin | 19 |
| 7 | April 8, 1919 | Blue Ridge | Collin/Fannin | 18 |
| 8 | July 5, 1905 | Nocona | Montague | 18 |
| 9 | April 26, 1906 | Bellevue | Clay/Montague | 17 |
| 10 | May 9, 1927 | Garland | Dallas | 15 |
| 11 | January 5, 1946 | Palestine | Anderson | 15 |
| 12 | May 28, 1880 | Savoy | Fannin | 14 |
| 13 | April 13, 1921 | Melissa | Collin | 11 |
| 14 | December 26, 2015 | Garland/Rowlett | Dallas/Rockwall | 10 |
| 15 | April 2, 1982 | Paris | Lamar/Red River | 10 |
| 16 | April 2, 1957 | Dallas | Dallas | 10 |
| 17 | March 23, 1909 | Slidell | Denton | 10 |
| 18 | May 31, 1892 | Durango | Bell/Falls | 10 |