
Tropical Depression Two is expected to gradually strengthen and could bring tropical storm conditions to the Florida Panhandle beginning late Monday. Areas of flash flooding will be possible through Thursday along the eastern and central Gulf Coast. Severe thunderstorms will develop and move along a cold front crossing the Upper Midwest Monday, and through the Ohio Valley/Mid-Atlantic on Tuesday. Read More >
| 72 Hour Snow Amount Potential
Experimental - Leave feedback
|
|
| Expected 72 Hour Snowfall - Official NWS Forecast
What's this? |
High End 72 Hour Amount 1 in 10 Chance (10%) of Higher Snowfall What's this? |
| Low End 72 Hour Amount 9 in 10 Chance (90%) of Higher Snowfall What's this? |
|
| Percent Chance That 72 Hour Snow Amounts in Will Be Greater Than...
Experimental - Leave feedback
What's this?
|
||||||||||||||||
|
||||||||||||||||
| 72 Hour Snowfall Totals by Location
Experimental - Leave feedback
What's this?
|
|
|
| 72 Hour Ice Accumulation Potential
Experimental - Leave feedback
|
|
| Expected 72 Hour Ice Accumulation - Official NWS Forecast
What's this? This is the elevated flat surface ice accumulation. It is not radial/line ice. Radial/line ice is typically 39% of the elevated flat surface ice. For more information on this, see this module. |
High End 72 Hour Amount 1 in 10 Chance (10%) of Higher Ice Accumulation What's this? |
| Low End 72 Hour Amount 9 in 10 Chance (90%) of Higher Ice Accumulation What's this? |
|
| Percent Chance That 72 Hour Ice Accumulation Will Be Greater Than...
Experimental - Leave feedback
What's this?
|
||||||||||||||||
|
||||||||||||||||
| 72 Hour Ice Accumulation by Location
Experimental - Leave feedback
What's this?
|
|
|
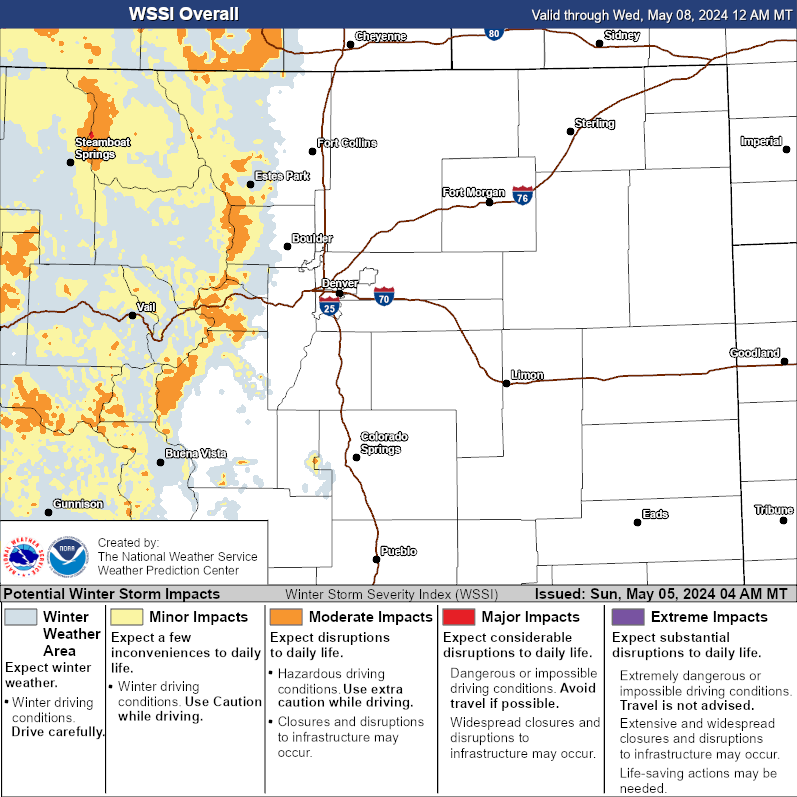
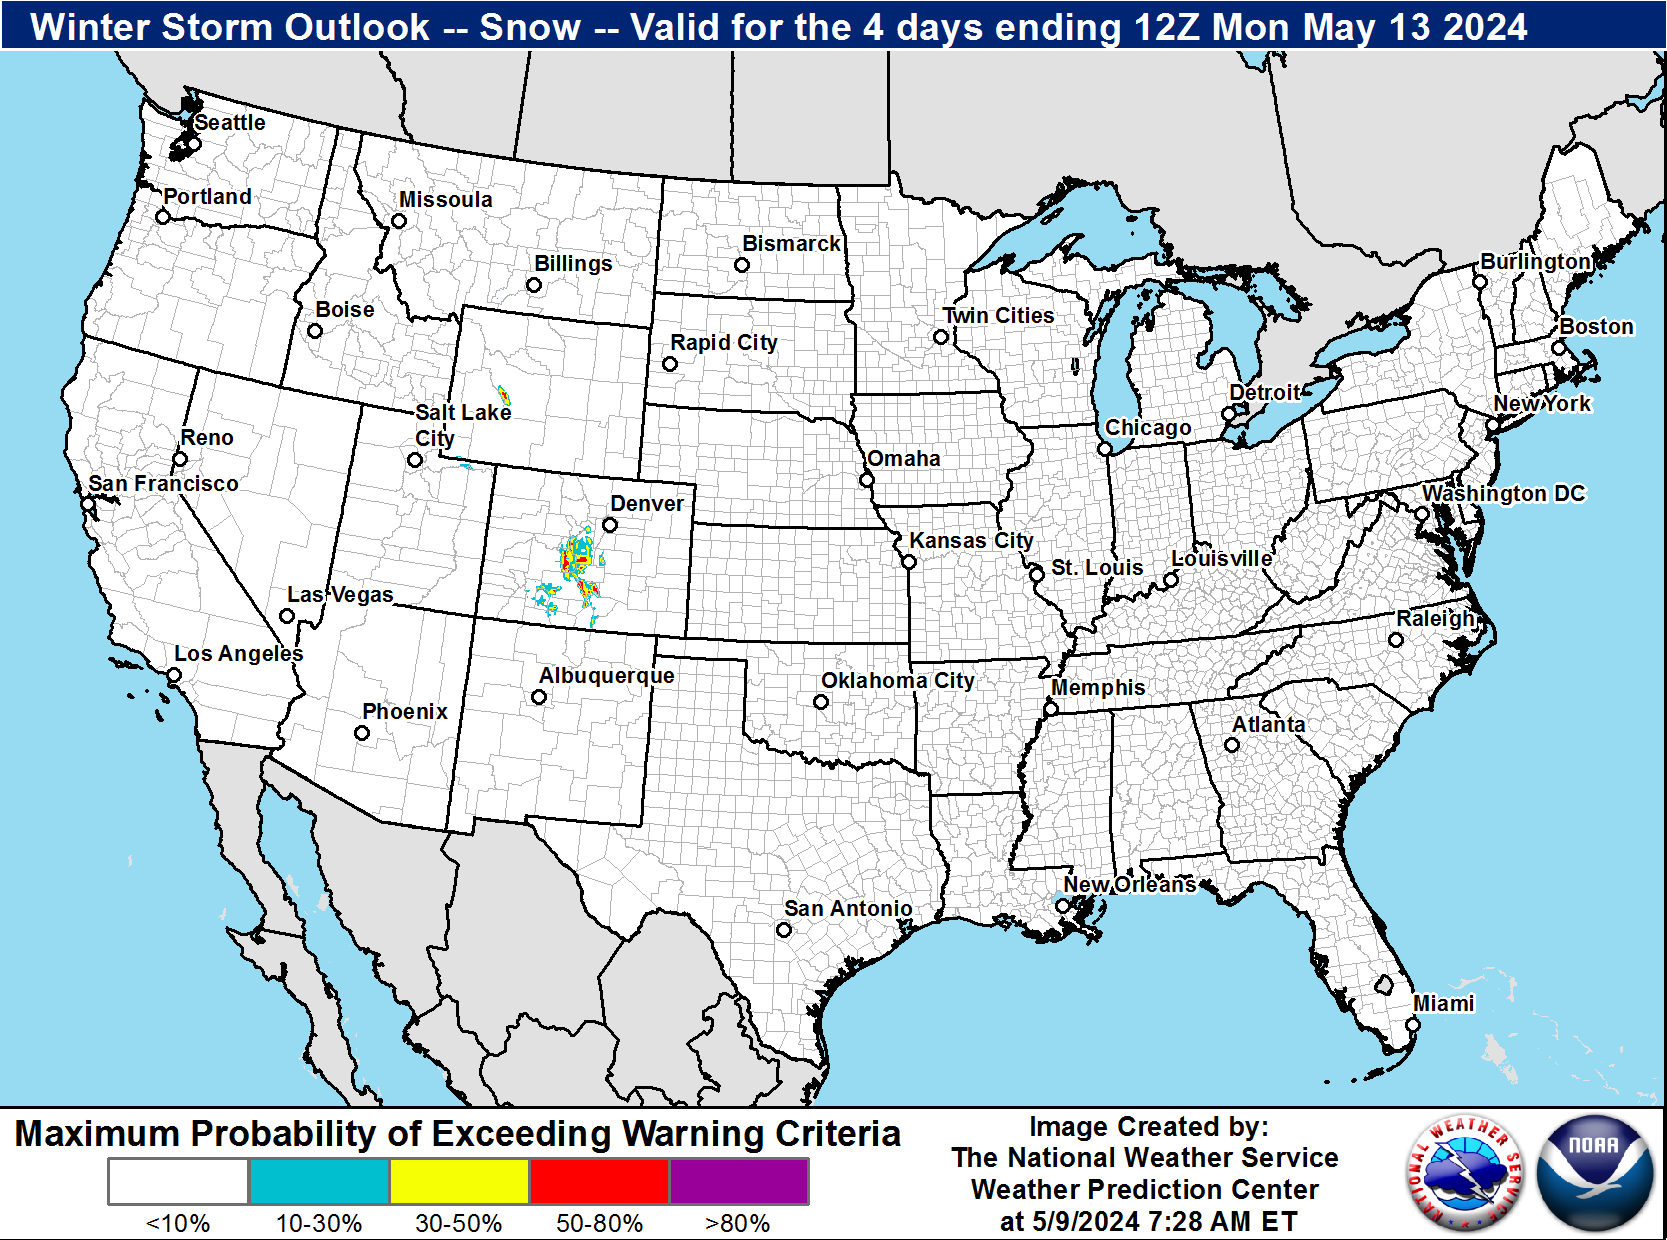
| Winter Storm Severity Index (WSSI) | Winter Storm Outlook (WSO) |
|---|---|
 |
 |
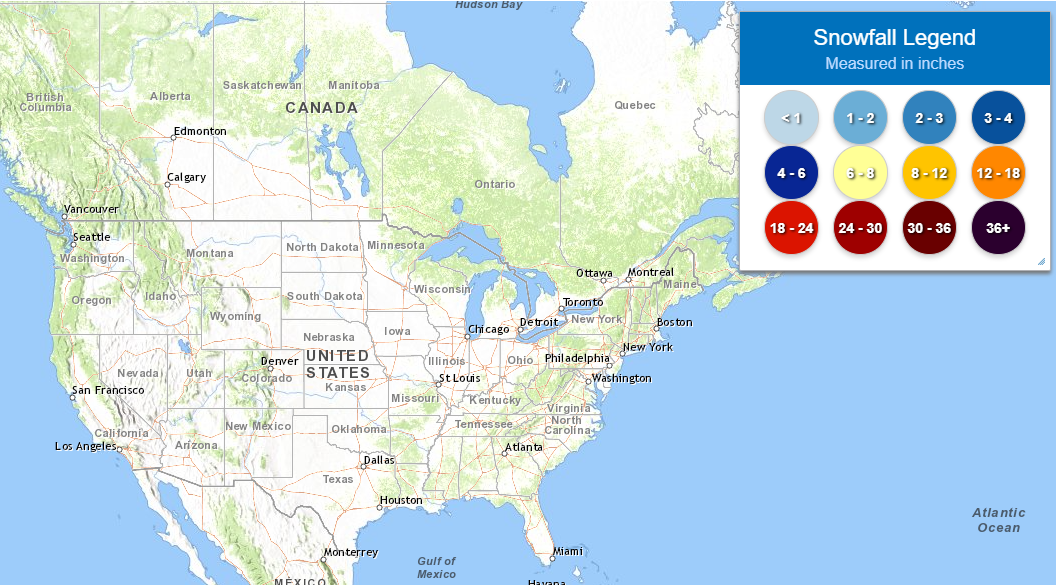
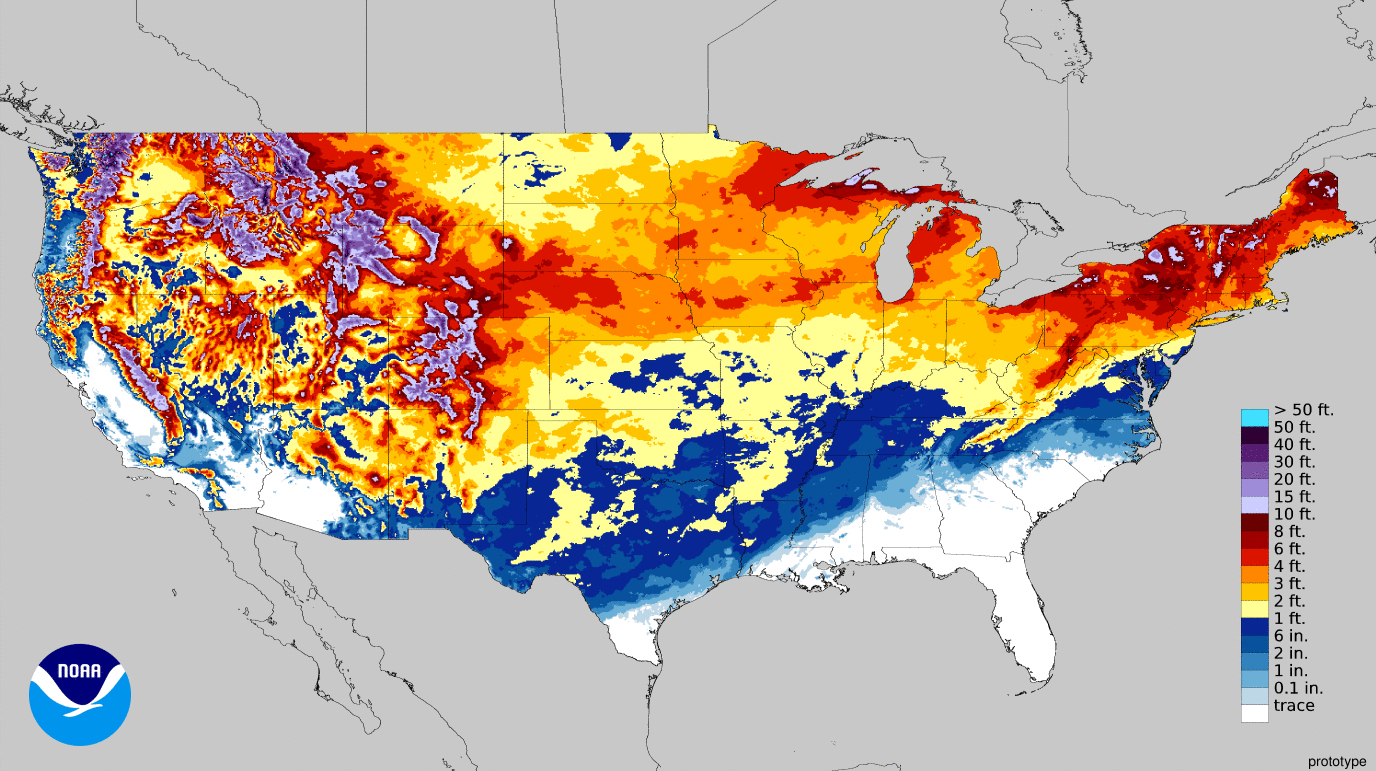
| National Snow Reports | National Snowfall Analysis |
|---|---|
 |
 |
| National Ice Reports | Local Snow Reports |
|
|
|
| Days 4-7 Winter Weather Outlook | |
| Day 4 Winter Weather Outlook | Day 5 Winter Weather Outlook |
 |
 |
| Day 6 Winter Weather Outlook | Day 7 Winter Weather Outlook |
 |
 |
|
|
|
| CPC Week-2 Experimental Heavy Snow Risk | |
 |
|
| CPC Temperature & Precipitation Maps | |
|
Days 6-10 |
|
| Temperature | Precipitation |
 |
 |
|
Days 8-14 |
|
| TEMPERATURE | PRECIPITATION |
 |
 |
|
Week 3-4 |
|
|
TEMPERATURE |
PRECIPITATION |
 |
 |
| Snow Amount Potential
Experimental - Leave feedback
|
|
| Expected 72 Hour Snowfall - Official NWS Forecast
What's this? |
High End 72 Hour Amount 1 in 10 Chance (10%) of Higher Snowfall What's this? |
| Low End 72 Hour Amount 9 in 10 Chance (90%) of Higher Snowfall What's this? |
|
| Percent Chance That 72 Hour Snow Amounts Will Be Greater Than...
Experimental - Leave feedback
What's this?
|
||||||||||||||||
|
||||||||||||||||
| 72 Hour Ice Accumulation Potential
Experimental - Leave feedback
|
|
| Expected 72 Hour Ice Accumulation - Official NWS Forecast
What's this? This is the elevated flat surface ice accumulation. It is not radial/line ice. Radial/line ice is typically 39% of the elevated flat surface ice. For more information on this, see this module. |
High End 72 Hour Amount 1 in 10 Chance (10%) of Higher Ice Accumulation What's this? |
| Low End 72 Hour Amount 9 in 10 Chance (90%) of Higher Ice Accumulation What's this? |
|
| Percent Chance That 72 Hour Ice Accumulations Will Be Greater Than...
Experimental - Leave feedback
What's this?
|
||||||||||||||||
|
||||||||||||||||
| Snow Character (Wet/Dry)
Prototype: These tools are NOT operationally supported.
What's this?
|
 |
| Snow Rate
Prototype: These tools are NOT operationally supported.
What's this?
|
 |
| Selected City Charts | |
Expected Snowfall - Box and Whisker Plot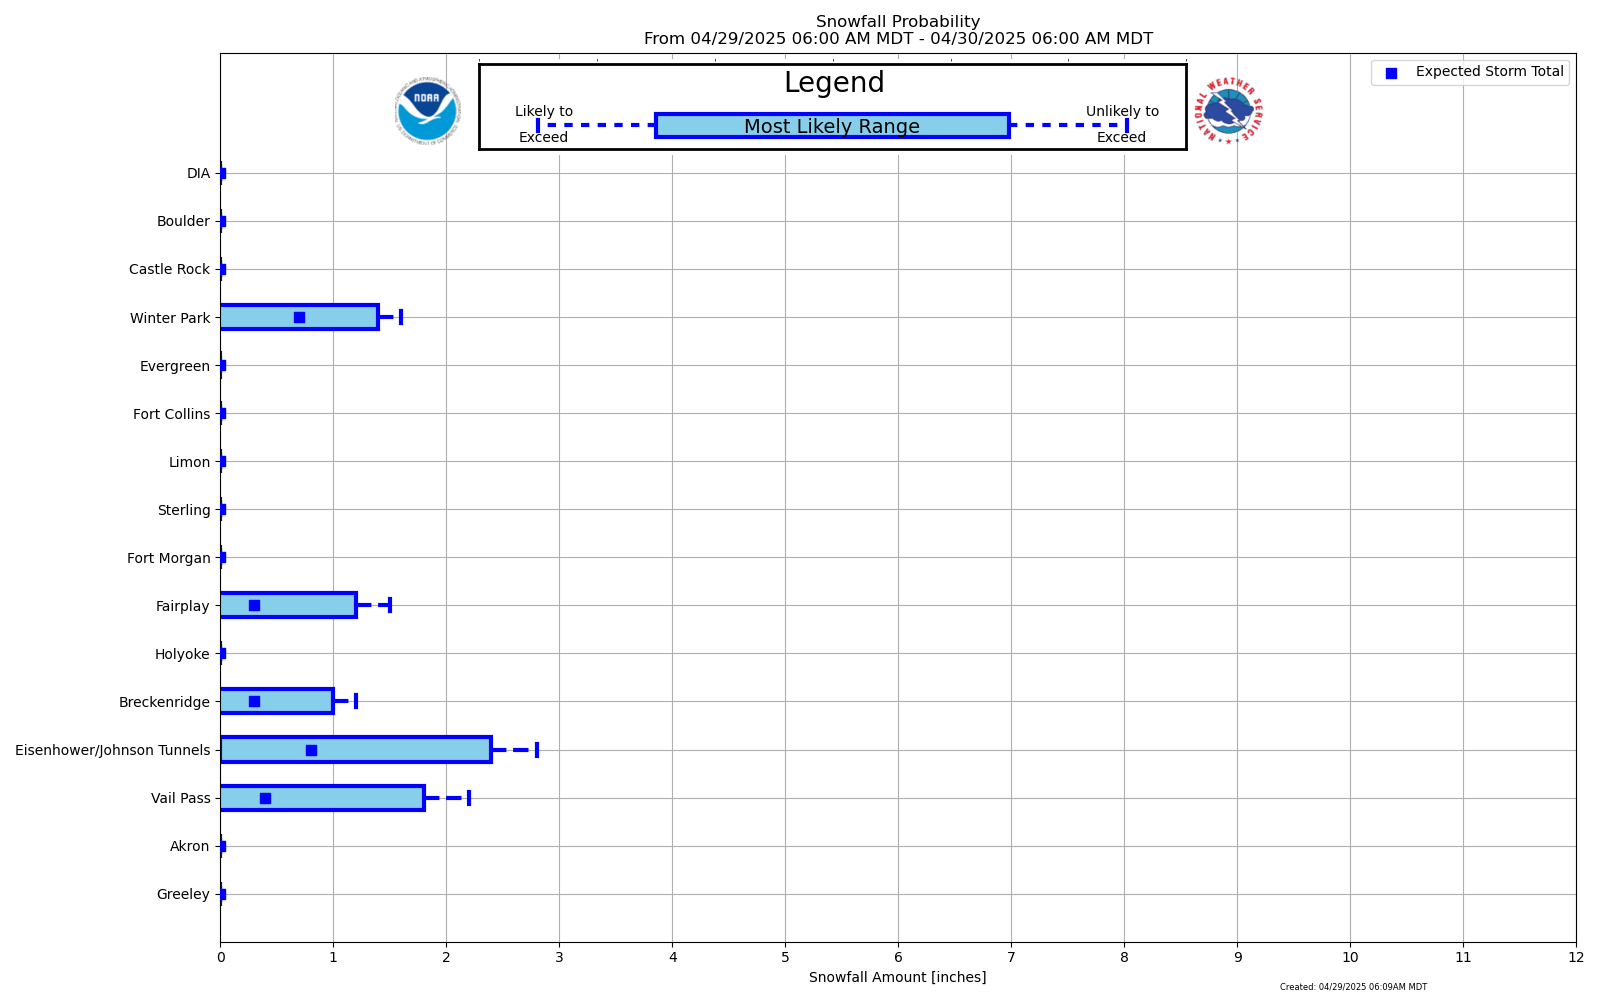 |
Expected Snowfall - Exceedance Bar Plot |

