National Weather Service United States Department of Commerce

Heavy Rain and Flash Flooding in the West; Heat Expands in the Central U.S.

Monsoonal moisture will produce showers and thunderstorms with heavy rain over parts of the Southwest, Great Basin, and Central Rockies through Monday. Flash flooding is possible, especially in and around burn scars and in areas of steep terrain. Heat will persist across the Central U.S. early this week, spreading into the Ohio Valley and Mid-Atlantic later this week. Read More >

Click a location below for detailed forecast.

Last Map Update: Tue, Sep 1, 2026 at 10:30:13 am CDT

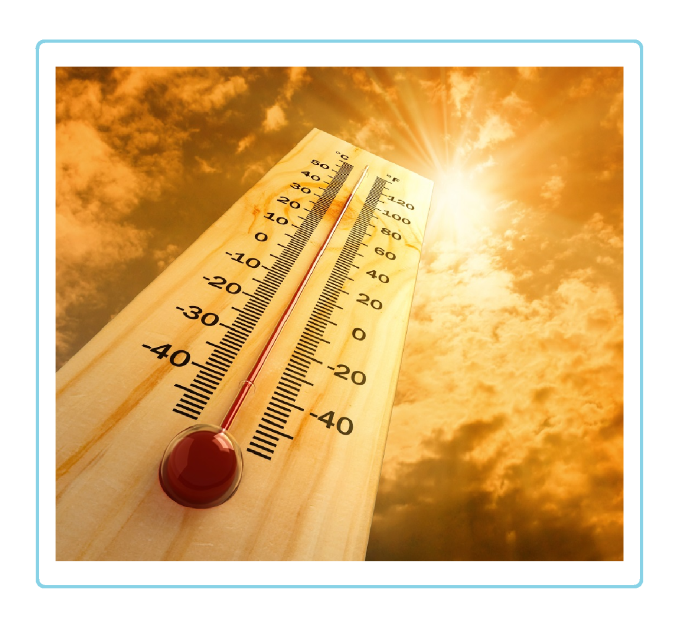
The high pressure remains across the region today. However it has shifted more to the east. This will keep the panhandles hot with highs in the 90s to 100s. There will be a low to medium chance for rain showers and thunderstorms mainly in the northwestern panhandles. The threats from the storms will be lightning, gusty outflow winds, and brief heavy rain.
Where 2026 Ranks in Amarillo Climate History: #2 Most 100°F Days on Record: As of Aug 30th, Amarillo had logged 38 days at or above 100°F. This moved 2026 into 2nd place all-time, trailing only the historic 2011 season (50 days). September 100°F Days are Rare (But Becoming More Frequent): Amarillo has only seen its final 100-degree day of the season occur in September 13 times in recorded history—though 7 of those have occurred since 2000. Latest on Record: The latest 100-degree day ever recorded in Amarillo occurred just two years ago on September 19, 2024. Stay hydrated, practice heat safety during peak afternoon hours, and keep an eye on the forecast as we watch for potential cooling relief later in the month! 🥤🧢
We know how frustrating these persistent dry conditions have been for our local communities. While we have seen a little rain recently, the hard reality is that we are still in the middle of a significant drought. Given the severity of the current drought, the question has been posed to to us, is this drought as bad as 2011? The answer to that question is no, and yes. Let's break down where we stand historically by looking at the data and explain what we mean. The Big Picture: 2026 vs. 2011 As you can see in the Comparing Droughts - 2026 Versus 2011 image, there are some key differences—and similarities—between our current situation and the historic drought of 2011. The 2011 Drought: This period featured a massive, concentrated area of Exceptional Drought (D4) spread across Texas, Oklahoma, New Mexico, and Louisiana. The most severe conditions were much more widespread when compared to where we stand today with the 2026 drought. Importantly, 2011 was still in an early stage of a multi-year La Niña which lasted into early 2012. From there ENSO conditions remained more neutral The 2026 Drought: Currently, we are seeing smaller pockets of Exceptional Drought (D4) that are focused primarily on the Rockies, the Panhandles, and Oklahoma. If you are located in one of these smaller pockets, for you the current drought may be comparable to 2011 on a local scale. That said, we are currently transitioning into a strong El Niño which hopefully suggests better potential for improving conditions moving forward than what would have been expected in the late summer of 2011. Local Impact: Historically Dry Starts Even with a few recent rainfall, the numbers shown in Top 5 Driest starts to the year paint a stark picture of just how parched the region has been this year. Amarillo: The recent rainfall will have only pushed Amarillo to #3 on the list of driest starts to the year through August, assuming we don't get any additional measurable rainfall through August 31st (which is likely). This is a one spot improvement from where we stood a few weeks back when Amarillo was solidly 2nd in the ranking. For context, the driest start was 2011 with just 2.70 inches by August 31st. Dalhart: 2026 still ranks as the 2nd driest start to the year (dating back to 1948) with just 4.06 inches of precipitation. Similar to Amarillo, 2011 holds the #1 spot at a mere 2.76 inches. Again, rainfall at Dalhart is unlikely before the end of the month. We will keep watching the transition into El Niño and hoping it brings some much-needed sustained relief to the Panhandles.

Text Product Selector (Selected product opens in current window)


Current Observations ( )
Location Sky/Weather Temp (°F) Dewpt (°F) RH (%) Wind (mph) Pressure (inHg) Remarks
 Amarillo
N/A
N/A
N/A
N/A
N/A
N/A
N/A
 Borger
N/A
N/A
N/A
N/A
N/A
N/A
N/A
 Canadian
N/A
N/A
N/A
N/A
N/A
N/A
N/A
 Dalhart
N/A
N/A
N/A
N/A
N/A
N/A
N/A
 Dumas
N/A
N/A
N/A
N/A
N/A
N/A
N/A
 Guymon
N/A
N/A
N/A
N/A
N/A
N/A
N/A
 Hereford
N/A
N/A
N/A
N/A
N/A
N/A
N/A
 Pampa
N/A
N/A
N/A
N/A
N/A
N/A
N/A
 Perryton
N/A
N/A
N/A
N/A
N/A
N/A
N/A
 Amarillo 9NNE
N/A
N/A
N/A
N/A
N/A
N/A
N/A
 Amarillo 7SSE
N/A
N/A
N/A
N/A
N/A
N/A
N/A
 Bootleg 11WNW
N/A
N/A
N/A
N/A
N/A
N/A
N/A
 Canadian 6E
N/A
N/A
N/A
N/A
N/A
N/A
N/A
 Clarendon 2WSW
N/A
N/A
N/A
N/A
N/A
N/A
N/A
 Claude 12SW
N/A
N/A
N/A
N/A
N/A
N/A
N/A
 Hereford 2NW
N/A
N/A
N/A
N/A
N/A
N/A
N/A
 McLean 1E
N/A
N/A
N/A
N/A
N/A
N/A
N/A
 Palo Duro SP
N/A
N/A
N/A
N/A
N/A
N/A
N/A
 Pampa 2E
N/A
N/A
N/A
N/A
N/A
N/A
N/A
 Umbarger 3NNE
N/A
N/A
N/A
N/A
N/A
N/A
N/A
Note: "N/A" or "MISG" will be displayed if values are not available. In the LOCATION column, click on links for a list of recent observations at sites of interest. In the WIND column, VRB is "variable" and G is "gust". In the REMARKS column, HX is "heat index", WCI is "wind chill index", and VSB is "visibility" (if shown).


Aviation Drought Fire Weather Hydrology Severe Weather Winter Weather
 
Climate Graphs Hourly Forecast Long Range Local Model Data Precip Maps Heat
 
Education Local Research News Skywarn Weather Calculator Weather Radio