Arkansas-Red Basin
River Forecast Center
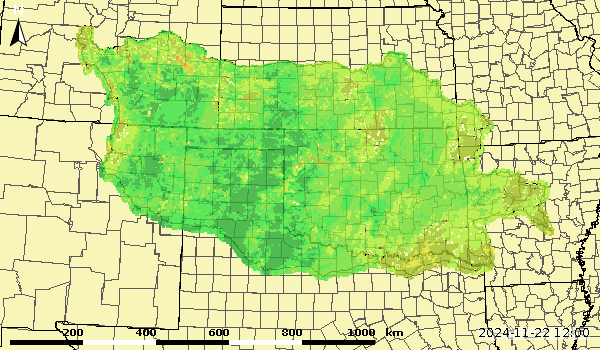
Experimental Gridded Soil Moisture Products
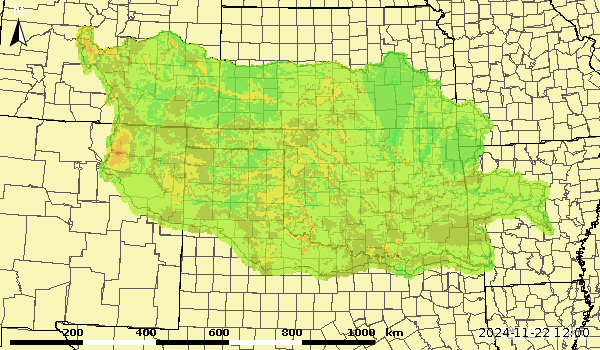
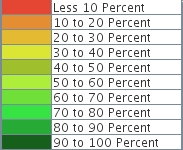
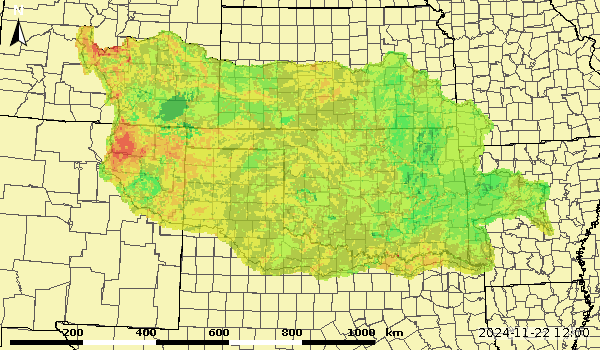
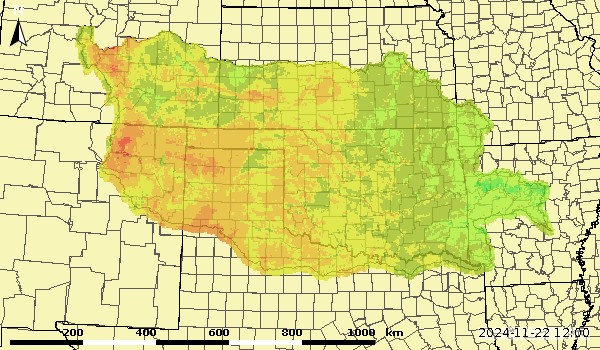
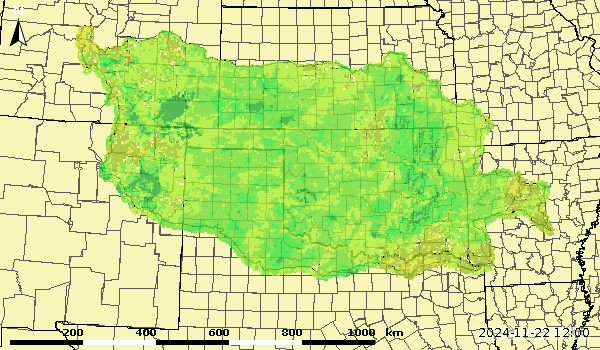
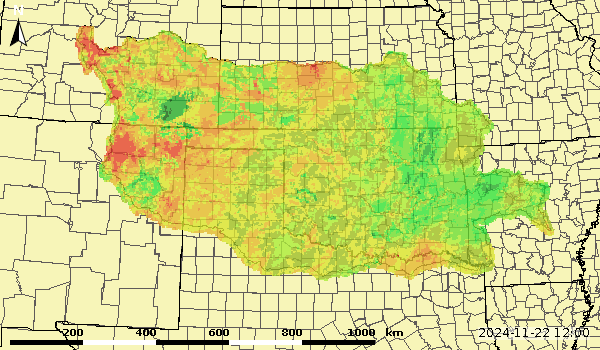
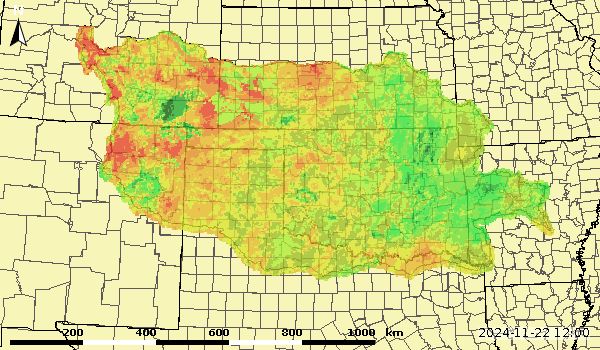
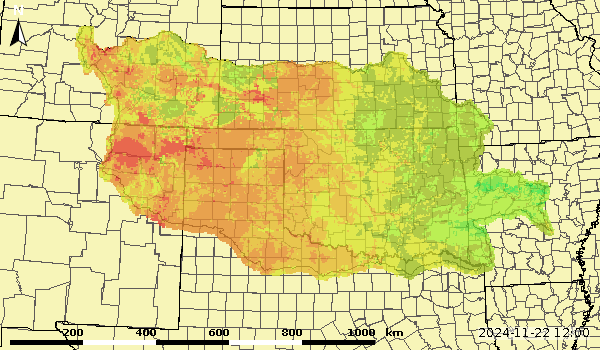
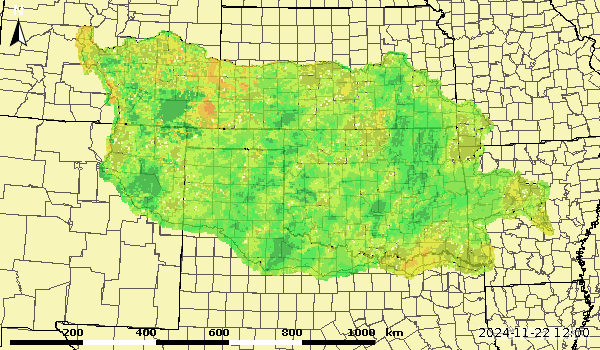
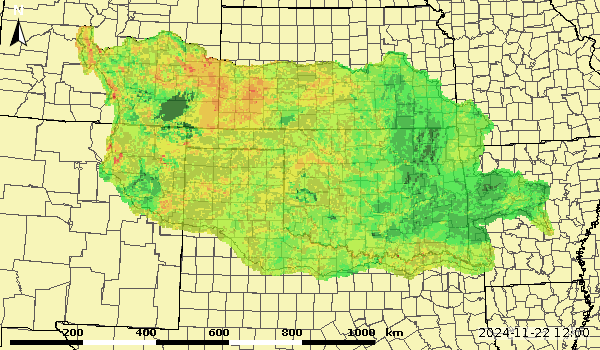
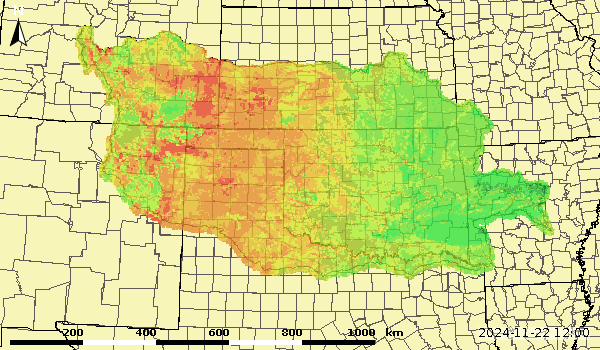
These experimental images are created showing gridded soil moisture at varying depths across the ABRFC area. They are created empirically from our hydrologic model data, and based on a priori grids of the Sac-SMA hydrologic distributed model used at ABRFC. They are not directly based on any measured data, but derived from soil types, land use, and antecedent precipitation.
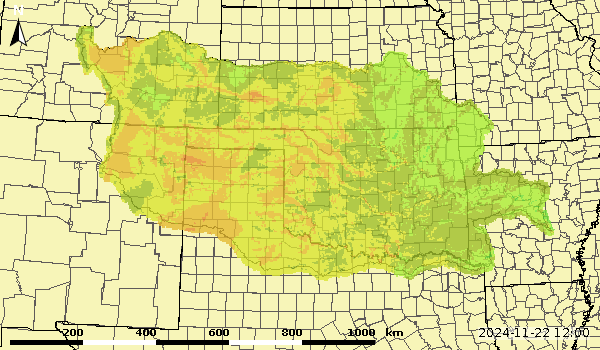
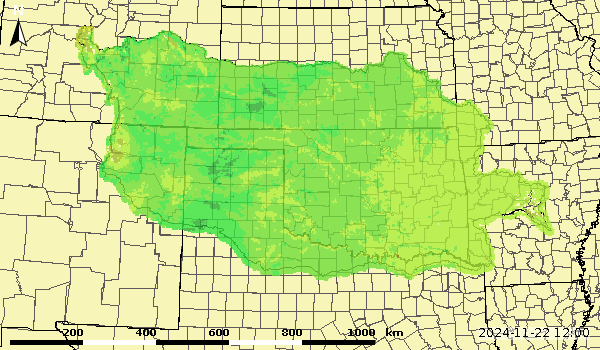
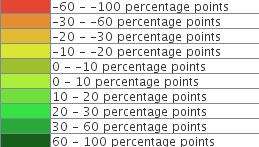
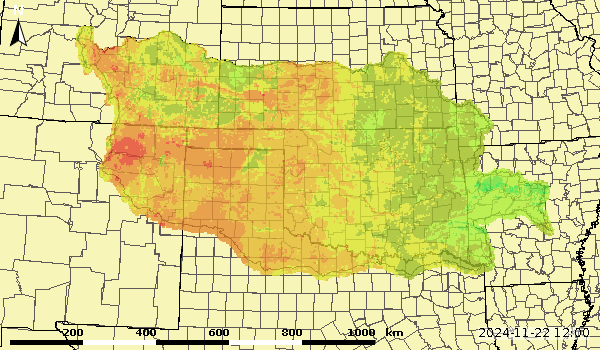
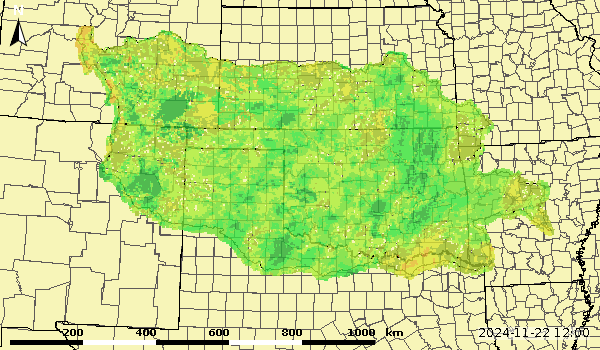
Normals are based on a 20 year climatology (1996-2015). The Difference Graphics take the current percent saturation and subtracts the normal percent value to try to show a deviation from normal. This may be helpful to see areas that are abnormally dry or wet.
Click on each image for a closer look.
File created: 2026-02-02 16:15Z
| 0.1 Meter Soil Moisture Percent Saturation | 0.1 Meter Soil Moisture Normal Percent Saturation | 0.1 Meter Difference (Current - Normal) |
| 0.3 Meter Soil Moisture Percent Saturation | 0.3 Meter Soil Moisture Normal Percent Saturation | 0.3 Meter Difference (Current - Normal) |
| 0.6 Meter Soil Moisture Percent Saturation | 0.6 Meter Soil Moisture Normal Percent Saturation | 0.6 Meter Difference (Current - Normal) |
| 0.75 Meter Soil Moisture Percent Saturation | 0.75 Meter Soil Moisture Normal Percent Saturation | 0.75 Meter Difference (Current - Normal) |
| 1.5 Meter Soil Moisture Percent Saturation | 1.5 Meter Soil Moisture Normal Percent Saturation | 1.5 Meter Difference (Current - Normal) |
US Dept of Commerce
National Oceanic and Atmospheric Administration
National Weather Service
Arkansas-Red Basin
10159 E. 11th Street, Suite 300
Tulsa, OK 74128-3050
Comments? Questions? Please Contact Us.


