| Severe Weather & Flooding of February 18-19, 2012 |
Severe weather and flooding occurred along the Gulf Coast on 18-19 February 2012 including northern and western portions of the NWS Tallahassee County Warning Area (CWA). Figure 1 shows all of the severe weather reports that came into NWS offices across the region. As can be see in the graphic, the vast majority of the reports were straight line wind damage.
Figure 1. Storm reports relayed to the NWS on 18 February 2012 after 7:00 AM EST (1200 UTC).
WFO Tallahassee issued a total of 17 convective warnings during the event along with several flood warnings/advisories and a couple of special marine warnings. Of the 17 warnings, 13 were verified and there were no unwarned events. The average lead time for the convective warnings was 19-20 minutes. Details on the damage reports received by the office can be found in our summary preliminary local storm report. Figure 2 depicts all of the warnings (polygons) issued by WFO Tallahassee during the event, with severe weather and flooding reports overlaid. The severe reports came in during a roughly 3.5 hour period beginning just after 7:00 PM EST 18 February (0000 UTC 19 February).
Figure 2. Warning polygons issued by WFO Tallahassee on 18-19 February 2012. Severe (yellow), tornado (red), flood (green), and special marine (purple) warnings are depicted. Locations of reported severe weather and flooding are shown by the icons. Click for a larger view.
Figure 3 shows the synoptic set up for this event. The surface analysis is valid at 6:00 PM EST (2300 UTC) 18 February 2012, and shows low pressure between Mobile Bay and Pensacola, FL. A warm front extends eastward from the low along the northern border of Florida. Figure 4 shows a hodograph derived from the KMOB VAD wind profile a few hours earlier when the low was still southwest of Mobile, AL. Clearly there was plenty of environmental shear with this system. However, cool shelf waters over the northeast Gulf of America limited instability (note the lower dew points near the coast). Had this event unfolded later in the season, instability may have been sufficient to result in a significant tornado outbreak in this strongly sheared environment.
Figure 3. Objective surface analysis showing isobars in white and isodrothotherms in red. Surface observations are in yellow.
Figure 4. Hodograph derived from the KMOB VAD wind profile valid 3:00 PM EST (2000 UTC) 18 February 2012.
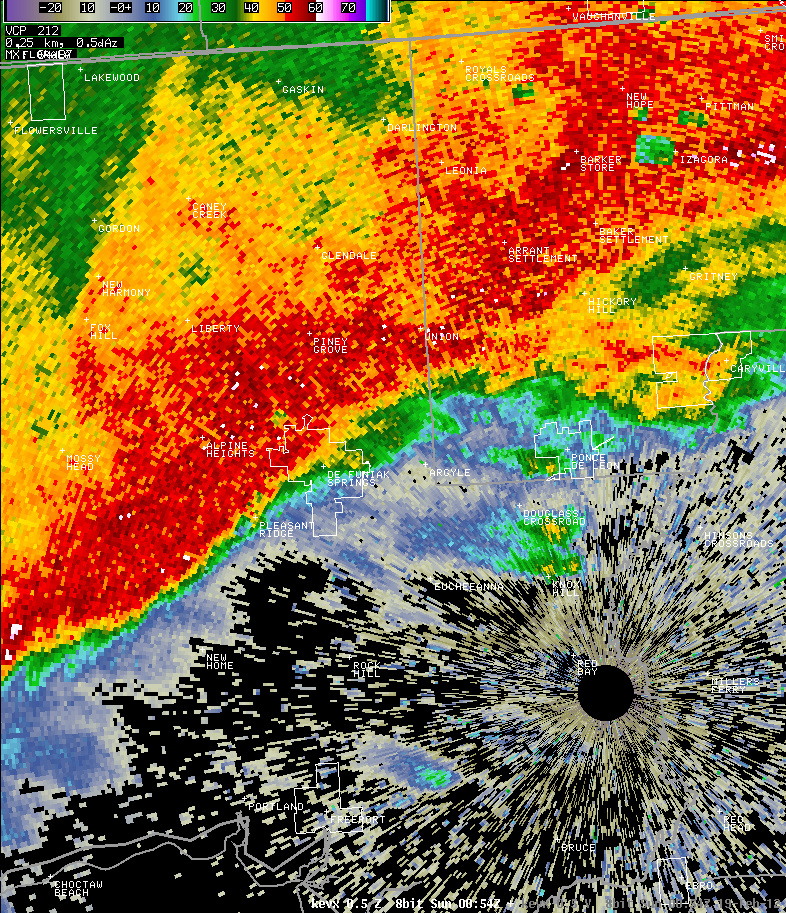
Severe weather reports began streaming into the office shortly after 7:00 PM EST (0000 UTC). Figure 5 shows radar imagery from the KEVX radar as a line of severe storms crossed Walton County, FL. Note the 45- to 50-knot inbound velocities to the southwest of De Funiak Springs, FL. A trained spotter estimated a 60-mph wind gust near the De Funiak Springs airport about four minutes prior to this radar scan.
 |
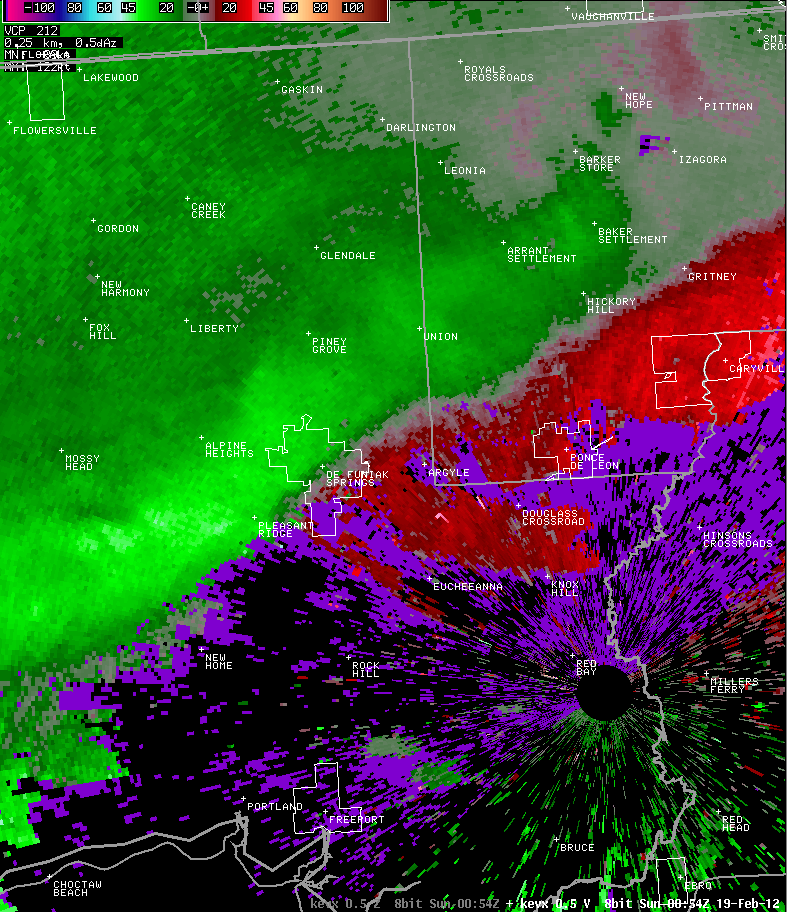 |
Figure 5. Radar imagery from the Eglin AFB (KEVX) Doppler radar valid 7:54 PM EST 18 February 2012 (0054 UTC 19 February). Base reflectivity is depicted in the left panel with base velocity to the right.
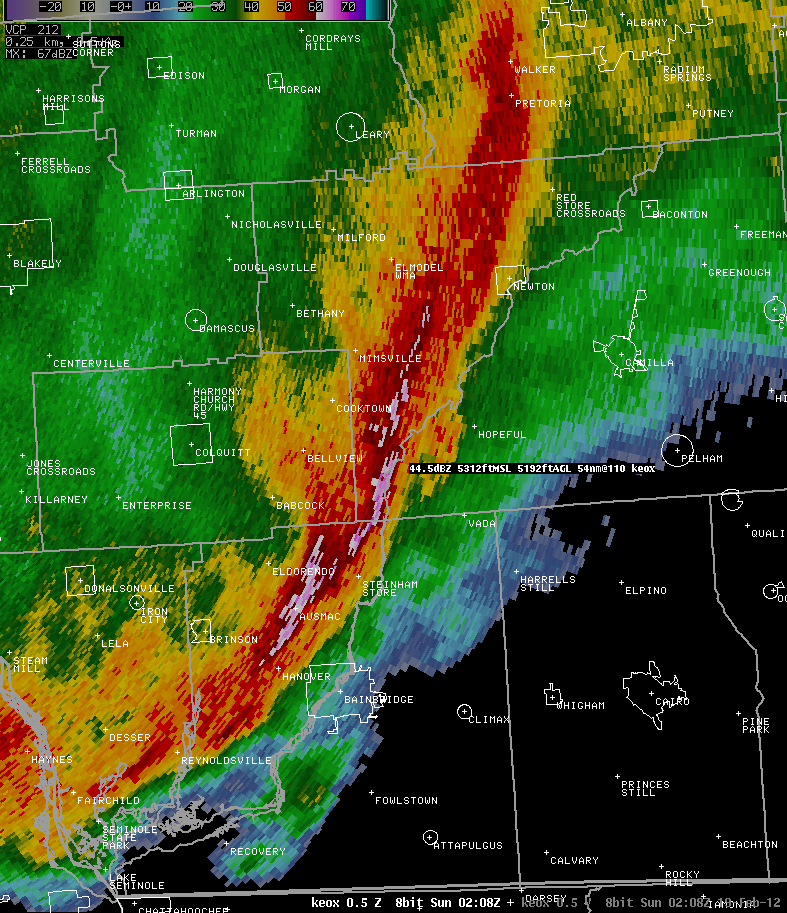
Figure 6 shows radar imagery from the KEOX radar as a line of severe storms crossed Southwest Georgia. Note the maximum outbound velocity of 61 kt (70 mph) in southern Baker County FL. Figure 7 shows a mobile home that was flipped by severe wind gusts that were estimated to be 70-75 mph. The home was located near GA Highway 253 approximately 4 miles east-southeast of Bellview. The photo is provided courtesy of WALB-TV.
 |
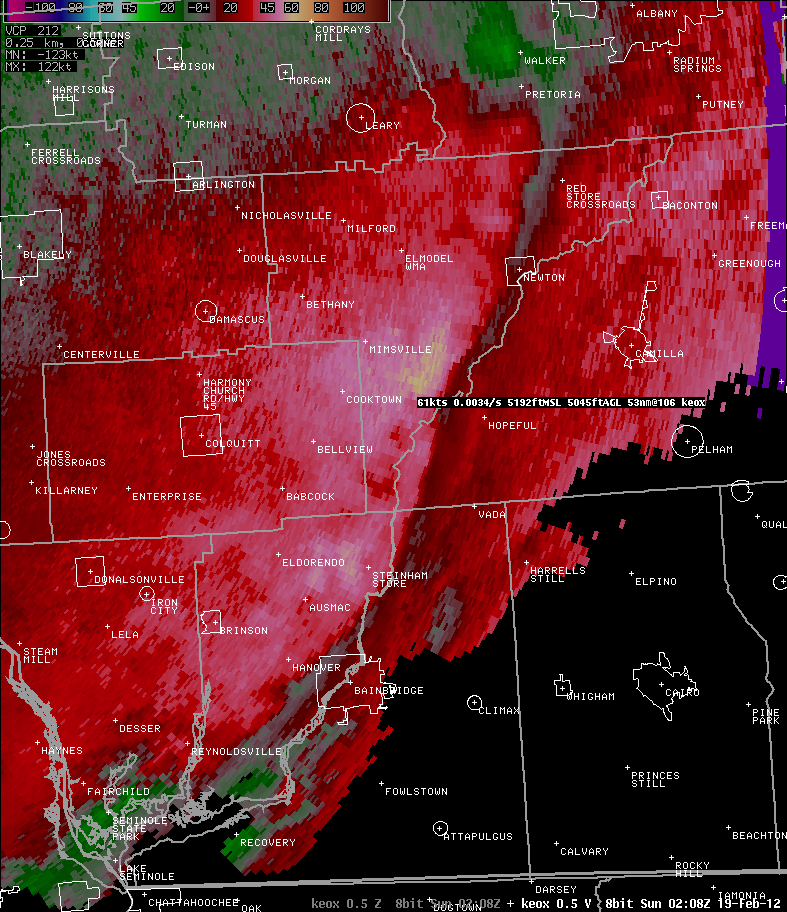 |
Figure 6. Radar imagery from the Ft. Rucker (KEOX) Doppler radar valid 9:08 PM EST 18 February 2012 (0208 UTC 19 February). Base reflectivity is depicted in the left panel with base velocity to the right.
Figure 7. A mobile home in southern Baker County, GA, that was flipped by estimated 70- to 75-mph straight line winds on the evening of 18 February 2012. Photo courtesy of WALB-TV.
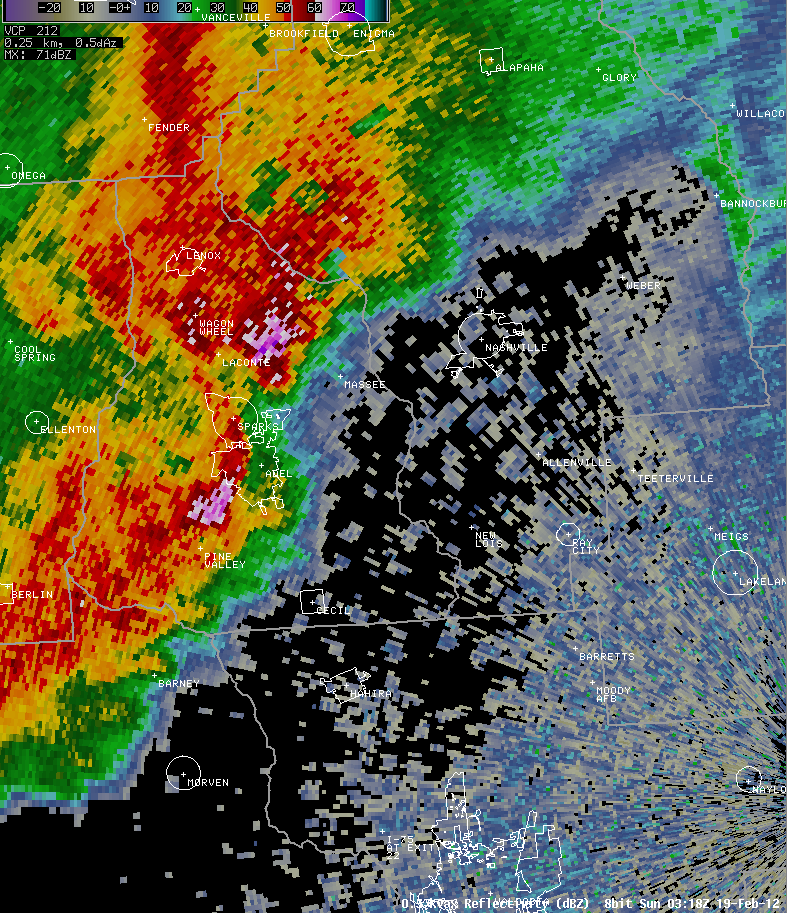
Figure 8 shows an IR satellite image taken at 10:30 PM EST (0330 UTC) showing very cold cloud tops. This was near the end of the severe weather portion of the event. Figure 9 shows radar imagery from the KVAX radar as severe storms crossed south central GA. Note the elevated high reflectivity values (70.5 dBZ just above 17, 000 ft) in the 6.4-degree slice (right panel). Large (golfball size) hail was reported from this cell in Cook and Berrien Counties.
Figure 8. IR satellite picture at 10:30 PM EST (0330 UTC).
 |
 |
Figure 9. Radar imagery from the Moody AFB (KVAX) Doppler radar valid 10:18 PM EST 18 February 2012 (0318 UTC 19 February). Base reflectivity (0.5 degree) is depicted in the left panel with the 6.4-degree slice to the right.
As can be seen in Figure 2, flooding was also a concern during this event. Figure 10 shows the 24-hour rainfall observed across the forecast areas ending 8:00 AM EST (1300 UTC) Sunday. Large portions of the northern and western portion of the forecast area received 2-3 inches of rain with a band of higher rainfall totals, in the 4- to 5-inch range, observed across inland portions of the Florida Panhandle, roughly along and just north of Interstate 10. A sample of some of the higher rainfall totals observed during this event can be found in this aforementioned local storm report. Flooding was reported in Geneva, AL; Chipley, Cottonwood, and Tallahassee, FL; and Albany and Tifton, GA. Fortunately, very dry antecedent conditions precluded any riverine flooding across the area.
Figure 10. 24-hour accumulated precipitation across the WFO Tallahassee service area ending 8:00 AM EST (1300 UTC) 19 February 2012.
Page created by Mark Wool. Thanks go to Don Van Dyke and Alex Lamers for the warning verification information.