| Warm March | Record Summer Heat | Drought Info Statement |
March 2012 was a record month at Indianapolis, becoming the warmest March on record. March 2012 was the first month to set a high average temperature record since August of 1936. Persistent high pressure across the eastern USA allowed a southerly flow of warm air to continue through a long stretch of the month.
During the unseasonably warm weather that began March 12 and continued through March 22, temperatures each day averaged more than 20 degrees above normal. Most days during this period were more typical of late May and early June, or similar to March weather in Tampa, Florida.
Because of the warm winter and the sudden onset of extended early summer weather, vegetation sprang to life overnight. Early spring flowers bloomed very quickly and faded in a couple of days. Tulips, lilacs, flowering bushes and trees were in full bloom during the last week of March. Many trees were budding including oaks. Lawn mowers were heard everywhere as grasses grew quickly. The outdoors was typical of early May than late March.
Daily temperature records were set on 7 days out of an 8 day stretch. For the 11 day period from March 12 through March 22 the average temperature was 68.5 degrees ... 4.2 degrees above the 11 day record warmth of March 21-31, 2007. Additionally, this was the warmest 11 day stretch to begin a year before the date of April 20.
The average temperature for March 2012 exceed the record average temperature of March 1910 by more than 4 degrees. To quote what Weather Bureau officials stated in March 1910, "Never since the Weather Bureau was established has there been such an early opening of spring." This statement may become true for Indiana, the Midwest and much of the eastern continental United States for March 2012.
The U.S. Weather Bureau became the National Weather Service in 1970. Weather records at Indianapolis began in 1871.
List of Records set at Indianapolis in March 2012:
| Date |
New Max Temperature Records |
New High Minumum Temperature Records |
| March 14 |
81 |
|
| March 15 |
80 |
|
| March 17 |
77 |
|
| March 18 |
80 |
Tied record, 60 |
| March 19 |
82 |
64 |
| March 20 |
83 |
63 |
| March 21 |
84 |
62 |
Other records set in March for Indianapolis:
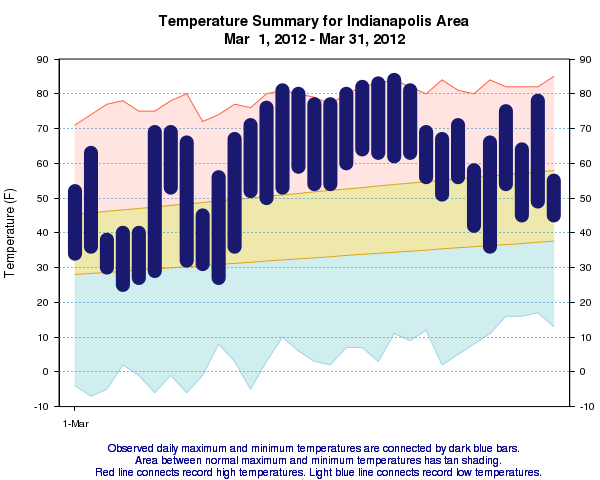
The all time record high temperature for March is 85 degrees, set on March 31, 1981. The highest reached in March 2012 was 84 degrees, recorded on the 21st.
Below is a plot of daily temperatures for March 2012 at Indianapolis:
Continuing the trend seen in the Spring, the beginning of Summer saw much above normal temperatures. In addition, very dry conditions developed across central Indiana. The hot and dry conditions continued through July, but temperatures cooled, and rain returned for August. Read below for monthly highlights
Temperature Information (precipitation information is farther down the page)
By the end of June, Indianapolis had set a new record for the highest temperature in June. Temperatures topped the 100 degree mark twice in June, the most since 1934.The month of June was also the driest June on record at Indianapolis and was the second driest month overall.
Below are some facts for the heat wave and its impact on records in June:
The earliest the temperature has ever reached 100 degrees at Indianapolis was June 2, 1934. The all time record high for Indianapolis for any month is 106 degrees. The last occurrence of 105 and 106 degree readings was on July 14, 1936.
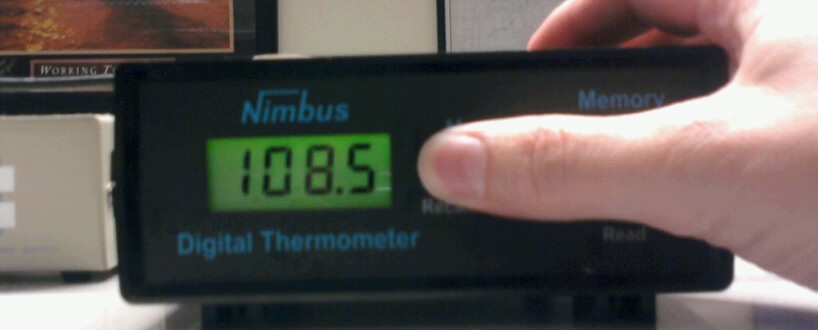
High temperature at the Indianapolis NWS Forecast Office on June 28.
The official high temperature of 104 degrees was recorded at the Indianapolis International Airport.
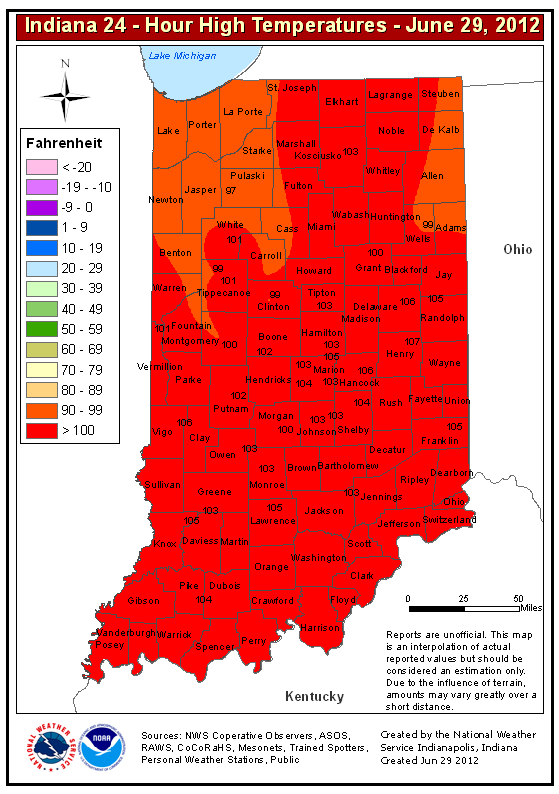
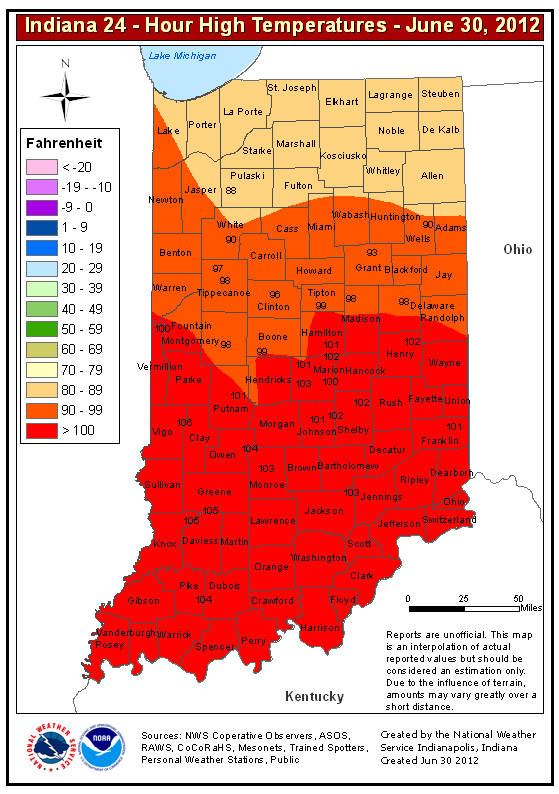
Below are high temperatures for June 28 and June. Click to enlarge.
 |
 |
|
High Temperature Map for June 28 (Note: Map was made early on June 29 and includes data for the previous 24 hours) |
High Temperature Map for June 29 (Note: Map was made early on June 30 and includes data for the previous 24 hours) |
July
Hot temperatures continued into July. At Indianapolis, July 2012 became the warmest month on record for the city. In addition, a record was set regarding high temperatures. For the 23 day period beginning June 27, the average high temperature at Indianapolis was 97.3 degrees. This breaks the previous record from 1936 by 1 degree. Also, the low temperature at Indianapolis remained at 70 or above for 22 consecutive days, setting a new record.
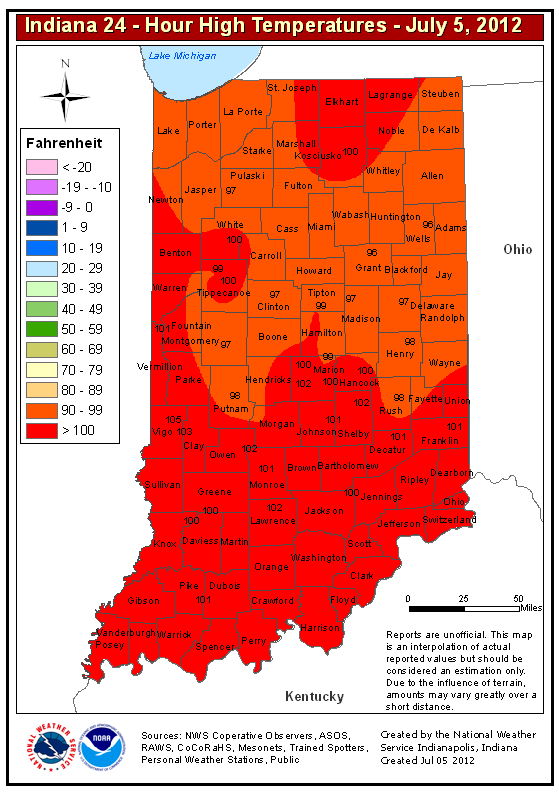
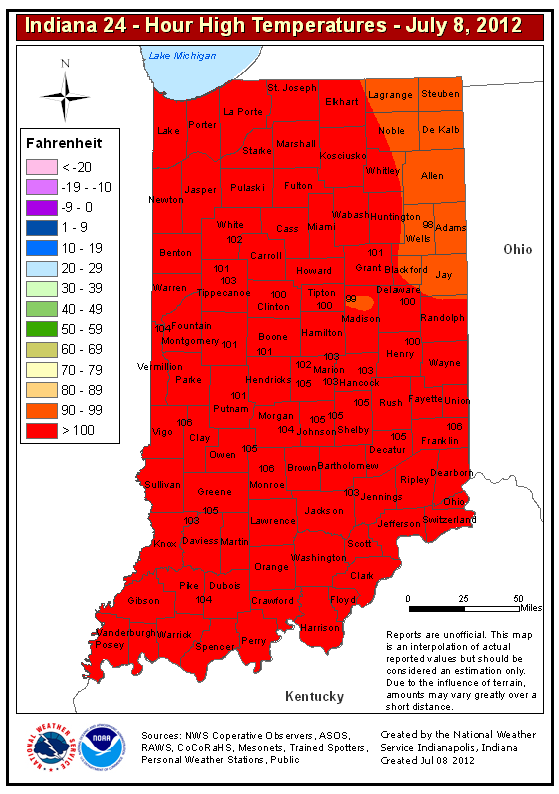
The 4th of July at Indianapolis was the second warmest 4th of July on record, topping out at 102 degrees. The record for Indianapolis for Independence Day is 103 degrees. Just a few days later, temperatures came within one degree of tying the all time record high for Indianapolis. On July 7 the high was 105 degrees. Below are maps of high temperatures for Indiana for July 4 and 7, click to enlarge.
 |
 |
|
High Temperature Map for July 4 (Note: Map was made early on July 5 and includes data for the previous 24 hours) |
High Temperature Map for July 7 (Note: Map was made early on July 8 and includes data for the previous 24 hours) |
August
August started out warm with some locations reaching 100 degrees, but big changes came after the first third of the month. The middle third of the month averaged below normal, before near or above average temperatures returned for the last third of the month.
The string of consecutive 80 degree or higher maximum temperatures at Indianapolis was broken on August 10, when the high only reached 77 degrees. The string of 64 days that began on June 7 is the second longest stretch of consecutive 80 degree or higher maximum temperatures for Indianapolis, second only to the 86 day stretch in 2002.
August's temperature and precipitation graphs are below:
June
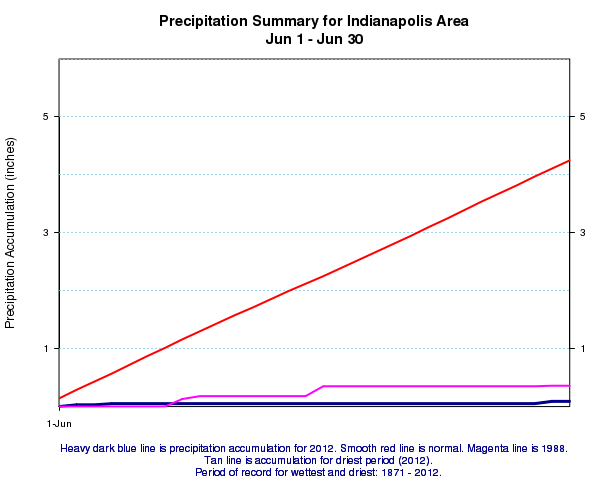
June 2012 is the driest June on record for the Indianapolis area. The total precipitation for the month at the Indianapolis International Airport was 0.09 inches. The average precipitation for June is 4.25 inches. The old record was 0.36 inches in June 1988. June 2012 is also the second driest month on record for the Indianapolis area. The driest month on record is March 1910, with 0.07 inches.
Through June 28, there were 24 consecutive days without measurable precipitation at Indianapolis. This is a record for June and is the longest period without measurable precipitation since the 25 day stretch ending March 4, 1983. This is a relatively rare phenomenon for the Indianapolis area, occurring only 10 other times since records began in 1871. The record number of consecutive days without measurable precipitation is 39 days, set from August 14 -September 21, 1908.
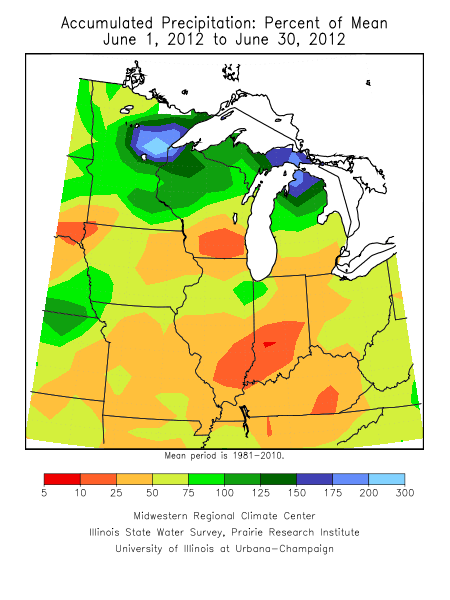
By the end of June, much of central Indiana was classified as in a severe drought,with parts of the area in an extreme drought.
Below is a graph of June rainfall, showing average, 2012, and 1988's rainfall. Below that is a plot of June's precipitation for the Midwest in terms of percent of normal (image courtesy of the Midwest Climate Center). July's information follows the images:
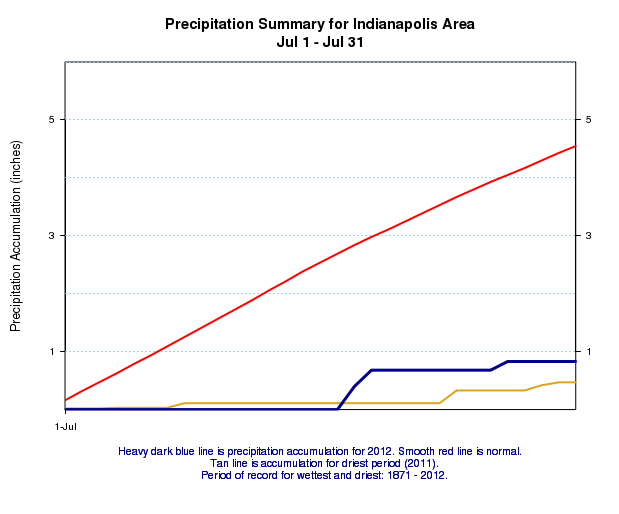
July
Indianapolis set a record for longest dry spell. For the period of June 1 to July 17, Indianapolis received only 0.09 inches of precipitation. This broke the record of 45 days set in 1908. Also, no measurable precipitation fell at Indianapolis for the first 17 days of July, This was the driest start to any July on record. After some rain fell later in the month, July 2012 tied for the 6th driest July on record for the Indianapolis area.
Below is a plot of July rainfall at Indianapolis, showing average, 2012, and 2011's rainfall. (July 2011 was the driest July on record).
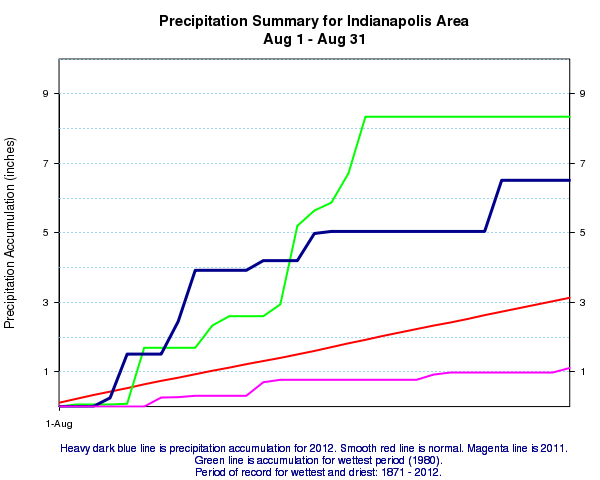
August
August saw the return of abundant rainfall to parts of central Indiana, including Indianapolis. August 2012 is the 8th wettest August on record at Indianapolis.
Below is a plot of August rainfall at Indianapolis, showing average, 2012, 2011, and 1980's rainfall. (August 1980 was the wettest August on record).
Below is a Drought Information Statement from August 1, 2012:
DROUGHT INFORMATION STATEMENT
NATIONAL WEATHER SERVICE INDIANAPOLIS IN
1159 AM EDT WED AUG 1 2012

...DROUGHT INFORMATION STATEMENT FOR MUCH OF CENTRAL AND SOUTHERN
INDIANA...

.SYNOPSIS...

SEVERE TO EXCEPTIONAL DROUGHT CONDITIONS EXISTED IN MUCH OF CENTRAL
AND SOUTHERN INDIANA FOR THE WEEK ENDING JULY 24 ACCORDING TO THE
U.S. DROUGHT MONITOR.  THIS IS A RESULT OF WARM WEATHER SINCE THE
MIDDLE OF MARCH AND PROLONGED DRYNESS SINCE APRIL 1.

EXCEPTIONAL DROUGHT CONDITIONS PREVAILED ACROSS 20 PERCENT OF
INDIANA.  THIS INCLUDED MUCH OF CENTRAL AND SOUTHWEST INDIANA
BOUNDED BY THE WABASH RIVER TO THE WEST...INTERSTATE 74 TO THE NORTH
AND INTERSTATE 65 TO THE EAST.  DROUGHT CONDITIONS IN MUCH OF THIS
AREA WERE THE WORST IN RECORDED HISTORY.

TOTAL RAINFALL IN MUCH OF THIS AREA FOR THE MONTHS OF JUNE AND JULY
COMBINED WAS LESS THAN ONE INCH DURING AN HISTORIC HEAT WAVE THAT
BEGAN ON JUNE 28 AND CONTINUED INTO EARLY AUGUST.  JULY 2012 WAS THE
WARMEST MONTH OF RECORD...WITH NEARLY EVERY DAY REACHING 90 DEGREES
OR HIGHER.  THIS AREA HAS EXPERIENCED 9 TO 15 DAYS OF 100 DEGREE
WEATHER SINCE JUNE 28.

SUMMARY OF IMPACTS...

THE IMPACTS OF THIS DROUGHT HAD A LARGE EFFECT ON INDIANA
AGRICULTURE.  NEARLY ALL PASTURE LAND WAS BARREN.  LATE SEASON CROPS
LIKE CORN AND SOYBEANS MAY SEE THEIR WORST YIELDS SINCE THE GREAT
DROUGHT OF 1988...POSSIBLY EVEN LOWER.

HUNDREDS OF WILD FIRES BROKE OUT DURING JULY.  AT LEAST 50 OF THESE
FIRES WERE STARTED BY LIGHTNING ... UNHEARD OF IN INDIANA DURING
JULY.

MANDATORY OUTDOOR WATER RESTRICTIONS REMAIN IN PLACE FOR MUCH OF THE
INDIANAPOLIS AREA.  THE STATE OF INDIANA ISSUED A STATE WIDE WATER
SHORTAGE WARNING...A FIRST.  RECORD LOW WATER LEVELS FOR JULY WERE
IMPACTING POWER COMPANIES.

.CLIMATE SUMMARY...

RAINFALL DEFICITS AS CALCULATED FROM THE BEGINNING OF THE CALENDER
YEAR RANGED FROM 8 TO MORE THAN 12 INCHES BELOW NORMAL THROUGH JULY
31.

                             RAINFALL /INCHES/
LOCATION            SINCE JANUARY 1        DEPARTURE
LAFAYETTE                 12.47*             -9.62*
MUNCIE                    15.82              -8.79
INDIANAPOLIS INTL APRT    15.98             -10.22
TERRE HAUTE               13.12*            -14.55*
BLOOMINGTON               13.41*            -16.26*

*TOTALS MAY NOT BE CORRECT BECAUSE OF MISSING DATA.

PRECIPITATION/TEMPERATURE OUTLOOK...

THE 8-14 OUTLOOK ISSUED JULY 31 INDICATED NEAR NORMAL
TEMPERATURES AND NEAR NORMAL RAINFALL FROM AUGUST 6-14.

.ACKNOWLEDGMENTS...

THE DROUGHT MONITOR IS A MULTI-AGENCY EFFORT INVOLVING THE NATIONAL
WEATHER SERVICE...THE NATIONAL CLIMATIC DATA CENTER...THE U.S.
DEPARTMENT OF AGRICULTURE...STATE AND REGIONAL CENTER CLIMATOLOGISTS
AND THE NATIONAL DROUGHT MITIGATION CENTER.  INFORMATION FOR THIS
STATEMENT HAS BEEN GATHERED FROM THE NATIONAL WEATHER SERVICE AND THE
FEDERAL AVIATION ADMINISTRATION OBSERVATION SITES...STATE COOPERATIVE
EXTENSION SERVICES...THE U.S. DEPARTMENT OF AGRICULTURAL...THE CORPS
OF ENGINEERS AND THE U.S. GEOLOGICAL SURVEY.

$$

