
Catastrophic Super Typhoon Bavi's eyewall has reached Rota and is expected to bring dangerous winds, heavy rainfall and storm surge to Guam, Rota, Tinian and Saipan. A Typhoon Warning remains in effect. Heavy to excessive rainfall will continue to bring a flooding threat from coastal Mid-Atlantic to southern New England through Monday. Read More >
Summer Season (June-August) Key Points:
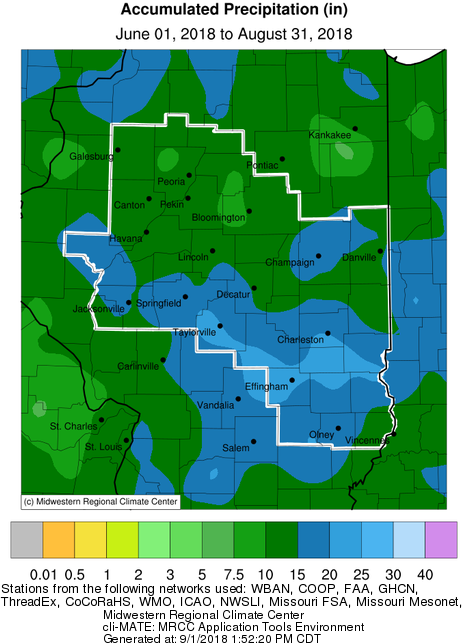
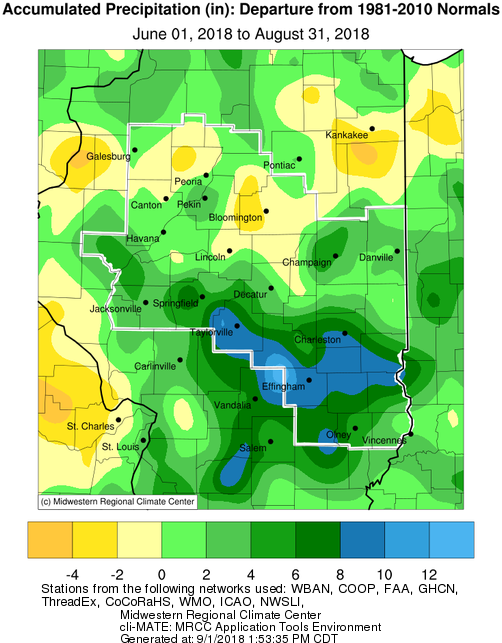
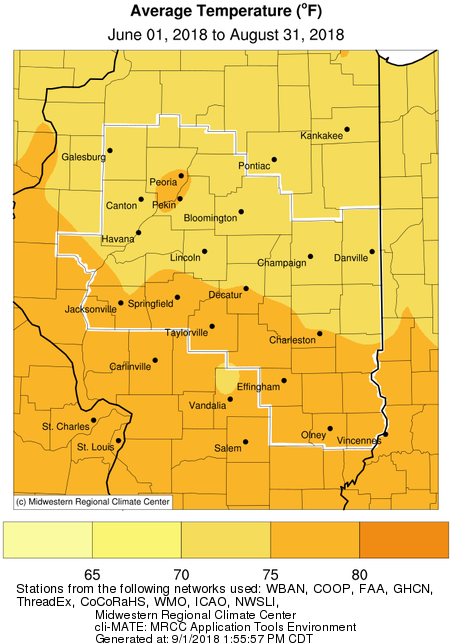
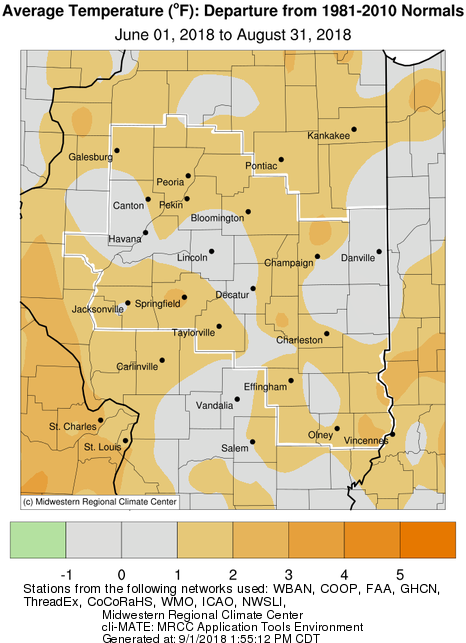
Summer Season Precipitation, Temperature, and Departure from Normal Maps:
Summer Season Climate Data:
|
Site |
Precipitation |
Departure from Normal | Average Temperature |
Departure from Normal | Notes |
|
Charleston |
20.71" | +8.96" | 76.5 | +1.9 | 4th wettest summer |
| Danville |
14.50" |
+1.80" | 74.8 | +1.2 | |
| Decatur |
16.04" |
+3.79" | 75.3 | +0.3 | |
| Effingham |
19.44" |
+8.03" | 76.6 | +1.6 | 6th wettest summer |
|
Flora |
18.56" | +7.13" | 77.2 | +1.8 | |
| Galesburg |
14.25" |
+1.60" | 74.7 | +1.9 | |
|
Havana |
14.06" | +1.90" | N/A | N/A | |
|
Jacksonville |
15.96" | +4.11" | 75.7 | +1.5 | |
| Lincoln | 10.92" | -2.38" | 73.1 | -0.3 | |
|
Normal |
11.23" |
-0.64" | 73.8 | +1.0 | |
|
Olney |
16.46" | +4.74" | 76.0 | +1.0 | |
|
Paris |
12.79" | +0.10" | 73.3 | -0.6 | |
| Peoria |
13.95" |
+3.33" | 75.6 | +1.9 | |
| Springfield |
16.95" |
+5.31" | 76.6 | +2.4 | |
|
Tuscola |
16.33" | +3.87" | 74.5 | +0.5 | |
| Urbana |
15.73" |
+2.76" | 74.7 | +1.2 |
Links below are the seasonal climate summaries for area cities. Only the summaries for Peoria, Springfield and Lincoln are considered "official", meaning they are the station of record for their respective locations. The other summaries are "supplemental", meaning another location in the area is the official climate station for that city.
Climate data for other area cities is available at http://www.nws.noaa.gov/climate/xmacis.php?wfo=ilx
August Key Points:
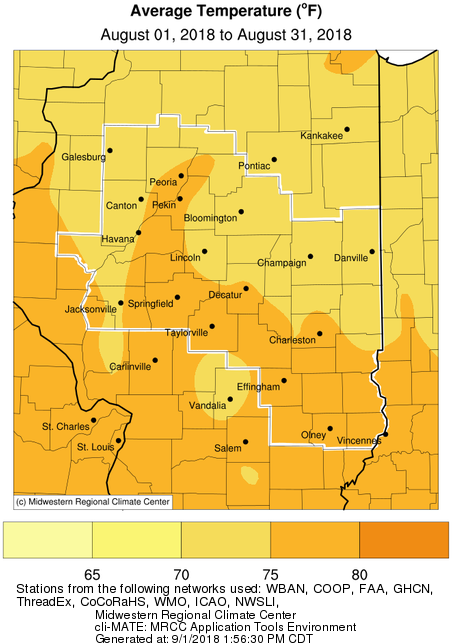
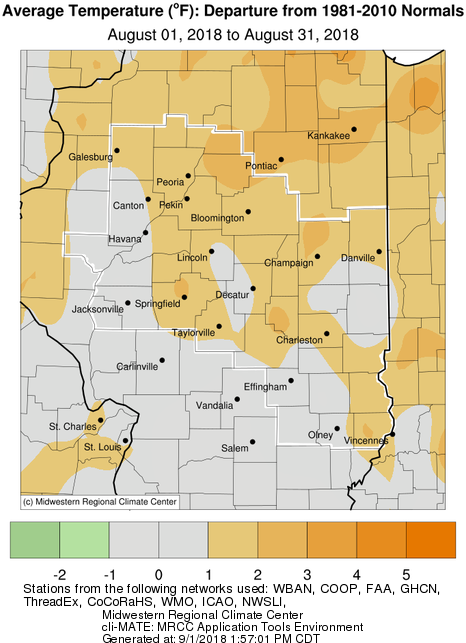
August Precipitation, Temperature, and Departure from Normal Maps:
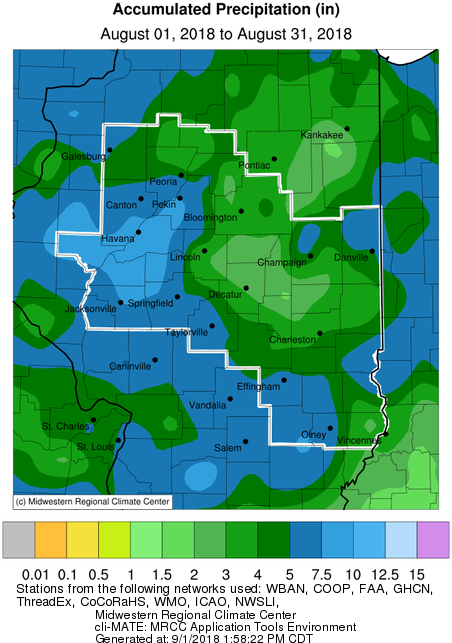
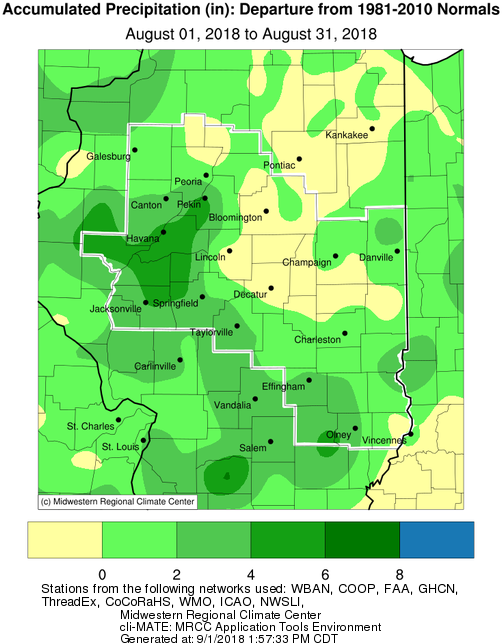
August Climate Data:
|
Site |
Precipitation |
Departure from Normal | Average Temperature |
Departure from Normal |
|
Charleston |
4.06" | +1.13" | 76.7 | +2.1 |
| Danville |
4.10" |
+0.62" | 75.3 | +1.8 |
| Decatur |
3.06" |
-0.71" | 75.2 | +0.1 |
| Effingham |
5.29" |
+2.54" | 75.9 | +1.0 |
|
Flora |
6.64" | +3.50" | 76.2 | +1.1 |
| Galesburg |
5.66" |
+1.69" | 74.8 | +2.1 |
|
Havana |
7.90" | +4.14" | N/A | N/A |
|
Jacksonville |
8.12" | +4.61" | 74.8 | -0.5 |
| Lincoln | 2.94" | -0.98" | 73.7 | +0.7 |
|
Normal |
3.22" |
-0.58" | 74.3 | +1.8 |
|
Olney |
6.15" | +2.95" | 75.4 | +0.2 |
|
Paris |
3.49" | -0.52" | 73.0 | -0.8 |
| Peoria |
6.08" |
+3.24" | 75.5 | +1.7 |
| Springfield |
6.32" |
+3.08" | 76.7 | +2.5 |
|
Tuscola |
2.93" | -0.13" | 74.3 | +0.6 |
| Urbana |
4.15" |
+0.22" | 75.3 | +1.9 |
Links below are the monthly climate summaries for area cities. Only the summaries for Peoria, Springfield and Lincoln are considered "official", meaning they are the station of record for their respective locations. The other summaries are "supplemental", meaning another location in the area is the official climate station for that city.
Climate data for other area cities is available at http://www.nws.noaa.gov/climate/xmacis.php?wfo=ilx

