National Weather Service United States Department of Commerce

Storm Impacting the Northwest U.S.; Fire Weather Conditions in Southern California; Severe Weather in the South

A Pacific storm is bringing areas of low elevation rain, moderate to heavy mountain snow, and high winds to the Northwest. Strong Santa Ana winds and very dry conditions are producing elevated to critical fire weather conditions in southern California. Isolated strong to severe thunderstorms are possible through early Wednesday morning across parts of northeast Texas into western Tennessee. Read More >

November Precipitation Highlights:
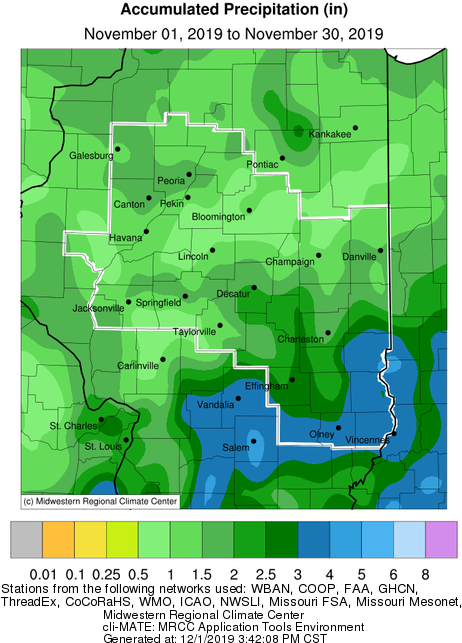
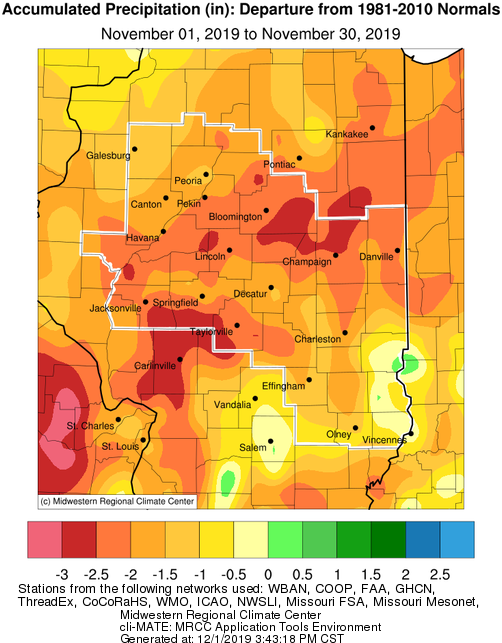
  • Liquid-equivalent precipitation was well below normal central Illinois, and slightly below normal for southeast Illinois.  Amounts ranged from 1-2" for much of central Illinois, to as much as 4" in southeast Illinois.  This resulted in monthly deficits of 1-3" for many areas north of I-70.
     
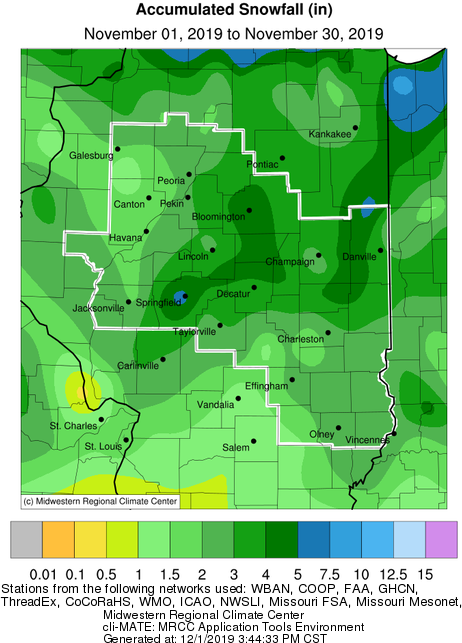
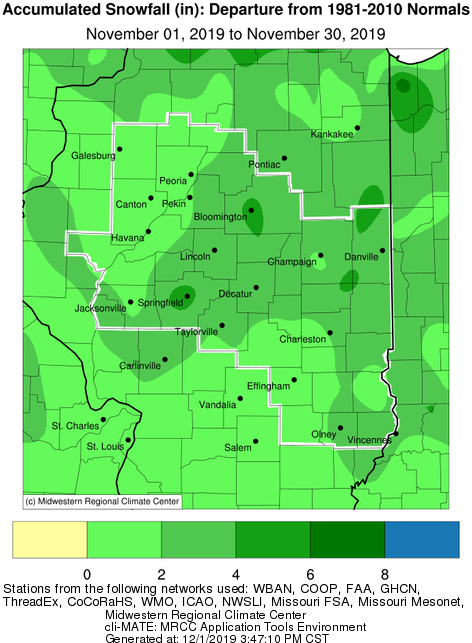
  • Snowfall was well above normal across the entire area.  This was primarily the result of snow that fell across the region on the 11th.  Snowfall of 2-4" was common over much of the area from this storm.  With normal November snowfall around an inch or less, this put many areas a few inches above normal for the month.


November Temperature Highlights:

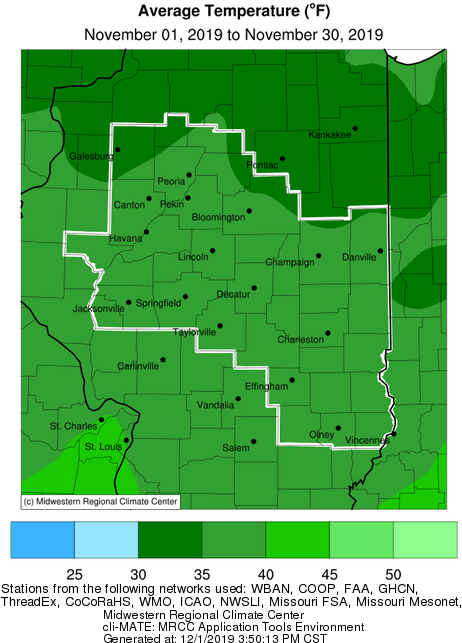
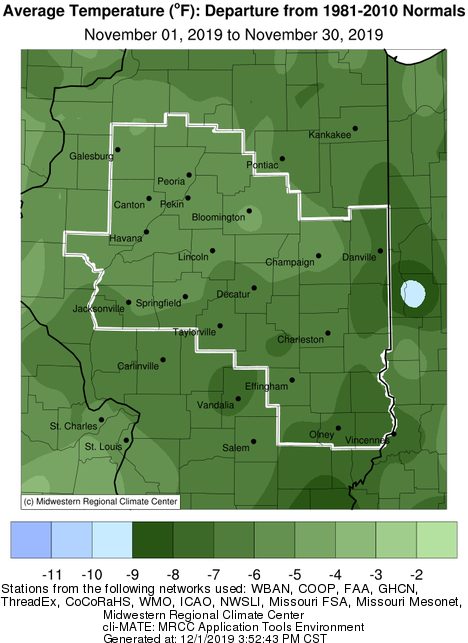
  • Very cold conditions dominated the area for the first half of the month.  A few days saw record low temperatures, with the coldest air of the month occurring on the 11th-13th, when lows in the single digits and teens were common.  Combined with highs in the teens and 20s, this produced daily average temperatures as much as 30 degrees below normal.  Temperatures moderated for the last two weeks of November, when several days saw above normal temperatures.  Overall, the month ended with readings of 6-7 degrees below normal, which was near the top 10 coldest Novembers for several sites.


November Climate Statistics:
 

City

Precipitation
 

Departure from Normal Snow

Departure
from
Normal

Average Temperature
 
Departure from Normal

Charleston

1.02" -2.95" 3.7" +3.0" 37.5 -6.9
Danville

2.07"

-1.76" 1.5" +1.3" 36.6 -6.8

Decatur

2.14" -1.57" 4.5" +4.3" 36.5 -7.3
Effingham 3.27" -0.86" 1.8" +1.4" 37.6 -6.3

Flora

3.38" -0.75" 3.0 N/A 37.5 -7.3

Galesburg

1.53" -1.34" 1.0" +0.2" 32.8 -6.3

Havana

0.88" -2.36" 1.8" +1.0" N/A N/A

Jacksonville

1.87" -1.60" 2.7" +2.2" 36.1 -7.0

Lincoln

1.97" -1.28" 2.5" +1.9" 36.5 -5.6

Normal

1.46"

-1.81" 5.0" +4.7" 34.9 -5.6

Olney

4.03" -0.45" 3.1" +2.8" 37.3 -7.2

Paris

2.71" -1.07" 3.0" +2.6" 35.2 -7.6

Peoria

1.87" -1.26" 1.8" +0.7" 36.6 -5.0"
Springfield

2.22"

-0.99" 4.7" +4.1" 37.2 -5.9

Taylorville

2.63" -1.11" 1.9" N/A N/A N/A

Tuscola

2.42" -1.43" 4.0" +3.3" 35.4 -6.3

Urbana

2.10" -1.58" 2.1" +1.2" 35.9 -5.4


The following links are the monthly climate summaries for area cities. Only the summaries for Peoria, Springfield, and Lincoln are considered "official", meaning they are the station of record for their respective locations. The other summaries are "supplemental", meaning another location in the area is the official climate station for the city.

  • Peoria -- Peoria International Airport
  • Springfield -- Abraham Lincoln Capital Airport
  • Lincoln -- National Weather Service Office
  • Champaign -- University of Illinois-Willard Airport
  • Decatur -- Decatur Airport
  • Lawrenceville -- Lawrenceville-Vincennes International Airport
  • Mattoon -- Coles County Memorial Airport

Climate data for other cities is available at http://w2.weather.gov/climate/xmacis.php?wfo=ilx


December Look Ahead:
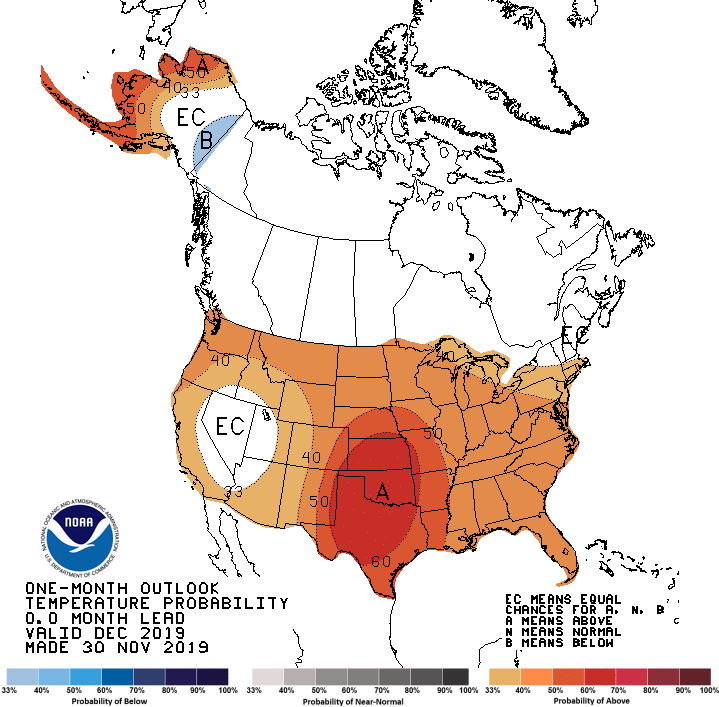
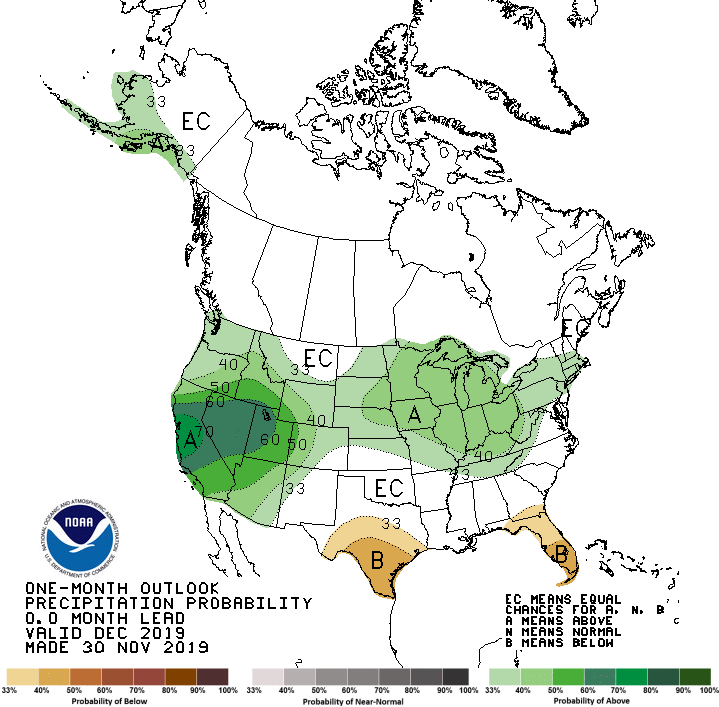
  • Official outlooks from NOAA's Climate Predication center favor above normal temperatures and precipitation for central and southeast IL.