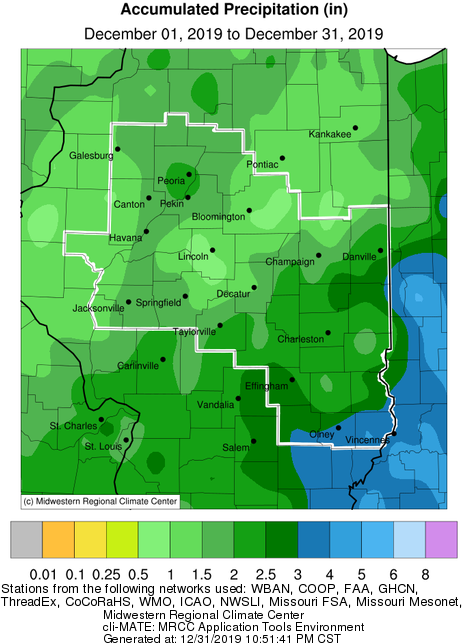
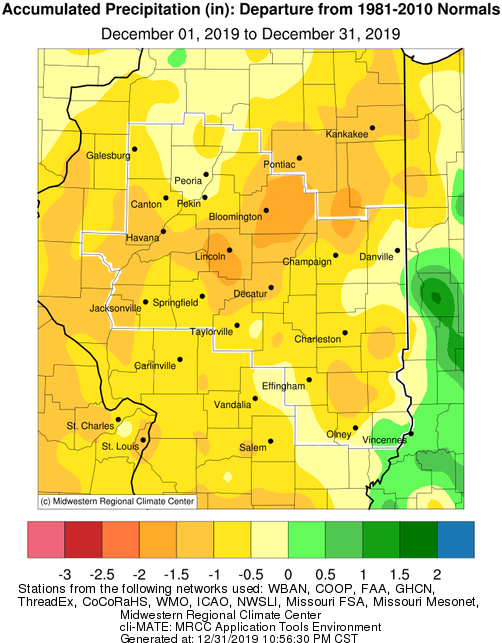
December Precipitation Highlights:
 |
 |
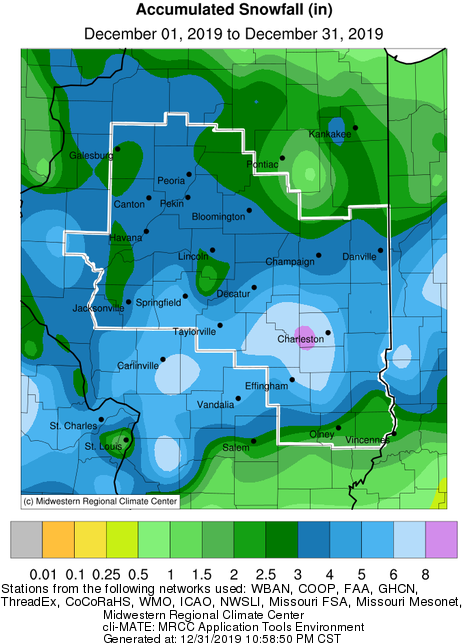
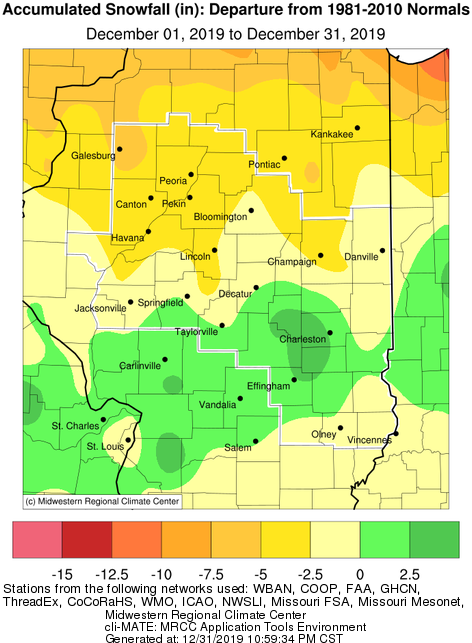
December Snowfall Highlights:
Two rounds of wintery weather affected the area on Dec. 15-16. The first was caused by an upper level disturbance which tracked in from the west on Sunday Dec. 15. This spread accumulating snow across all of central and southeast Illinois during the afternoon and evening. The heaviest snow occurred south of a Springfield to Paris line. By time this departed the area Sunday night, 4 to 6 inch totals were common in this area. Farther north, lighter accumulations of 2 to 4 inches were reported over the remainder of central Illinois. The second system was caused by a surface low pressure system which passed south of the Ohio Valley on Monday. This primarily affected areas southeast of a Springfield to Danville line. The heaviest snow with this round occurred over southeast Illinois, with 2 to 3 inches of additional accumulation, primarily late morning through early evening. Highest two days totals of 6 to 8 inches were common from Pana east through Charleston, and south to Effingham.
 |
 |
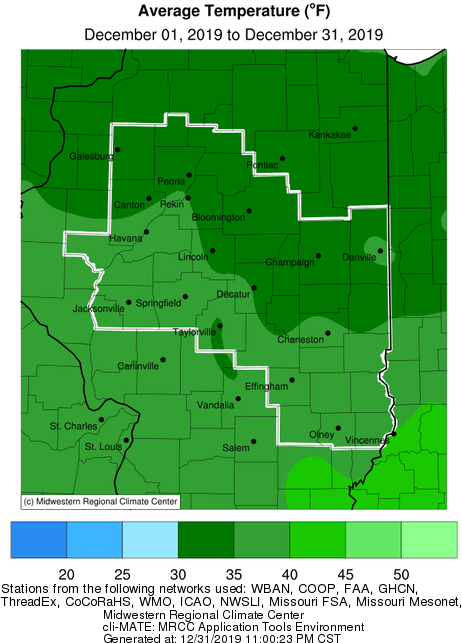
December Temperature Highlights:
 |
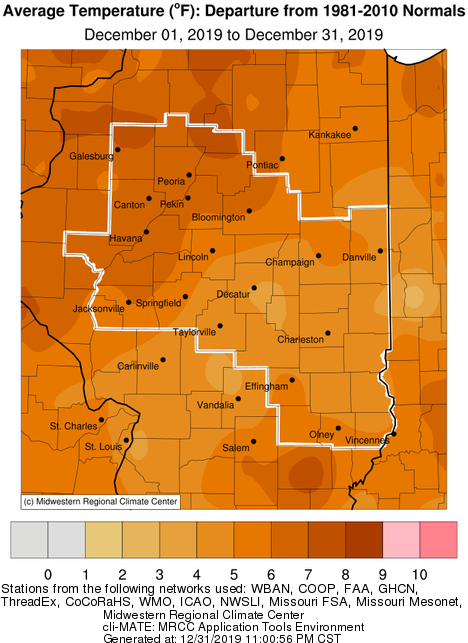 |
December Climate Statistics:
|
City |
Precipitation |
Departure from Normal | Snow |
Departure |
Average Temperature |
Departure from Normal |
|
Charleston |
2.51" | -0.54" | 6.4" | +3.9" | N/A | N/A |
| Danville |
2.17" |
-0.57" | 3.0" | -2.0" | 35.9 | +5.1 |
|
Decatur |
1.44" | -1.34" | 2.8" | -2.1" | 35.4 | +4.2 |
| Effingham | 2.51" | -0.71" | 4.6" | +1.4" | 36.8 | +5.2 |
|
Flora |
3.10" | -0.34" | 2.5" | N/A | 37.6 | +5.1 |
|
Galesburg |
1.49" | -0.78" | 2.0" | -3.9" | 32.8 | +6.8 |
|
Havana |
1.66" | -1.02" | 4.0" | -3.6" | N/A | N/A |
|
Jacksonville |
1.88" | -0.62" | 4.6" | -0.6" | 36.4 | +6.5 |
|
Lincoln |
1.49" | -1.15" | 3.9" | -2.3" | 34.6 | +5.1 |
|
Normal |
1.10" |
-1.60" | 3.5" | -1.6" | 34.4 | +6.6 |
|
Olney |
3.36" | -0.52" | 2.0" | -0.9" | 37.9 | +5.2 |
|
Paris |
2.29" | -0.74" | 3.7" | -1.8" | 34.1 | +3.9 |
|
Peoria |
2.39" | -0.03" | 4.1" | -3.0" | 34.9 | +6.3 |
| Springfield |
1.91" |
-0.61 | 5.7" | +0.1" | 35.7 | +5.3 |
|
Taylorville |
2.15" | -0.65" | 3.7" | N/A | 34.8 | M |
|
Tuscola |
2.11" | -0.83" | 4.8" | +0.1" | 33.9 | +4.5 |
|
Urbana |
1.82" | -0.83" | 3.2" | -3.1" | 34.4 | +5.3 |
The following links are the monthly climate summaries for area cities. Only the summaries for Peoria, Springfield, and Lincoln are considered "official", meaning they are the station of record for their respective locations. The other summaries are "supplemental", meaning another location in the area is the official climate station for the city.
Climate data for other cities is available at http://w2.weather.gov/climate/xmacis.php?wfo=ilx
January Look Ahead:
 |
 |

