August Precipitation Highlights:
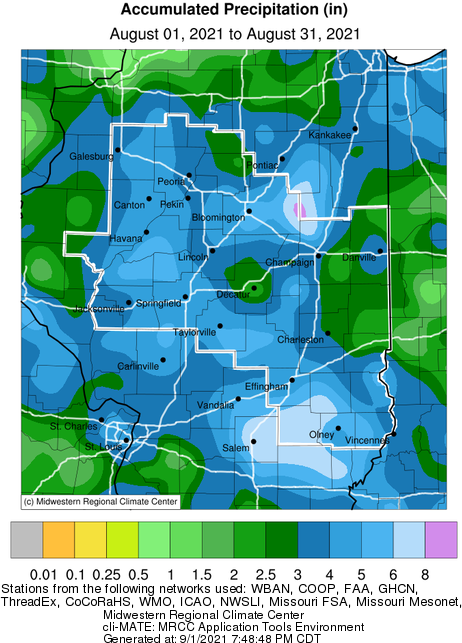
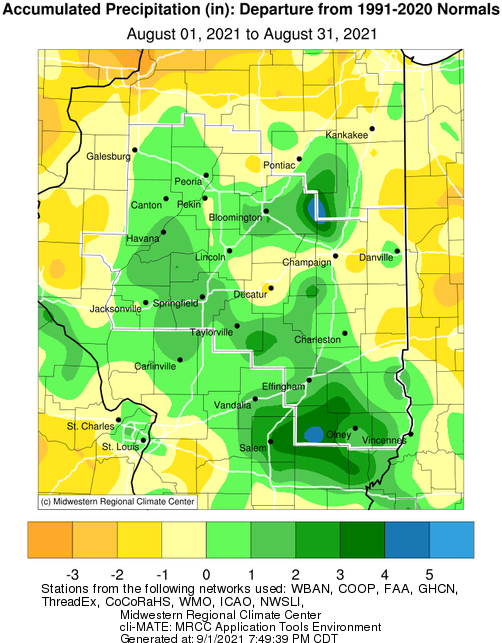
- Monthly rainfall was above normal over large portions of central IL, though below normal precipitation was noted in west central and portions of east central IL. The wettest areas were around McLean and Clay counties, with Flora having 8.6 inches and Clay City having 7.17 inches of rainfall in August which were 4-5 inches above normal. Decatur was just shy of 2 inches of rain in August which was about 1.5 inches below normal. Isolated severe thunderstorms occurred over parts of central IL on Aug 8 and during the heat wave from Aug 23-26. More widespread severe storms especially with damaging winds along with some flash flooding occurred on Thursday Aug 12th from I-72 south. The worst flooding of the month occurred in nearby Gibson City in southern Ford county where 9 inches of rain in a few hours caused some water rescues. Some flash flooding was also observed over parts of central and southeast IL on Aug 8th, 26th and 30th.
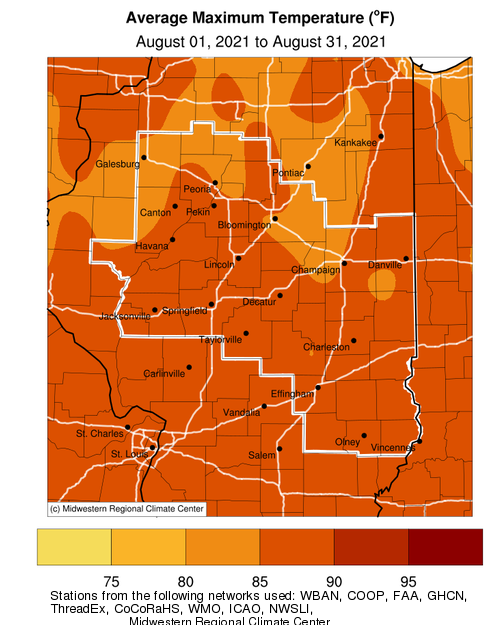
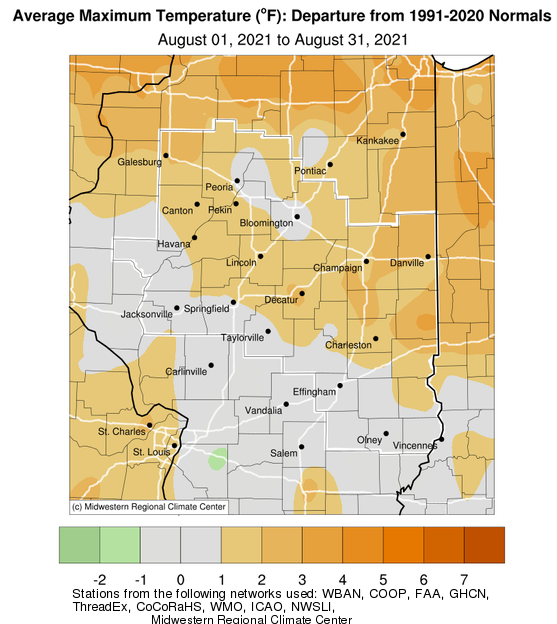
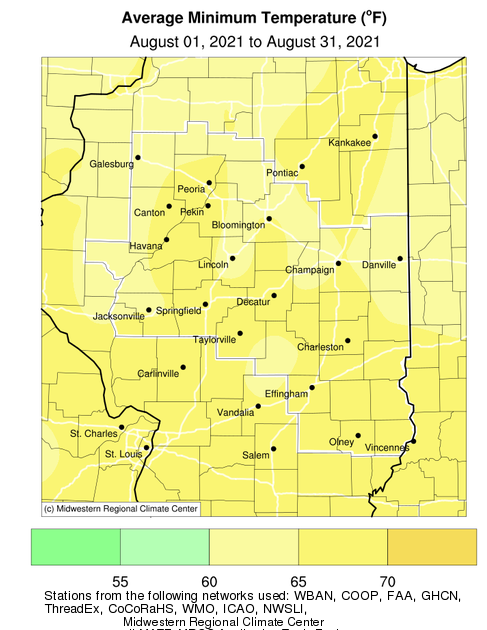
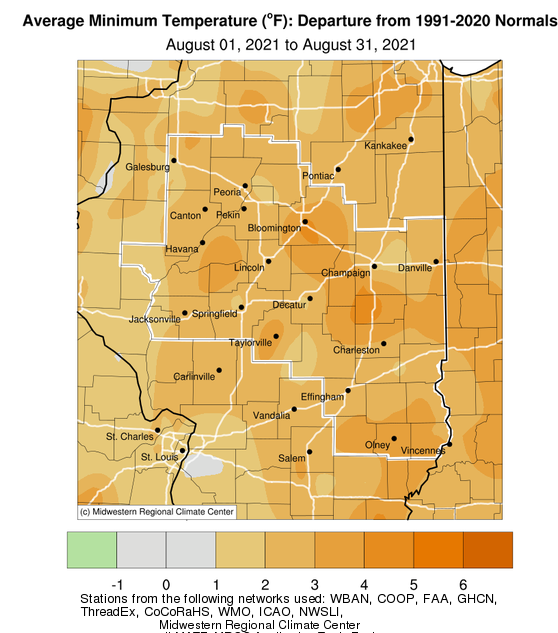
August Temperature Highlights:
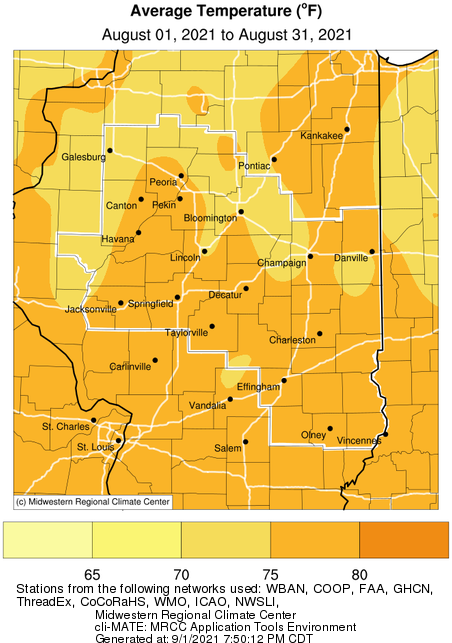
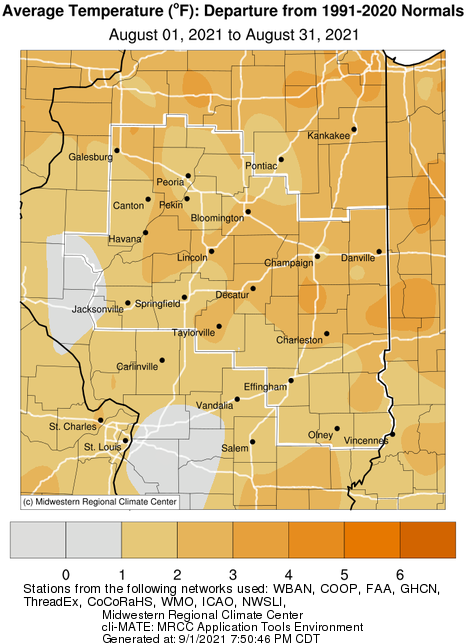
- Monthly average temperatures were 1 to 3 degrees above normal across most of central and southeast IL. The summer's longest heat wave occurred the last week of August with several days having a heat advisory due to the combination of high heat and humidity, peaking on Aug 24-25th with afternoon heat indices of 105-110 degrees. On the flip side of the coin, a few cities set record cold lows in the 50s on Aug 2-3rd.
Aug 2021 Climate Statistics:
|
Site
|
Precipitation
|
Departure from Normal |
Average Temperature
|
Departure from Normal |
|
Charleston
|
2.82" |
-0.12" |
79.5 |
+4.0 |
| Danville |
5.43" |
+2.12" |
74.7 |
+1.2
|
| Decatur |
1.97" |
-1.53" |
76.3 |
+2.1
|
| Effingham |
4.74"
|
+1.42" |
N/A |
N/A |
|
Flora
|
8.60" |
+4.87" |
77.4 |
+1.8 |
| Galesburg |
3.06" |
-0.83" |
74.9 |
-2.1
|
|
Jacksonville
|
2.88" |
-0.44" |
75.8 |
+1.3 |
|
Lincoln
|
3.78" |
+0.31" |
74.7 |
+2.1 |
|
Mattoon
|
3.02" |
+0.17" |
N/A |
N/A |
|
Morton
|
3.58" |
+0.06" |
N/A |
N/A |
|
Normal
|
5.08" |
+1.25" |
74.6 |
+2.0 |
|
Olney
|
3.26" |
+0.07" |
76.7 |
+1.9 |
|
Paris
|
2.47" |
-1.10" |
75.7 |
+3.4 |
|
Peoria
|
3.87" |
+0.56" |
76.6 |
+2.1 |
| Springfield |
5.69"
|
+2.32" |
76.3 |
+1.4 |
|
Tuscola
|
3.49" |
+0.52" |
77.3 |
+3.8 |
| Urbana |
4.53" |
+0.99" |
75.5 |
+1.7
|
The following links are the monthly climate summaries for area cities. Only the summaries for Peoria, Springfield, and Lincoln are considered "official", meaning they are the station of record for their respective locations. The other summaries are "supplemental", meaning another location in the area is the official climate station for the city.
- Peoria -- Peoria International Airport
- Springfield -- Abraham Lincoln Capital Airport
- Lincoln -- National Weather Service Office
- Champaign -- University of Illinois-Willard Airport
- Decatur -- Decatur Airport
- Lawrenceville -- Lawrenceville-Vincennes International Airport
- Mattoon -- Coles County Memorial Airport
Climate data for other cities is available at http://w2.weather.gov/climate/xmacis.php?wfo=ilx
September Look Ahead:
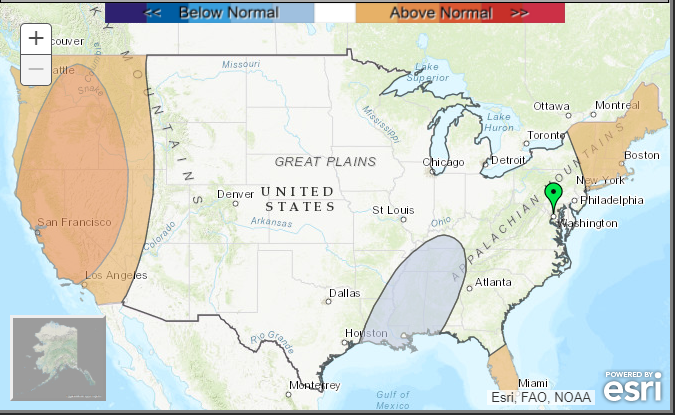
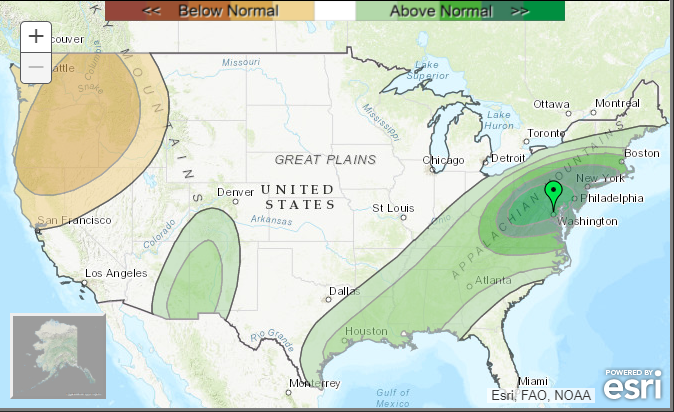
- Official outlooks from NOAA's Climate Predication center for Sep 2021 show near normal temperatures and precipitation favored for central and southeast IL.
---------------------------------------------------------------------------------------------------------------------------------------------------------
Summer Season Overview
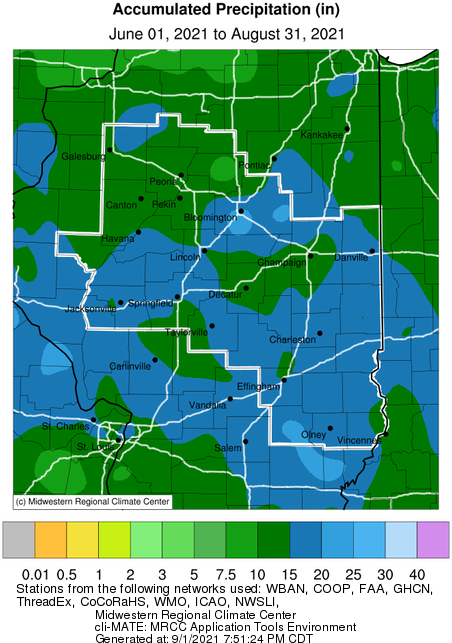
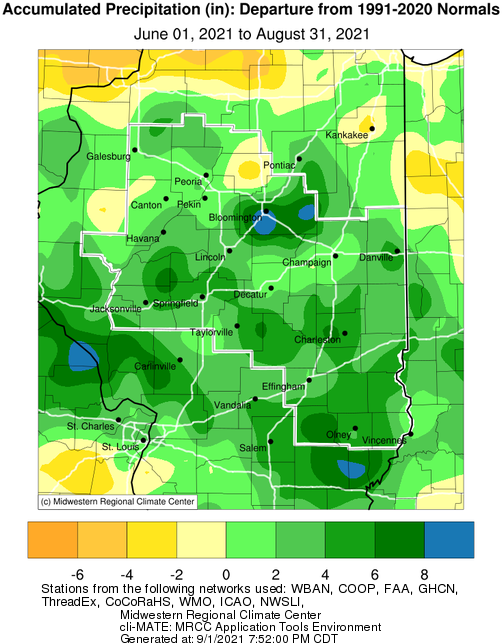
- Rainfall averaged above normal across much of central and southeast IL, especially in central and southern McLean county. Normally about a foot of rain falls in central and southeast IL during the summer months of June, July and August. Flora was one of the wettest cities with 22.44 inches which was 8.66 inches above normal, while Mattoon and Danville were near 7 inches above normal. Charleston, Jacksonville, Springfield, Normal and Urbana were 4 to 5.5 inches wetter than normal. Decatur was one of the few cities slightly below normal which was 0.73 inches drier than normal. Very heavy rains fell from Friday night through Saturday afternoon June 25-26 over parts of central IL, with 8-12 inches of rain falling over parts of central and southern McLean county including Bloomington which had a 500 year flood event with many flooded basements and vehicles.
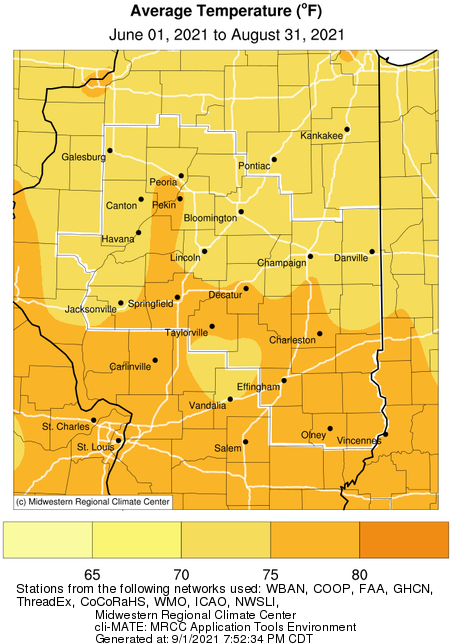
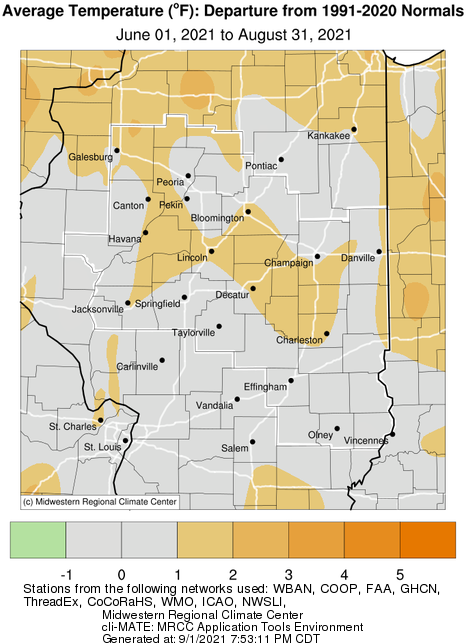
- Seasonal temperatures were slightly above normal across much of the area. A couple of heat waves occurring during this past summer, with the 1st one being June 11-12 with highs in the mid 90s over much of central IL. The first heat advisory was issued for areas south of a Rushville to Bloomington line on June 17-18 with afternoon heat indices rising to near 105 degrees. Springfield had it hottest temperature one day before the official start of summer on Saturday June 18 with a record high of 99 degrees. This was following be the coolest morning of the summer on Wednesday morning June 22 with lows in the upper 40s in central IL north of Charleston/Mattoon. The summer's longest heat wave occurred Aug 23-29th with a heat advisory over much of central IL from Aug 24-27th, peaking on Aug 24-25th with afternoon heat indices of 105-110.
Summer Season: Precipitation, Temperature and Departure from Normal Maps
Summer (Jun-Aug) 2021 Climate Statistics:
|
Site
|
Precipitation
|
Departure from Normal |
Average Temperature
|
Departure from Normal |
|
Charleston
|
17.68" |
+5.50" |
76.4 |
+1.5 |
| Danville |
19.85" |
+7.02" |
74.2 |
+0.5
|
| Decatur |
11.50" |
-0.73" |
75.2 |
+0.4
|
| Effingham |
15.52"
|
+2.39" |
N/A |
N/A |
|
Flora
|
22.44" |
+8.66" |
76.5 |
+0.5 |
| Galesburg |
13.86" |
+1.35" |
74.0 |
+1.0
|
|
Jacksonville
|
16.93" |
+4.69" |
74.7 |
+0.5 |
|
Lincoln
|
14.68" |
+2.14" |
74.3 |
+1.1 |
|
Mattoon
|
18.75" |
+6.93" |
N/A |
N/A |
|
Morton
|
11.73" |
+0.11" |
N/A |
N/A |
|
Normal
|
15.94" |
+3.91" |
73.7 |
+0.8 |
|
Olney
|
13.94" |
+1.00" |
75.4 |
-0.3 |
|
Paris
|
14.39" |
+1.97" |
74.0 |
-0.3 |
|
Peoria
|
13.31" |
+2.74" |
75.7 |
+1.2 |
| Springfield |
16.26"
|
+4.43" |
75.7 |
+0.7 |
|
Tuscola
|
13.67" |
+1.48" |
76.1 |
+1.8 |
| Urbana |
16.42" |
+3.81" |
74.7 |
+0.9
|
Links below are the seasonal climate summaries for area cities. Only the summaries for Peoria, Springfield and Lincoln are considered "official", meaning they are the station of record for their respective locations. The other summaries are "supplemental", meaning another location in the area is the official climate station for that city.
Climate data for other area cities is available at http://w2.weather.gov/climate/xmacis.php?wfo=ilx


 Follow us on X
 Follow us on Facebook
 Follow us on YouTube
 ILX RSS Feed