National Weather Service United States Department of Commerce

Storm Impacting the Northwest U.S.; Fire Weather Conditions in Southern California; Severe Weather in the South

A Pacific storm is bringing areas of low elevation rain, moderate to heavy mountain snow, and high winds to the Northwest. Strong Santa Ana winds and very dry conditions are producing elevated to critical fire weather conditions in southern California. Isolated strong to severe thunderstorms are possible through early Wednesday morning across parts of northeast Texas into western Tennessee. Read More >

August Precipitation Highlights:
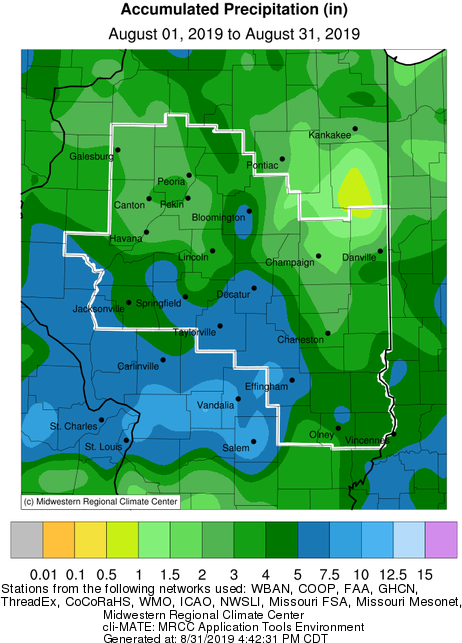
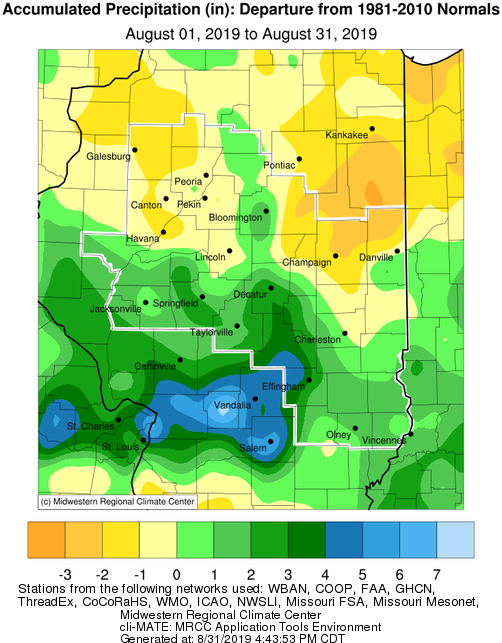
  • August saw a continuation of dry conditions for the northern half of central Illinois.  Many areas north of a Havana to Champaign line saw 1-2" rainfall deficits for the month.  This added to the dry conditions in June and July, pushed portions of Knox, Champaign, and Vermilion counties into moderate drought, according to the U.S. Drought Monitor.  Surrounding areas remained "abnormally dry", though some improvement in the dry conditions was noted from near Springfield, northeast to Bloomington.  Farther south, much above normal rainfall occurred south of a Springfield, to Decatur, to Robinson line.  Surpluses of 1-3" were common in these areas.  Effingham saw 8.36" of rain for the month, which was 5.61" above normal. 


August Temperature Highlights:

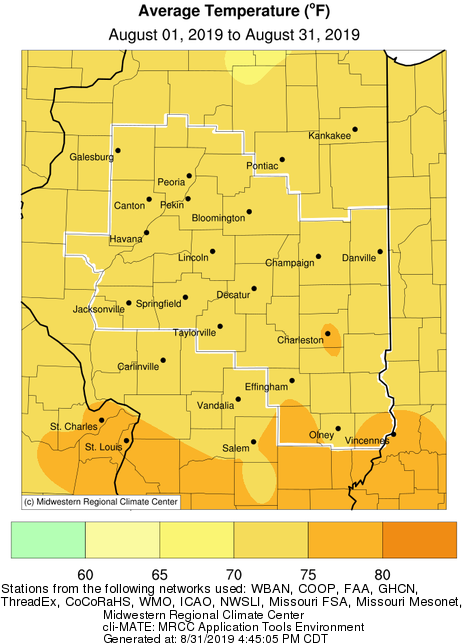
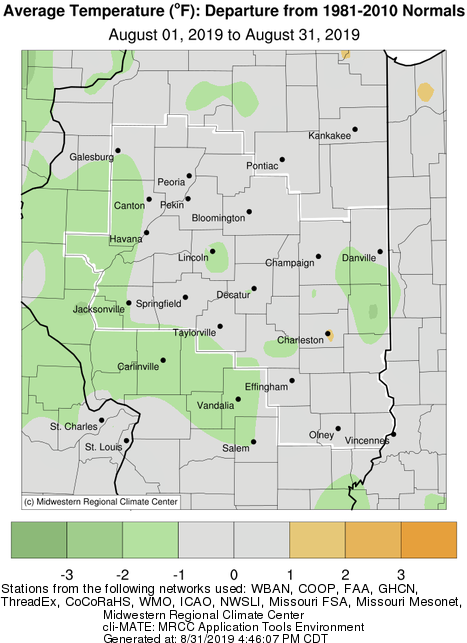
  • Monthly mean temperatures were near, to slightly below normal across the region.  A notable lack of typical August heat was observed.  Highs at or above 90 were uncommon, occurring only few times in most areas.


August Climate Statistics:
 

City

Precipitation
 

Departure from Normal Average Temperature
 
Departure from Normal

Charleston

2.76" -0.17" 77.0 +2.4
Danville

2.50"

-0.98" 72.7 -0.8

Decatur

7.26" +3.49" 74.2 -0.9
Effingham 8.36"

+5.61"

74.8 -0.1

Flora

3.32" +0.18" 75.8 +0.7

Galesburg

3.15" -0.83" 72.1 -0.6

Havana

2.18" -1.58" NA NA

Jacksonville

3.60" +0.09" 73.3 -2.0

Lincoln

3.48" -0.44" 71.6 -1.4

Normal

4.46"

+0.66" 71.4 -1.1

Olney

3.17" -0.03" 74.5 -0.7

Paris

3.89" -0.02" 71.3 -2.5

Peoria

3.84" +0.60" 73.5 -0.3
Springfield

3.92"

+0.68 73.4 -0.8
Taylorville 5.70" +2.27" NA NA

Tuscola

2.51" -0.75" 72.3 -1.4

Urbana

2.19" -1.74" 73.6 +0.2


The following links are the monthly climate summaries for area cities. Only the summaries for Peoria, Springfield, and Lincoln are considered "official", meaning they are the station of record for their respective locations. The other summaries are "supplemental", meaning another location in the area is the official climate station for the city.

  • Peoria -- Peoria International Airport
  • Springfield -- Abraham Lincoln Capital Airport
  • Lincoln -- National Weather Service Office
  • Champaign -- University of Illinois-Willard Airport
  • Decatur -- Decatur Airport
  • Lawrenceville -- Lawrenceville-Vincennes International Airport
  • Mattoon -- Coles County Memorial Airport

Climate data for other cities is available at http://w2.weather.gov/climate/xmacis.php?wfo=ilx


------------------------------------------------------------------------------------------------------------------------------------------------------------


Summer Season (June - August) Climate Data


Summer Precipitation:
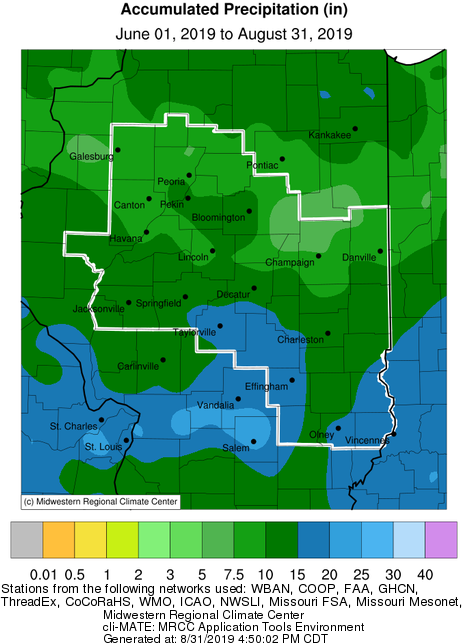
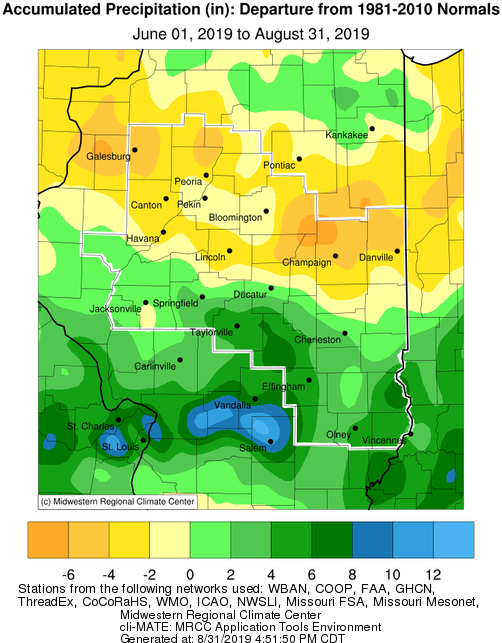
  • Summer rainfall was well below normal north of a Havana to Danville line.  Total rainfall for the 3 months was 7-9" in many of these areas, putting these sites 3-4" below normal for the summer.  In stark contrast, southern portions of central Illinois, into southeast Illinois, saw above to well above normal rainfall.  In fact, areas from Taylorville southeast through Effingham, Flora, and Olney, saw twice the amount of summer rain as locations just 50-75 miles farther north.  This amount of rain put some locations 4-6" above normal for summer.


Summer Temperature:

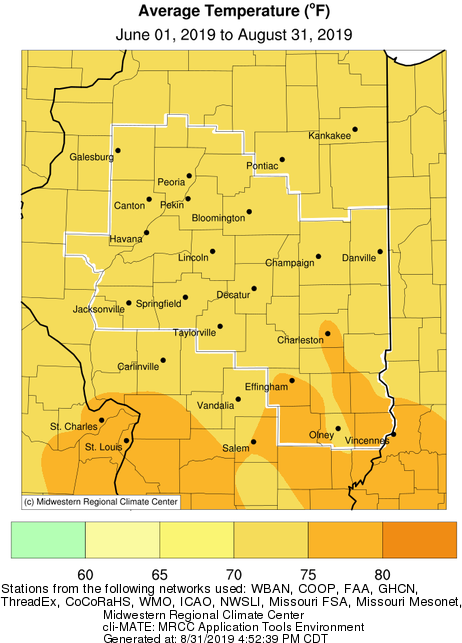
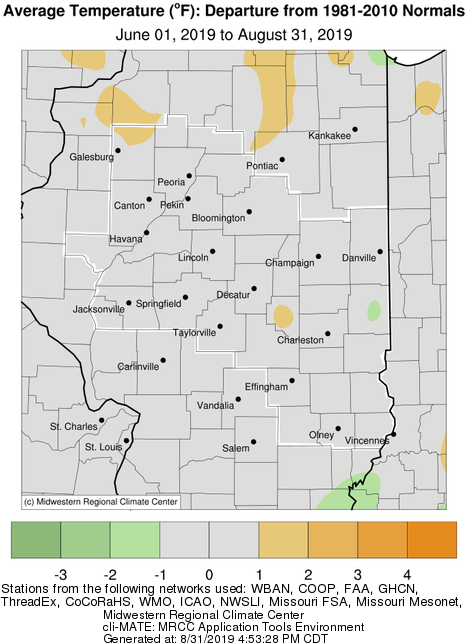
  • Overall temperatures were very close to historic averages for the summer months.  While heat waves were quite infrequent, the most significant period of extended hot and humid weather affected the area July 18th-20th.  During this stretch, highs reach the mid 90s, with dew points in the mid 70s to around 80 degrees.  This produced peak heat indices of 110-115 degrees.  Record warm lows in the upper 70s were set over parts of central Illinois on July 19th.


Summer Climate Statistics:
 

City

Precipitation
 

Departure from Normal Average Temperature
 
Departure from Normal

Charleston

13.98" +2.25" 76.4 +1.4
Danville

8.67"

-4.15" 73.5 -0.1

Decatur

13.49" +1.29" 74.5 -0.3
Effingham 17.02" +4.22" 75.4 +0.3

Flora

15.71" +4.87" 76.4 +0.8

Galesburg

7.30" -5.60" 73.5 +0.4

Havana

7.49" -5.80" NA NA

Jacksonville

12.13" -0.31" 73.8 +0.5

Lincoln

9.87" -3.43" 73.2 -0.2

Normal

11.71"

-0.31 73.0 0.0

Olney

16.74" +4.06" 74.6 -0.7

Paris

13.49" +1.23" 72.5 -1.2

Peoria

10.92" +0.30" 74.5 +0.8
Springfield

11.58"

-0.06" 74.6 +0.4

Tuscola

10.10" -1.84" 73.8 -0.3

Urbana

8.39" -4.40" 74.1 +0.5


The following links are the seasonal climate summaries for area cities. Only the summaries for Peoria, Springfield, and Lincoln are considered "official", meaning they are the station of record for their respective locations. The other summaries are "supplemental", meaning another location in the area is the official climate station for the city.

  • Peoria -- Peoria International Airport
  • Springfield -- Abraham Lincoln Capital Airport
  • Lincoln -- National Weather Service Office
  • Champaign -- University of Illinois-Willard Airport
  • Decatur -- Decatur Airport
  • Lawrenceville -- Lawrenceville-Vincennes International Airport
  • Mattoon -- Coles County Memorial Airport

Climate data for other cities is available at http://w2.weather.gov/climate/xmacis.php?wfo=ilx