
Tropical Depression Two is expected to gradually strengthen and could bring tropical storm conditions to the Florida Panhandle beginning late Monday. Areas of flash flooding will be possible through Thursday along the eastern and central Gulf Coast. Severe thunderstorms will develop and move along a cold front crossing the Upper Midwest Monday, and through the Ohio Valley/Mid-Atlantic on Tuesday. Read More >

Snow
|
Month or Time frame |
Normal* |
Greatest Snowfall (Year(s)) |
| November | 0.0 | 4.0 inches (1966) |
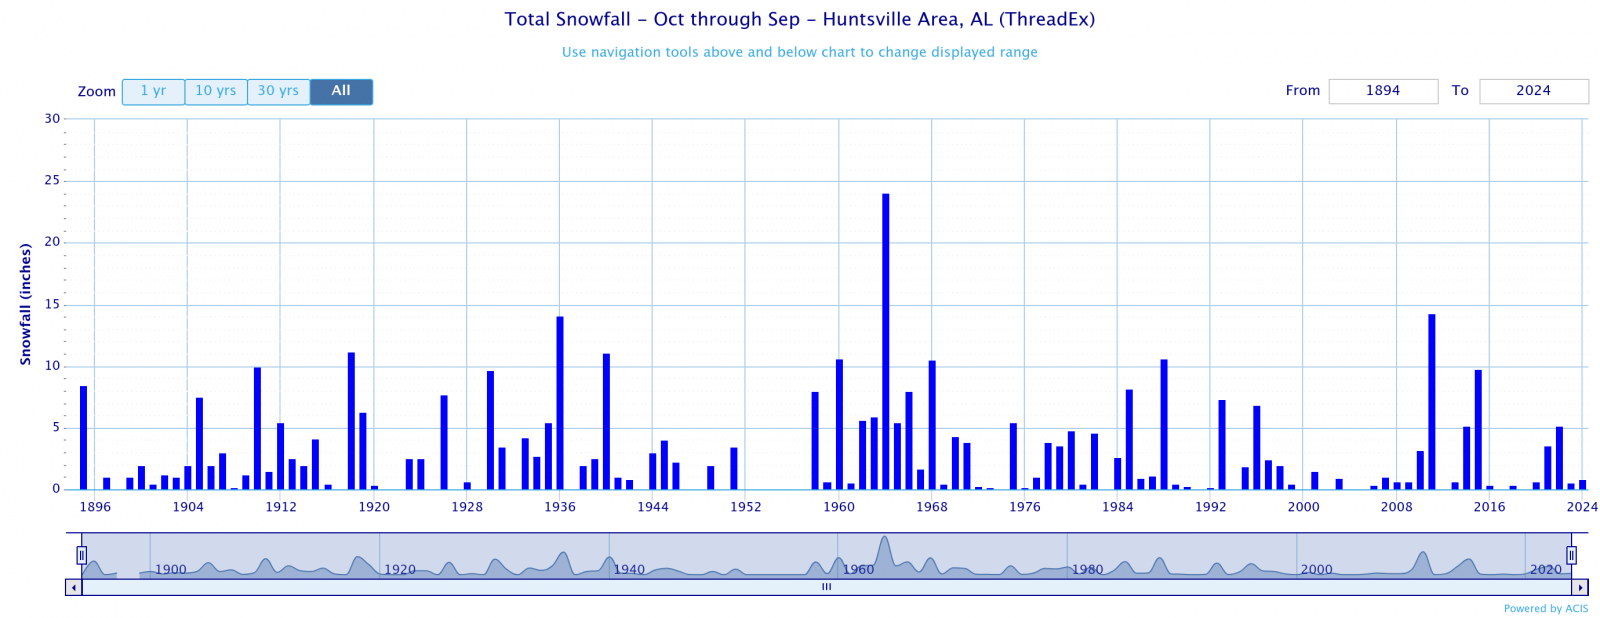
| December | 0.2" | 21.4 inches (1963) |
| January | 0.7" | 10.2 inches (1940) |
| February | 1.0" | 8.8 inches (2015) |
| March | 0.5" | 7.3 inches (1993) |
| Season | 2.4" | 24.1 inches (1963-1964) |
| Calendar Day | N/A | 15.7 inches (Dec 31, 1963) |
| Week | N/A |
17.1 inches (Dec 31, 1963 - Jan 6, 1964) |
| Normal # of days with measurable snowfall per season* | 2 | |
| Earliest Snowfall (one inch or greater) | 4.0 inches | November 2, 1966 |
| Latest Snowfall (one inch or greater) | 2.1 inches | March 22, 1968 |
| Most Recent Snowfall (one inch or greater) | 2.0 inch | March 12, 2022 |
*Normal Snowfall based on 1991-2020 Climatology
Huntsville Winter Snowfall since 1893 (click on the chart for a larger version)
Christmas Snowfall (click here to see more information on Christmas snowfalls)
2.5 inches (2010)
0.3 inches (1989)
Trace amounts in 1909, 1969, 1980, 1983, 1985, 1993, and 2002
Temperatures
|
Month |
Normal Max Temperature |
Normal Min Temperature |
Coldest Max Temperature |
Coldest Min Temperature |
|
November |
63.9° |
41.2° |
19° (Nov 25, 1950) |
1° (Nov 25, 1950) |
|
December |
55.0° |
35.9° |
9° (Dec 22, 1989) |
-3° (Dec 22 and 23, 1989) |
|
January |
52.3° |
33.1° |
11° (Jan 10, 1962) |
-11° (Jan 21, 1985 & Jan 30, 1966) |
|
February |
57.1° |
36.4° |
13° (Feb 4, 1996) |
-8° (Feb 17, 1958) |
|
March |
65.5° |
43.0° |
22° (Mar 2, 1980) |
6° (Mar 3, 1980) |
| Earliest Freeze | October 9, 2000 |
| Normal First Freeze | November 8th |
| Latest Freeze | May 7, 1944 |
| Normal Latest Freeze | March 24th |
Snow
|
Month or Timeframe |
Greatest Snowfall (Year(s)) |
| November | 5.5 inches (1929) |
| December | 11.1 inches (1963) |
| January | 10.6 inches (1966) |
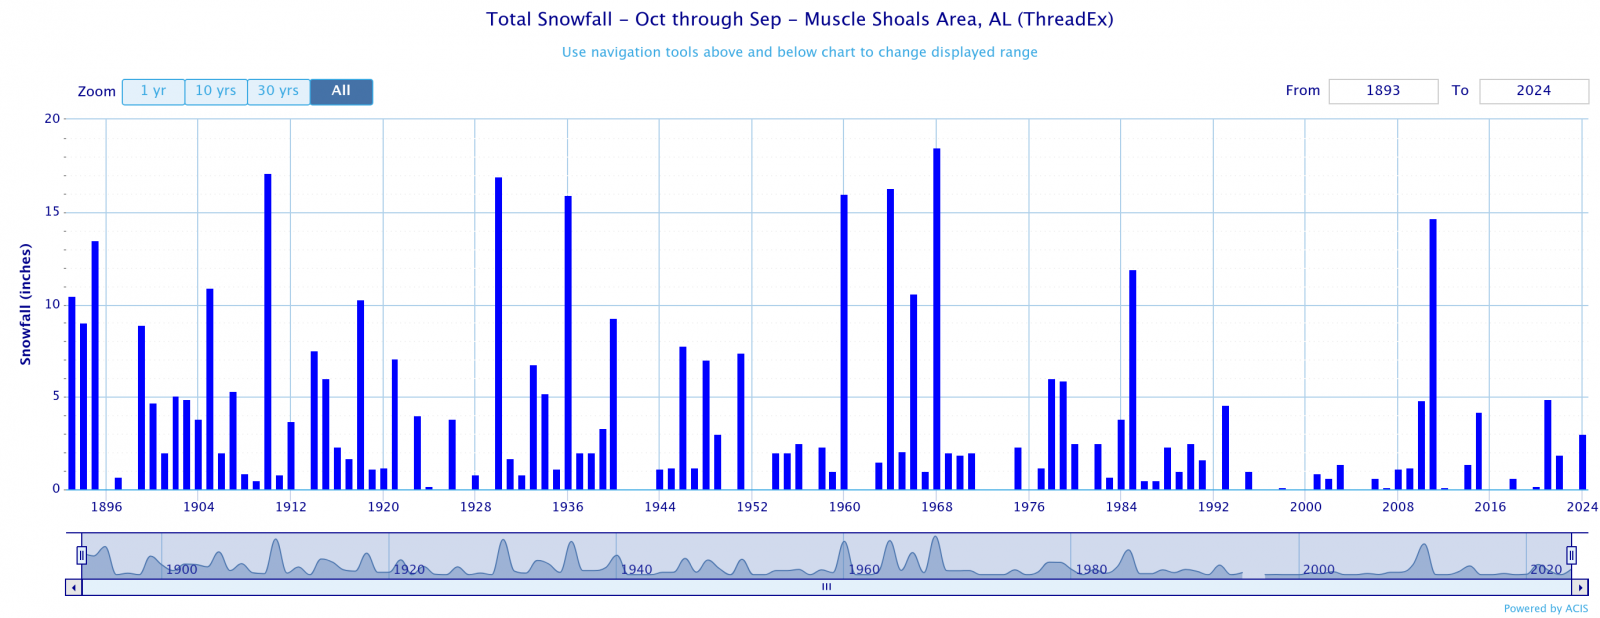
| February | 12.0 inches (1910) |
| March | 5.0 inches (1968) |
| Season | 18.5 inches (1967-1968)** |
| Calendar Day | 12.0 inches (Feb 11, 1910) |
| Week | 12.0 inches (Feb 11 - 17 1910) |
| Average # of days with measurable snowfall per season | 2 | |
| Earliest Snowfall (one inch or greater) | 3.3 inches | November 24, 1938 |
| Latest Snowfall (one inch or greater) | 1.0 inch | March 28, 1894 |
| Most recent snowfall | 3.5 inches | February 25, 2015 |
** This number has changed from the previous value since that was an observation from Florence, AL and not the official Muscle Shoals climatological data set.
Muscle Shoals Winter Snowfall since 1893 (click on the chart for a larger version)
Christmas Snowfall (click here to see more information on Christmas snowfalls)
2.4 inches (2010)
Traces in 1897, 1906, 1913, 1948, 1980, 1983, 1992, 1993, 2009
Temperatures
|
Month |
Normal Max |
Normal Min |
Coldest Max Temperature |
Coldest Min Temperature |
|
November |
63.8° |
41.2° |
23° (Nov 25, 1950) |
2° (Nov 25, 1950) |
|
December |
55.0° |
36.1° |
10° (Dec 22, 1989) |
-5° (Dec 23, 1989) |
|
January |
52.4° |
33.5° |
9° (Jan 10, 1962) |
-11° (Jan 21, 1985) |
|
February |
56.7° |
36.7° |
10° (Feb 12, 1899) |
-13° (Feb 14, 1905) |
|
March |
65.2° |
43.5° |
25° (Mar 2, 1980) |
7° (Mar 7, 1899) |
| Earliest Freeze | October 3, 1908 |
| Average First Freeze | November 8th |
| Latest Freeze (spring) | May 2, 1909 |
| Average Last Freeze | March 20th |


 Local Radar
 Weather Map