Overview
Damage path
Damage photos
Radar images
Survey Summary
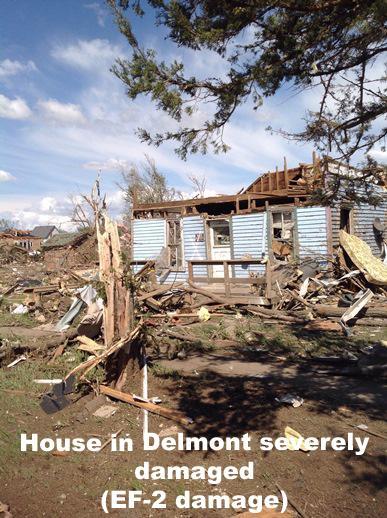
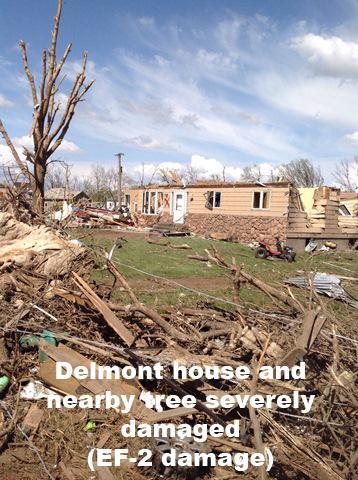
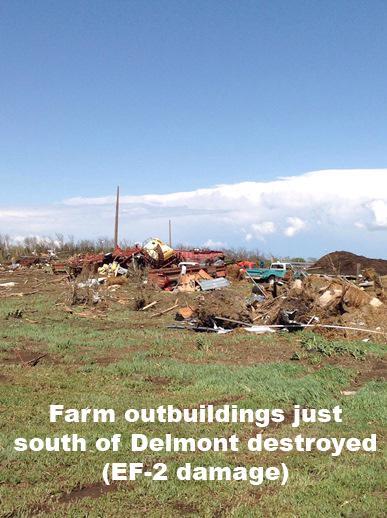
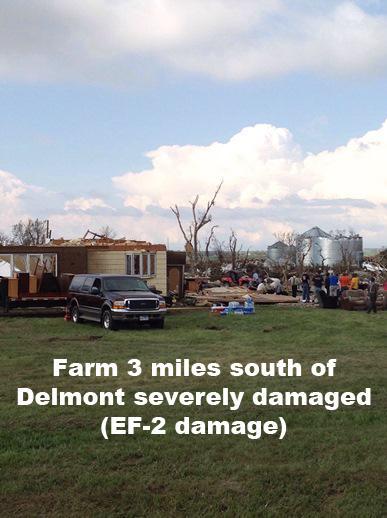
An EF-2 tornado hit Delmont, South Dakota on Mother's Day morning around 10:45 am CDT. The tornado developed 3 miles east of Wagner, South Dakota around 10:21 am CDT and moved north-northeast at almost 30 mph. The tornado remained over open country across Charles Mix County only damaging some trees. Once the tornado moved into Douglas County, it hit a farm 3 miles south of Delmont doing EF-2 damage. Three other farms were hit by the tornado south of Delmont which also produced EF-2 damage. The tornado moved into Delmont around 10:45 damaging several homes, a church and destroying the new fire station. As the tornado moved north of Delmont, it began to weaken. The tornado lifted approximately 3.5 miles north of Delmont around 10:52 am.
Click to download a kmz file of the National Weather Service damage survey.
Click to go to the National Weather Service Damage Assessment Toolkit viewer.
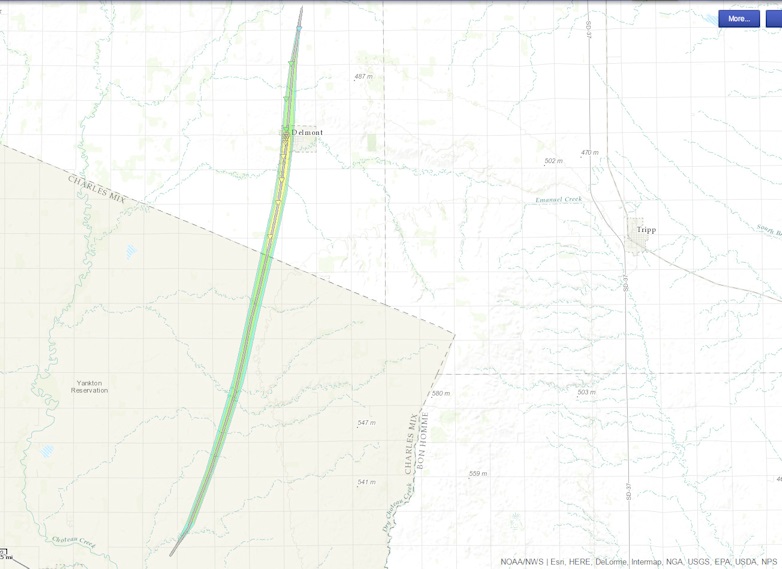
Click on the map for a larger version of this image.
This is a map depicting the path of the Delmont, South Dakota tornado. The damage rating is color-coded with cyan
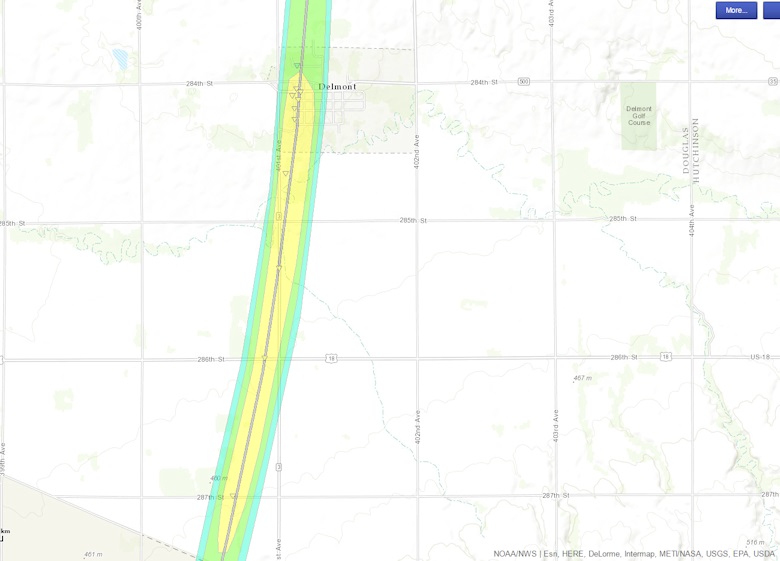
Click on the map for a larger version of this image.
This map is zoomed into southeastern Douglas County and shows the path of the tornado when it was rated EF-2. Several farms as well as the town of Delmont received EF-2 damage from the tornado. The tornado weakened as it moved north of Delmont.
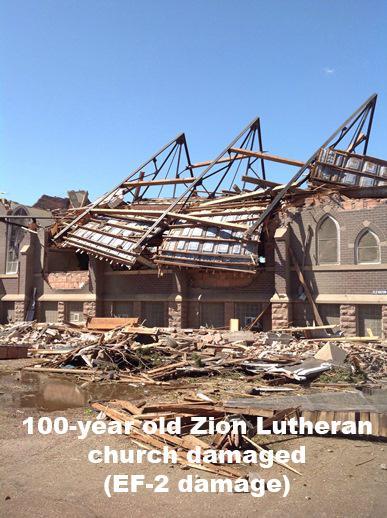
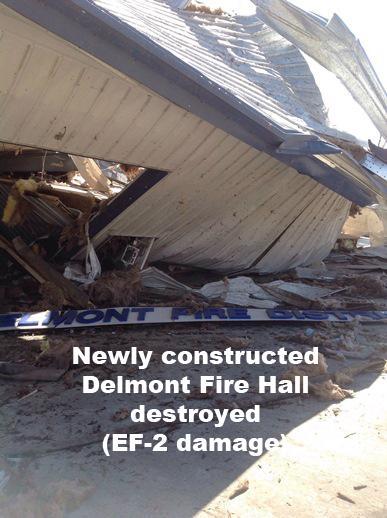
Below are a few photos taken during the National Weather Service Damage Assessment conducted on the afternoon of May 10, 2015.
Radar loop of the tornadic thunderstorm
A closer look at the tornado when it moved through Delmont, SD
With dual-polarization radar, it is now possible to see evidence of debris that is lofted by the tornado. This is called a Tornado Debris Signature (TDS). There are 3 items that meteorologists look for when trying to identify a TDS - high reflectivity, strong rotation, and a low correlation coefficient. We look for high reflectivity because debris is large compared to most of the rain and hail that is associated with the storm so it will reflect back energy to the radar. We look for a circulation so that we know that the high reflectivity is associated with a strong circulation, i.e. the tornado. Finally, we look for low correlation coefficient because it tells us that the items being reflected are all different shapes. Debris that is lofted by a tornado can be any shape and size unlike rain drops which have a very similar shape and size.
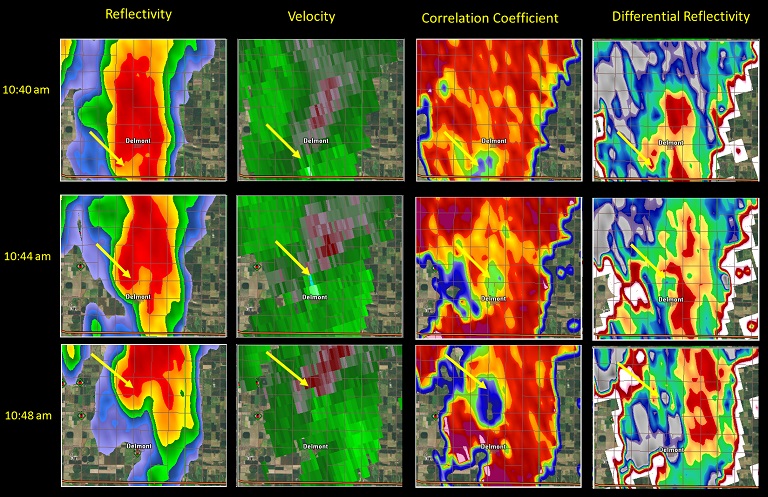
Below is the reflectivity, velocity, correlation coefficient and differential reflectivity from approximately 6100 feet above the surface. The yellow arrow is the approximate location of the strongest circulation on the radar. Note that this may not be the exact location of the tornado at the surface.
Click here to view larger version of this image.
Notice that as the tornado moves north through Delmont, the reflectivity (far left) changes little. The circulation shown in the velocity field appears to increase at 10:44 am and then weaken again at 10:48 am. The biggest change is with the correlation coefficient. While it is reduced at 10:40 am - likely from lofted debris that came from farmsteads south of Delmont - the correlation coefficient decreases near the circulation and expands in area after moving through Delmont. While it is uncertain that the decrease in correlation coefficient at 10:48 am is due to debris since the reflectivity is lower south of the circulation near Delmont, it is likely that some of decrease is the result of more debris being lofted into the air by the tornado. Notice that this
occurs even as the circulation at 6000 feet appears to decrease between 10:44 am and 10:48 am.
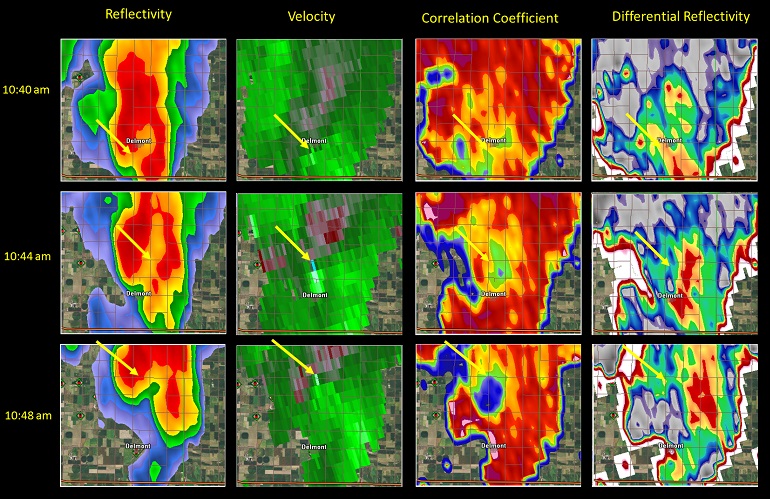
Next is the same images except at 0.9 degrees which is approximately 9500 ft above the surface.
Click here to view a larger version of this image.
Again, in the reflectivity image, there is little change in reflectivity as the tornadic supercell move north through Delmont. The velocity data shows the circulation increasing between 10:40 and 10:44 am with little change at 10:48 am. When looking at the correlation coefficient at 10:40 am, there is a minimum (light green) in values east of Delmont but overall it is difficult to discern if this is the result of debris. But as the tornado moves through Delmont in the next 8 minutes, the area of minimum correlation coefficient increases in area. Again, at 10:48 am, the southern portion of the lower correlation coefficient (dark blue) is to the south of the high reflectivity. A large portion of the decreased correlation coefficient is co-located with the circulation and the higher (yellow and red) reflectivity. This is in part because there was more debris being lofted as the tornado moved through Delmont, and may also indicate that the tornado was stronger. Research has begun to show that stronger tornadoes will loft debris higher into the atmosphere with EF2 tornadoes observed to loft debris over 10000 ft.
Other information about this tornado:
...NWS DAMAGE SURVEY FOR 05/10/15 TORNADO EVENT...

...EF-2 TORNADO HITS DELMONT SOUTH DAKOTA...

RATING:                 EF-2
ESTIMATED PEAK WIND:    130 MPH
PATH LENGTH /STATUTE/:  16.3 MILES
PATH WIDTH /MAXIMUM/:   400 YARDS
FATALITIES:             0
INJURIES:               9

START DATE:             MAY 10 2015
START TIME:             10:21 AM CDT
START LOCATION:         3 MILES EAST OF WAGNER / CHARLES MIX COUNTY / SD
START LAT/LON:          43.092 / -98.232

END DATE:               MAY 10 2015
END TIME:               10:52 AM CDT
END LOCATION:           5 MILES NORTH OF DELMONT / DOUGLAS / SD
END_LAT/LON:            43.335 / -98.159

SURVEY_SUMMARY: OVER 20 BUILDINGS WERE DAMAGED IN DELMONT SOUTH DAKOTA.
ADDITIONAL INFORMATION WILL BE AVAILABLE ON MONDAY.

EF SCALE: THE ENHANCED FUJITA SCALE CLASSIFIES
TORNADOES INTO THE FOLLOWING CATEGORIES.

EF0...WEAK......65 TO 85 MPH
EF1...WEAK......86 TO 110 MPH
EF2...STRONG....111 TO 135 MPH
EF3...STRONG....136 TO 165 MPH
EF4...VIOLENT...166 TO 200 MPH
EF5...VIOLENT...>200 MPH

NOTE:
THE INFORMATION IN THIS STATEMENT IS PRELIMINARY AND SUBJECT TO
CHANGE PENDING FINAL REVIEW OF THE EVENT AND PUBLICATION IN
NWS STORM DATA.

$$