 |
|||||||||||||||||||||||||||||||||||||||||||||||||||||||||||||||||||||||||||||||||||||||||||||||||||||
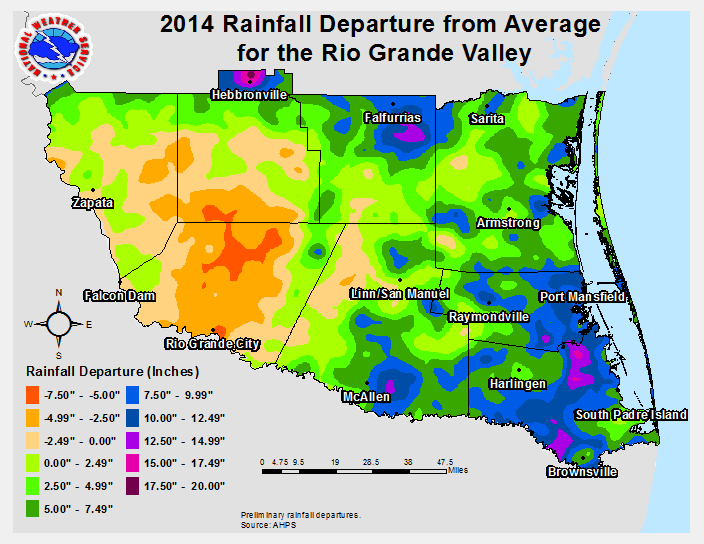 2014 Rio Grande Valley Rainfall Departure from Average (inches). |
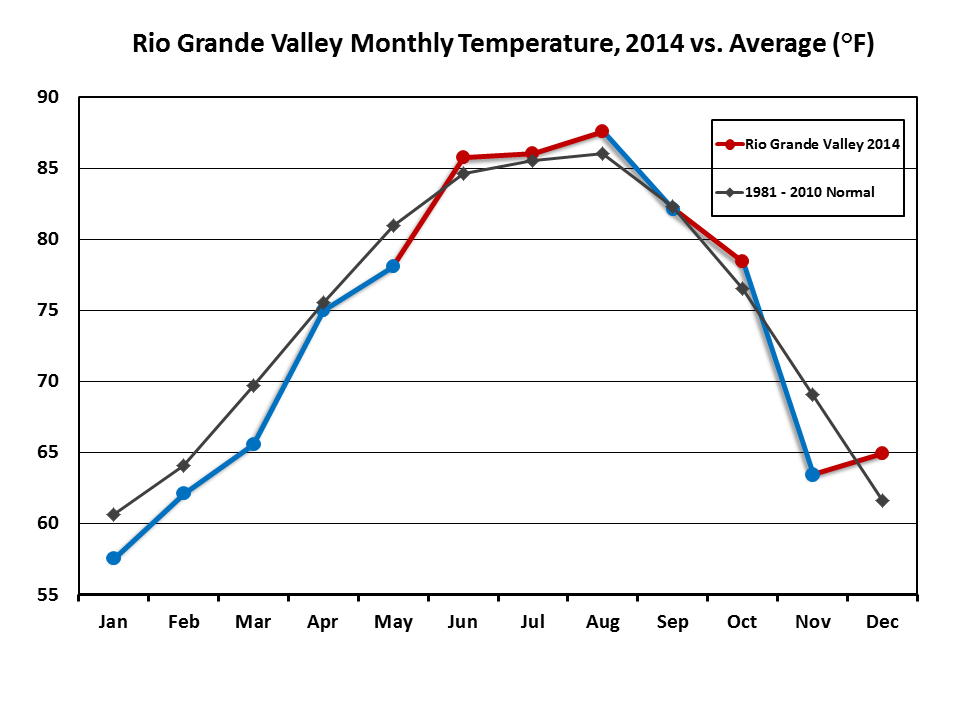 2014 Rio Grande Valley monthly average temperatures (circles) vs. the 1981-2010 30 year average (gray diamonds). Blue circles and lines indicate months with below average values; red circles/lines indicate above average values. |
||||||||||||||||||||||||||||||||||||||||||||||||||||||||||||||||||||||||||||||||||||||||||||||||||||
*Non–calendar day observations may be slightly off at beginning and end of year.
†Missing more than 100 observations, which may result in undervalue. |
|||||||||||||||||||||||||||||||||||||||||||||||||||||||||||||||||||||||||||||||||||||||||||||||||||||
| Cold, Hot, Dry, Wet: 2014 Had it all for RGV Year in Review: Cool, Dry Start; Wet Finish Drought Wanes and Waxes through Spring as Cool Rules |
|||||||||||||||||||||||||||||||||||||||||||||||||||||||||||||||||||||||||||||||||||||||||||||||||||||
|
In Brief For the year, preliminary temperatures at the three primary Valley locations were as follows:
Continue reading for a capsule of the many weather stories through 2014. Links are provided to take you to the full details of each event. |
|||||||||||||||||||||||||||||||||||||||||||||||||||||||||||||||||||||||||||||||||||||||||||||||||||||
| January to March: "Chill" Will | |||||||||||||||||||||||||||||||||||||||||||||||||||||||||||||||||||||||||||||||||||||||||||||||||||||
|
It didn’t take long for January to show a wintry hand. Less than a week after ringing in the new year, the edge of the North Pole Express brought a touch of sleet and "feels like" temperatures dipped into the 20s to around 30 for the first full day back at school and work for many. A warm–up to spring–like weather followed into mid month before the bottom fell out twice more toward month’s end: On January 24th, frigid "feels like" temperatures and a dusting of snow in Zapata brought back winter’s reality. The coup de grace happened five days later, when the second ice storm in three years coated trees, fences, power lines, etc. with ½ to 1 inch of glaze early on the 29th. Temperatures holding right around 32°F had followed a warm–up two days earlier, and kept accretion from even elevated road surfaces. Schools held a late opening, which was the perfect call as temperatures quickly warmed into the 40s. February picked up where the last week of January left off: chilly, brisk and raw. The first half of February ended nearly 10°F below average, and included a light freeze on the 12th. Included in the cold start was a second round of light glaze ice, this time for the South Texas Brush Country from parts of Zapata through northern Jim Hogg, Brooks, and Kenedy County on the 6th and 7th. For more than 40 hours, temperatures failed to reach 40°F and stiff north winds kept "feels–like" temperatures in the 20s, making the period the coldest of the entire winter. The cold first half would turn mild to warm and rather humid for the second half, with most days reaching the 80s away from the coast. The contrast of the warm, humid air overriding the still–chilly nearshore Gulf of America led to a prolonged period of dense sea fog on South Padre Island between the 22nd and 26th. Though meteorological winter (December to February) was over, the Julian Calendar (winter continues through the late March equinox) and the atmosphere had other ideas in March. One more round of nasty chill paid a visit on March 2nd and 3rd, bringing the sharpest one–day temperature crash of the entire season – more than 50°F in less than 24 hours! This chart–topping event fittingly ended a roller coaster of a season where temperature changes felt like riding the Titan™ at Six Flags Over Texas; between November and early March, there were seven day to day changes of 35°F or more between 2 PM and 2 PM at Harlingen, five more cases than in any season since 2004, and possibly an all–time record. A round of helpful rainfall between the 8th and 10th combined with periodic winter rains to temporarily kill off the dry/drought conditions for most of the Lower and Mid Valley for the first time since November 30, 2013. The rain, combined with below average temperatures, brought a nice spring green–up to the Valley as increasing sun angle percolated the ample soil moisture into grass growth and tree re–leaf. |
|||||||||||||||||||||||||||||||||||||||||||||||||||||||||||||||||||||||||||||||||||||||||||||||||||||
| April to June: Warmth Returns; Spotty Severe Weather Arrives | |||||||||||||||||||||||||||||||||||||||||||||||||||||||||||||||||||||||||||||||||||||||||||||||||||||
|
Dry and warmer conditions are par for the course in April, and 2014 generally lived up to the billing. The moist gray ’northers of March were replaced by drier, windier blue ’northers in April, particularly on the 7th and 14th. The event on the 14th brought widespread 40 to 50 mph gusts that caused minor damage to unfastened, light weight objects. The drier air masses brought a several days of very low humidity to the region, ultimately returning moderate drought to parts of the mid and upper Valley. The biggest story may have been a brief period of very hot and dry weather that peaked on April 27th, when the hottest temperatures since September 4, 2011 set daily records. May brought the season’s first severe weather episodes. On May 9th, a squall line roared across the Rio Grande Plains and through the Valley, knocking down dozens of large limbs, power lines and power poles, and at least one roof on its way to South Padre Island and the nearshore Gulf waters, where 58 mph winds whipped through just before midnight. Two separate smaller episodes affected Brooks County (27th) and scattered locations along the Rio Grande (28th) as a weakening late season front energized the hot, humid atmosphere in favorable northwesterly flow well above the surface. On the 27th, a weakening supercell produced golfball sized hail, 60 mph winds, and local flooding in Falfurrias; the cell had dropped a tornado with EF1 intensity (86 to 110 mph) in Jim Wells County. On the 28th, the dissipating boundary re–fired scattered severe thunderstorms in Cameron, Hidalgo, and Starr County during the late afternoon and evening. Full details of the event are here. June was largely quiet, giving the region plenty of time to think about hurricane preparedness. Daily and monthly temperatures were only a fraction from average, ending a hair above. Rainfall, however, ended well below average, with just a smattering across the region during the final week. The lack of rainfall began a slow expansion of moderate drought from the Upper Valley into the Lower/Mid Valley by month&rsquoi;s end. To Page 2 |
|||||||||||||||||||||||||||||||||||||||||||||||||||||||||||||||||||||||||||||||||||||||||||||||||||||

