Overview & Graphics
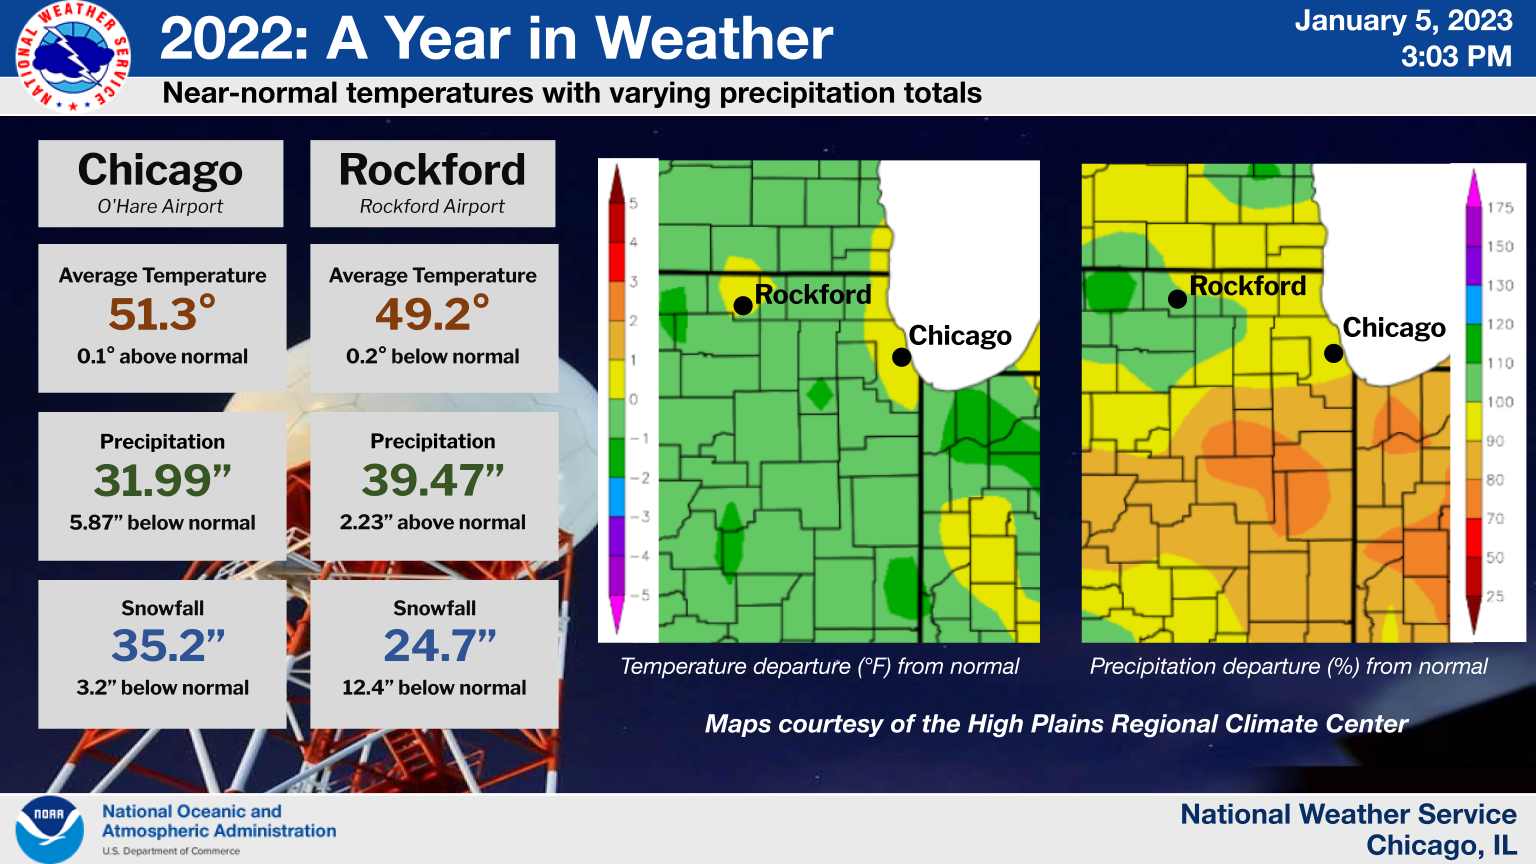 |
| The 2022 calendar year as a whole featured temperatures that averaged out to near-normal. Most of the area finished the year with below normal liquid precipitation totals, though portions of interior northern Illinois ended up with above normal precipitation totals for the year as a result of a couple of heavy rain events. Additionally, Chicago and Rockford both concluded the year with below normal snowfall totals. |
CoCoRaHS Observer Annual Precipitation Summary
CoCoRaHS Observer Annual Snowfall Summary
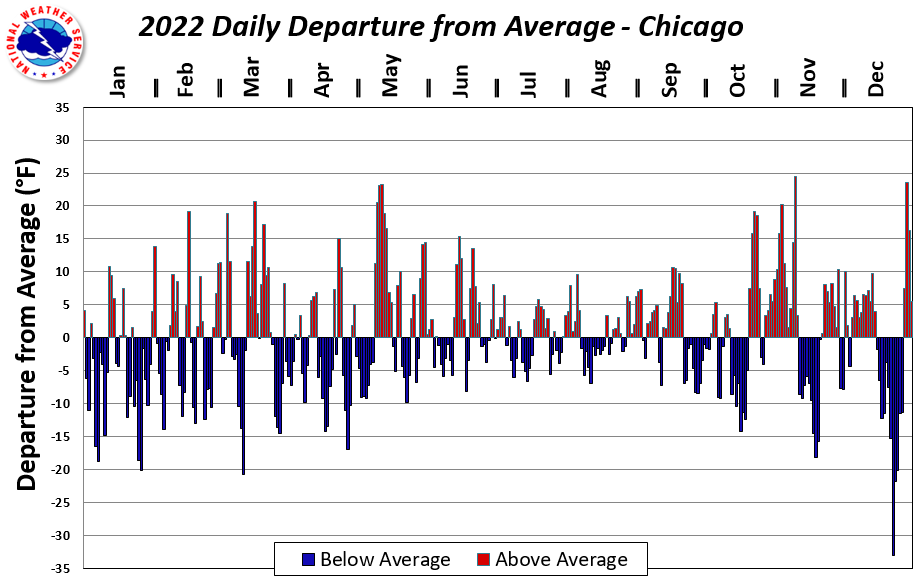 |
| Chicago (O'Hare) Daily Temperature Departures from Average in 2022 |
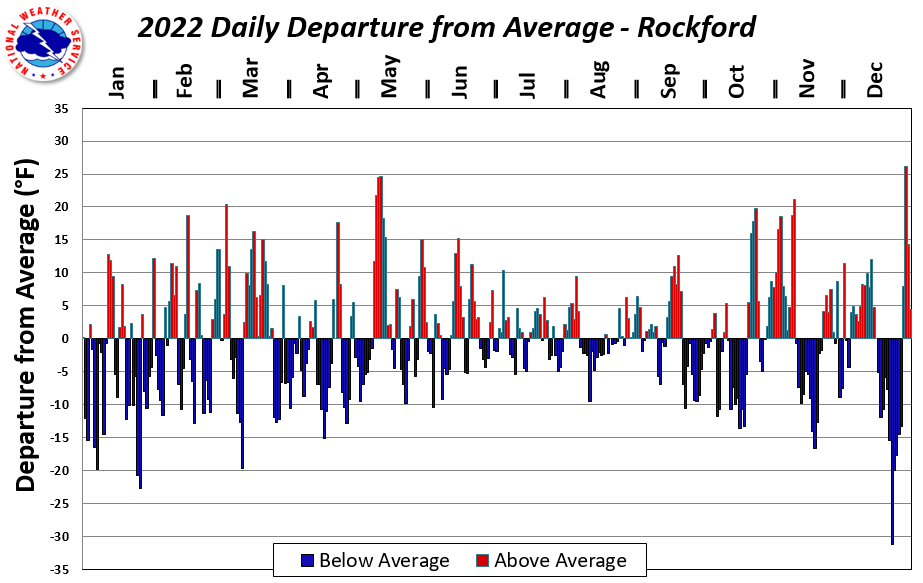 |
| Rockford Daily Temperature Departures from Average in 2022 |
Chicago and Rockford Annual Summary
Public Information Statement
National Weather Service Chicago IL
1234 PM CST Sun Jan 1 2023 /134 PM EST Sun Jan 1 2023/

...A Look Back at the Climate for the 2022 Calendar Year for Chicago
and Rockford...

Chicago Temperatures and Precipitation:

The average high temperature for Chicago in 2022 was 59.7 degrees,
which is 0.2 degrees above the 1991 to 2020 normal annual average
high temperature of 59.5 degrees. The average low temperature was
42.8 degrees, which is 0.2 degrees below the 1991 to 2020 normal
annual average low temperature of 43.0 degrees. The mean average
temperature for the year was 51.3 degrees, which is 0.1 degrees
above the 1991 to 2020 normal annual mean average temperature of
51.2 degrees.

A total of 31.99 inches of liquid precipitation was recorded during
the year, which is 5.87 inches below the 1991 to 2020 normal annual
precipitation total of 37.86 inches.

A total of 35.2 inches of snow was recorded during the year, which
is 3.2 inches below the 1991 to 2020 normal annual snowfall total of
38.4 inches.


Below is a listing of daily, monthly, seasonal, and annual
temperature and precipitation records that were established for
Chicago in 2022...

JANUARY -- No daily or monthly records set.

FEBRUARY --
* Record daily highest minimum temperature of 41 degrees on the 16th.

MARCH -- No daily or monthly records set.

APRIL -- No daily or monthly records set.

MAY --
* Tied record daily highest minimum temperature of 69 degrees on the
  10th.
* Record daily highest minimum temperature of 74 degrees on the 11th.
* Record daily maximum temperature of 90 degrees on the 11th.
* Record daily highest minimum temperature of 74 degrees on the 12th.
* Tied record daily maximum temperature of 89 degrees on the 13th.
* Record daily highest minimum temperature of 74 degrees on the 31st.

JUNE --
* Record daily maximum temperature of 96 degrees on the 15th.

JULY -- No daily or monthly records set.

AUGUST -- No daily or monthly records set.

SEPTEMBER -- No daily or monthly records set.

OCTOBER --
* Tied record daily snowfall of a trace on the 17th.
* Tied record daily highest minimum temperature of 63 degrees on the
  24th.

NOVEMBER --
* Record daily highest minimum temperature of 61 degrees on the 4th.
* Record daily highest minimum temperature of 60 degrees on the 10th.
* Record daily maximum temperature of 76 degrees on the 10th.

DECEMBER -- No daily or monthly records set.

SEASONAL -- No top ten seasonal records set.

ANNUAL -- No top ten annual records set.

...................................................................

Rockford Temperatures and Precipitation:

The average high temperature for Rockford in 2022 was 59.5 degrees,
which is 0.7 degrees above the 1991 to 2020 normal annual average
high temperature of 58.8 degrees. The average low temperature was
38.9 degrees, which is 1.1 degrees below the 1991 to 2020 normal
annual average low temperature of 40.0 degrees. The mean average
temperature for the year was 49.2 degrees, which is 0.2 degrees
below the 1991 to 2020 normal annual mean average temperature of
49.4 degrees.

A total of 39.47 inches of liquid precipitation was recorded during
the year, which is 2.23 inches above the 1991 to 2020 normal annual
precipitation total of 37.24 inches.

A total of 24.7 inches of snow was recorded during the year, which
is 12.4 inches below the 1991 to 2020 normal annual snowfall total
of 37.1 inches.


Below is a listing of daily, monthly, seasonal, and annual
temperature and precipitation records that were established for
Rockford in 2022...

JANUARY -- No daily or monthly records set.

FEBRUARY -- No daily or monthly records set.

MARCH -- No daily or monthly records set.

APRIL --
* Record daily minimum temperature of 22 degrees on the 17th.
* Tied record daily precipitation of 1.16 inches on the 22nd.

MAY --
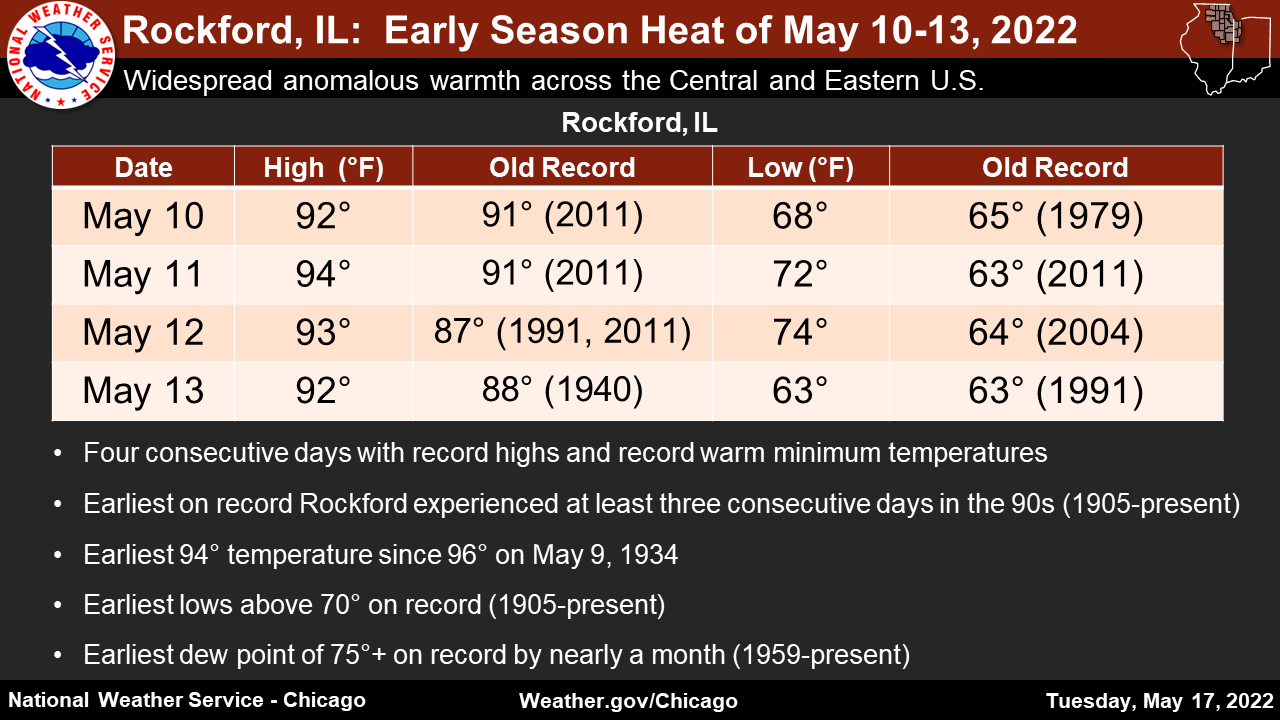
* Record daily highest minimum temperature of 68 degrees on the 10th.
* Record daily maximum temperature of 92 degrees on the 10th.
* Record daily highest minimum temperature of 72 degrees on the 11th.
* Record daily maximum temperature of 94 degrees on the 11th.
* Record daily highest minimum temperature of 74 degrees on the 12th.
* Record daily maximum temperature of 93 degrees on the 12th.
* Tied record daily highest minimum temperature of 63 degrees on the
  13th.
* Record daily maximum temperature of 92 degrees on the 13th.
* Tied record daily highest minimum temperature of 70 degrees on the
  30th.
* Tied record daily highest minimum temperature of 68 degrees on the
  31st.

JUNE --
* Tied record daily maximum temperature of 98 degrees on the 14th.
* Tied record daily highest minimum temperature of 74 degrees on the
  15th.
* Record daily maximum temperature of 97 degrees on the 15th.
* Tied record daily minimum temperature of 46 degrees on the 19th.
* Tied record daily maximum temperature of 100 degrees on the 21st.

JULY -- No daily or monthly records set.

AUGUST --
* Record daily precipitation of 3.23 inches on the 8th.
** 7th wettest August on record since 1905 with 8.88 inches of
precipitation.

SEPTEMBER --
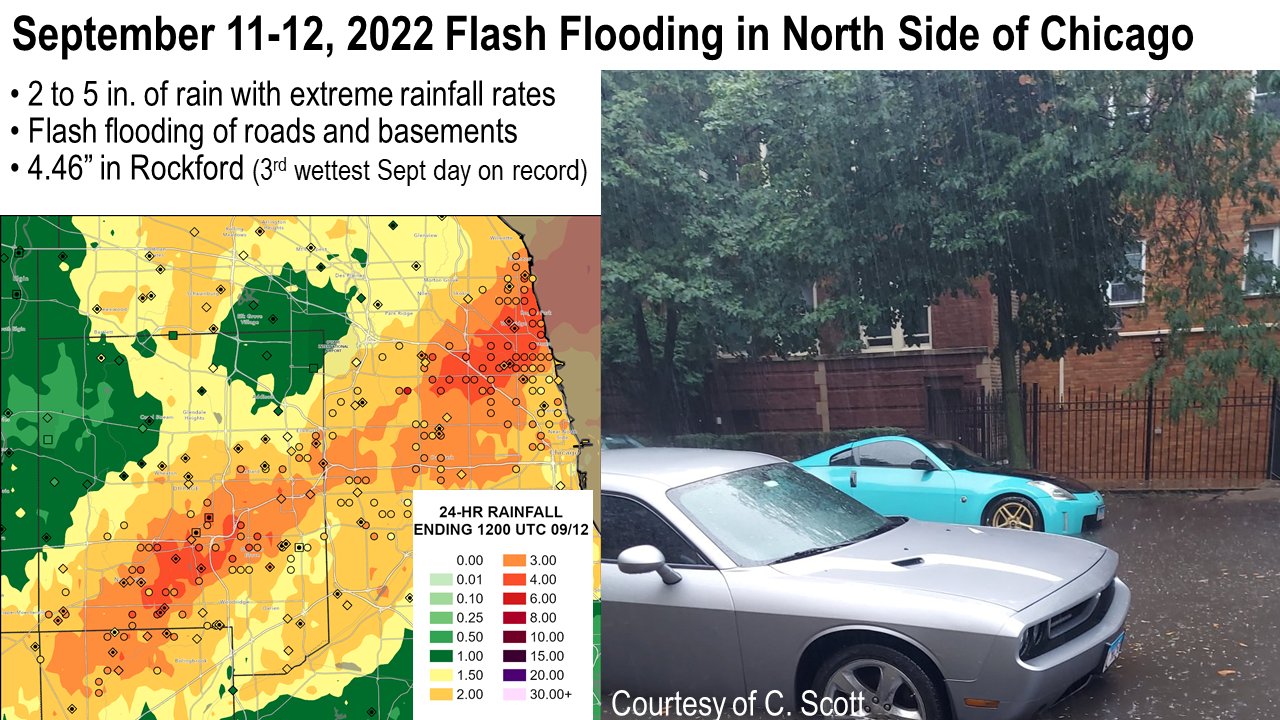
* Record daily precipitation of 4.46 inches on the 11th.

OCTOBER --
* Tied record daily snowfall of a trace on the 17th.
* Record daily lowest maximum temperature of 42 degrees on the 17th.

NOVEMBER --
* Record daily highest minimum temperature of 59 degrees on the 4th.
* Record daily maximum temperature of 76 degrees on the 10th.
* Tied record daily snowfall of 0.8 inches on the 16th.

DECEMBER --
* Record daily precipitation of 1.70 inches on the 14th.

SEASONAL -- No top ten seasonal records set.

ANNUAL -- No top ten annual records set.

$$
Events
 |
 |
 |
 |
NWS Chicago Science and Past Events Page