Bitter cold temperatures and dangerous wind chills will persist from Florida to the Northeast through Monday. Daily record low temperatures are forecast across the Southeast and Florida, with some all-time February low temperature records possible across Florida. An Alberta clipper will spread wintry precipitation across the Northern Plains today and into the upper Great Lakes into tonight. Read More >
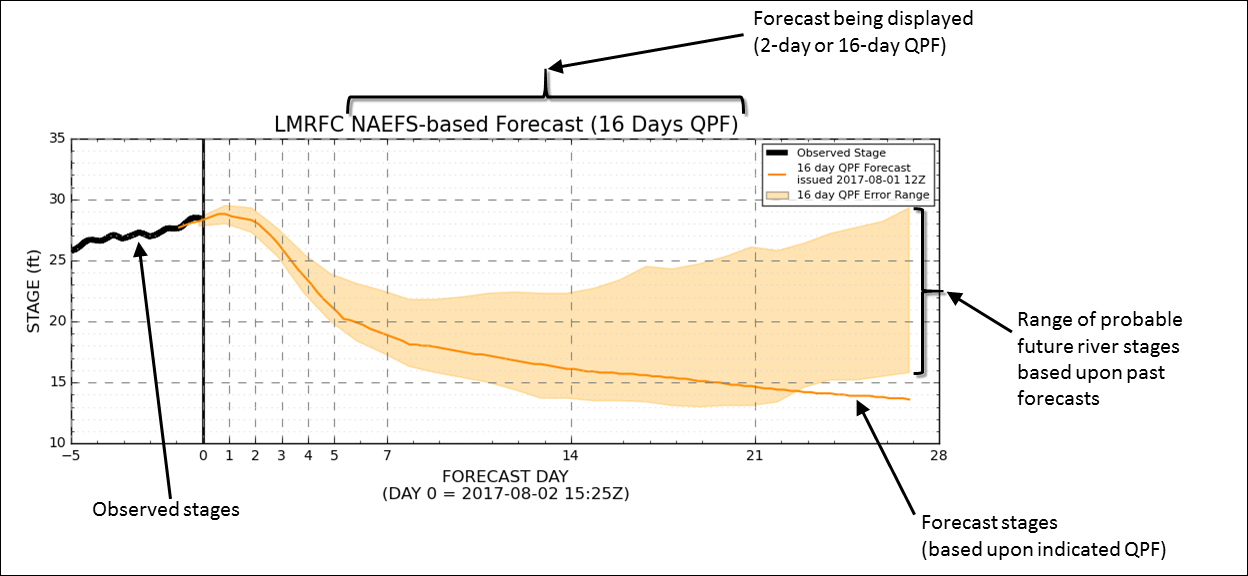
The experimental 28-day forecast plots for the Lower Ohio and Lower Mississippi Rivers show two forecasts 28 days into the future using two different sources of future rainfall. The official river forecast uses the official 2-day forecast rainfall product which is produced by human forecasters. The second river forecast uses 16 days of forecast rainfall directly from a computer model called the North American Ensemble Forecast System (NAEFS). Along with the forecasts, a shaded area is also shown which indicates uncertainty for the forecast each day in the future.
The shaded area represents the probable future river stage based on the present forecast and the past forecast skill. The shaded areas capture 2/3 of the past forecast errors, centered on the median error. Forecast uncertainty is based on forecasts issued from October 2014 through September 2019. Forecast statistics are updated yearly in late October or early November. This uncertainty range was selected to closely match the precedent set by the National Hurricane Center in conveying forecast uncertainty. There are cases during high/low water levels when the range of the high or low error value exceeds the physical constraints of a given location. Where these maximum/minimum physical constraints are known, they are incorporated as caps in the displayed error range.
For many types of forecasts, as lead times increase, forecast uncertainty also increases. For example, the error in a forecast made 2 days in advance is very likely to be less than the error in a forecast made more than a week in advance. This is also true for forecasts on the Lower Mississippi and Ohio Rivers. For longer range forecasts (such as those issued out to 28 days into the future), a good portion of the error is due to forecast rainfall. Because the Lower Mississippi River watershed is so large, it is likely that rainfall will fall somewhere within the basin over periods of a few weeks or more. Official forecasts, however, use only 2-days of future rainfall. This means that after any rainfall in that 2 day period has taken effect, the river will start to fall, and continue to fall, through the remainder of the 28-day period. In 2014, LMRFC began issuing an experimental forecast product for selected locations on the Mississippi River using 16-days of forecast rainfall.
During fall 2015, LMRFC hydrologists began analyzing both 28-day forecasts using the different future rainfall sources to compare performance at different lead times. The results of this study were compiled in 2016. For most river locations that were studied, the experimental 16-day future rainfall forecast had lower average error at lead times of more than 1 week when compared to the forecasts using only 2 days of future rainfall. During fall of 2016, LMRFC hydrologists analyzed both 28-day forecasts to determine the error percentiles for each forecast day (lead time). The 16.67 and 83.33 percentile values for error were used (because 66.67%, or 2/3, of error values are in between) to create the shaded uncertainty area.
