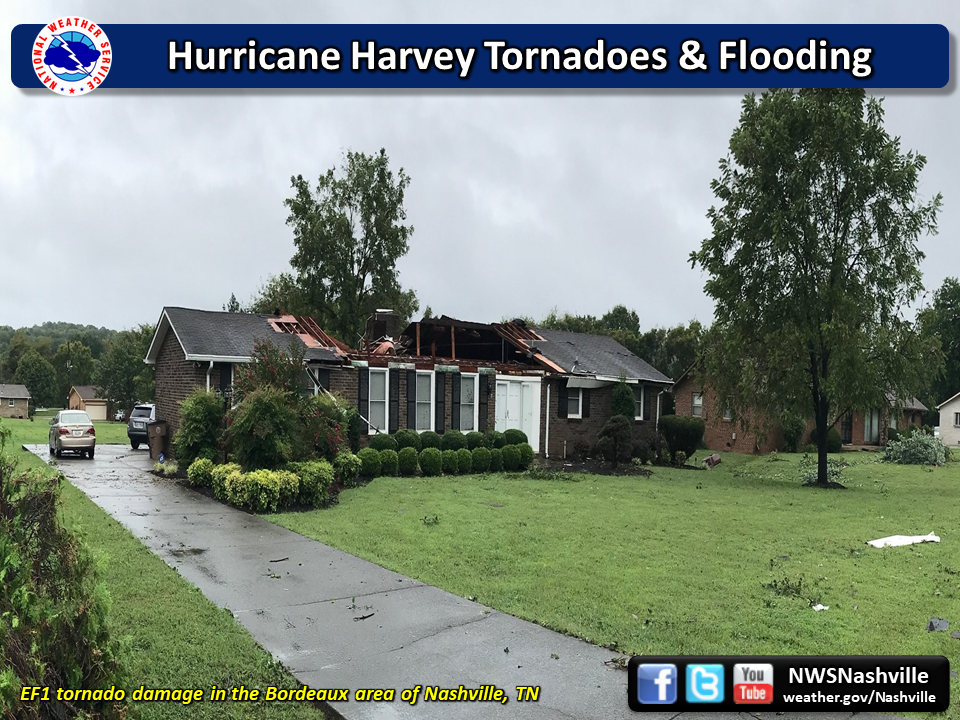
| Tornado Statistics | ||||||||
| # | Counties | Rating | Time (CDT) | Length (miles) | Width (yards) | Fatalities | Injuries | |
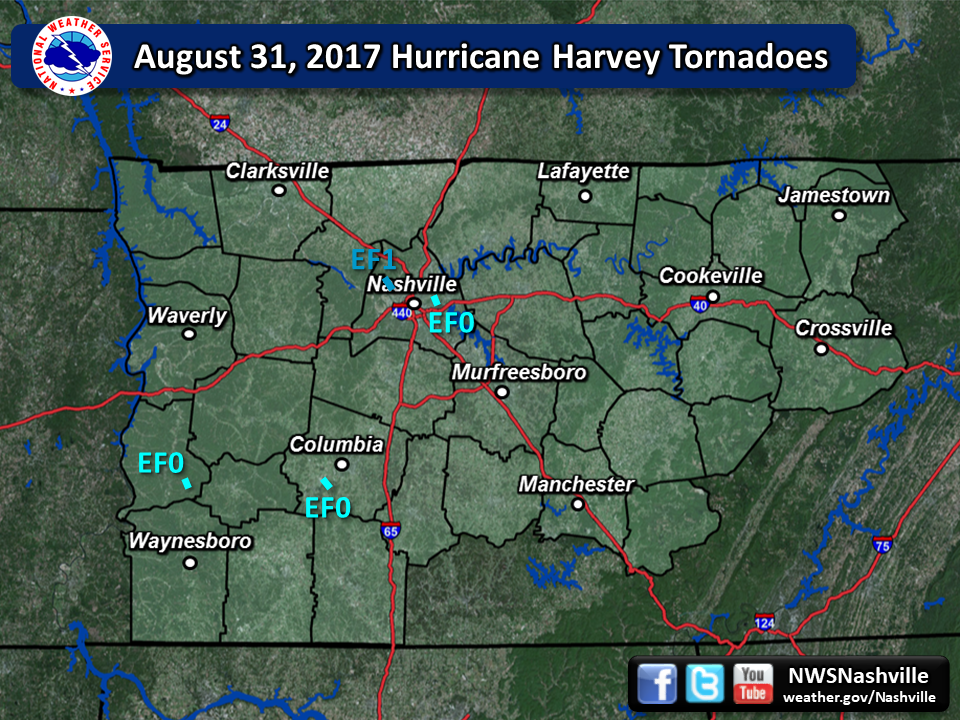
| 1 | Perry | EF0 | 419 PM | 0.25 miles | 50 yards | 0 | 0 | |
| 2 | Maury | EF0 | 511 PM | 3.5 miles | 50 yards | 0 | 0 | |
| 3 | Davidson | EF1 | 1128 PM | 0.7 miles | 75 yards | 0 | 0 | |
| 4 | Davidson | EF0 | 1147 PM | 1 mile | 50 yards | 0 | 0 | |
| Overview | |
|
One week after Hurricane Harvey made landfall along the middle Texas coast, a weakened but still intense Tropical Depression Harvey moved across Middle Tennessee from Thursday August 31, 2017 into Friday September 1, 2017. Strong winds up to 50 mph associated with the circulation of Harvey brought down numerous trees and power lines, knocking out power to thousands of residents. In addition, supercells rotating around Harvey spawned four tornadoes across Middle Tennessee, and heavy rainbands produced 8-10" of rain in some areas, leading to major flash flooding in parts of northern Middle Tennessee. |
| Reports & Outlooks | ||||
| SPC Storm Reports | SPC Event Archive | Local Storm Reports | Storm Surveys | |
| Harvey Peak Winds | |
|
|
| Harvey Rainfall Totals | |
|
|
| Harvey Rainfall Map | |
| Radar | |
| Coming soon! |
| Hurricane Harvey Middle Tennessee Tornadoes | |
 |
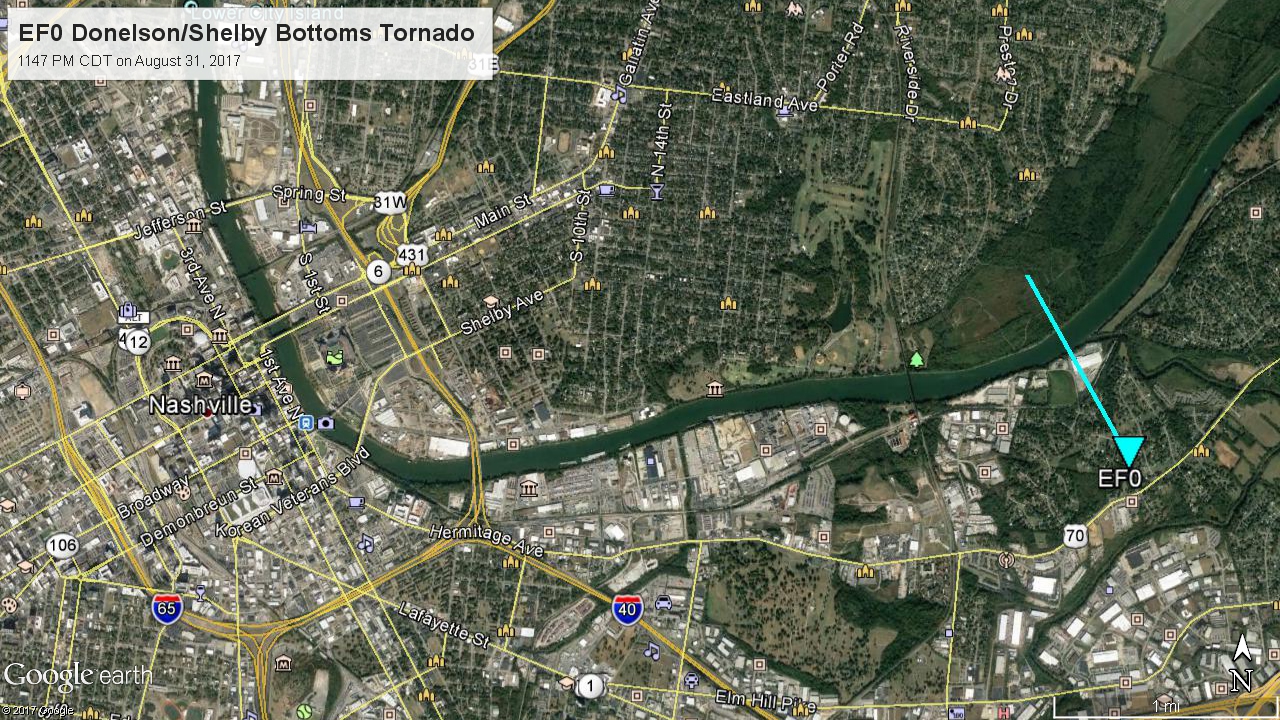
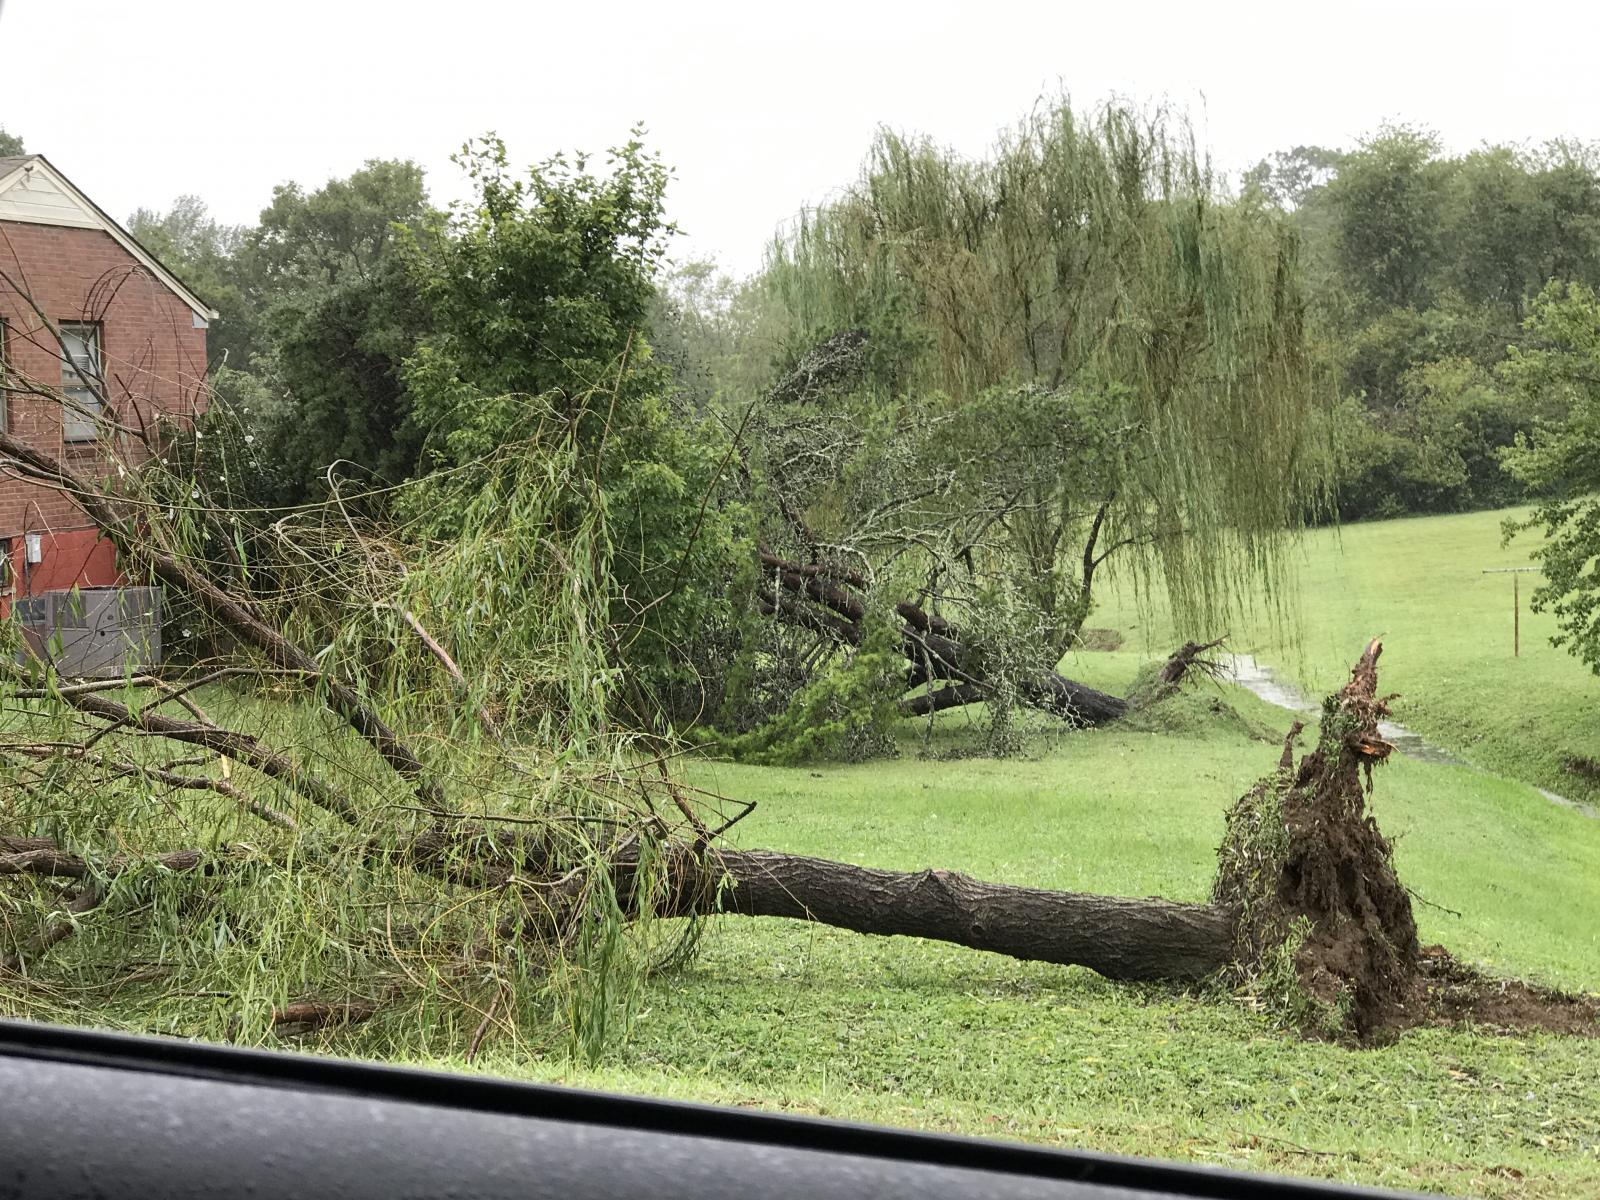
| EF0 Southeast Nashville Tornado | ||||||||
| Counties: | Davidson | |||||||
| Time: | 1147 PM CDT | |||||||
| EF Scale: | EF0 | |||||||
| Estimated Peak Winds: | 75 mph | |||||||
| Damage Path Length: | 1.0 miles | |||||||
| Damage Path Width: | 50 yards | |||||||
| Fatalities: | 0 | |||||||
| Injuries | 0 | |||||||
|
Storm Survey:
|
||||||||
|
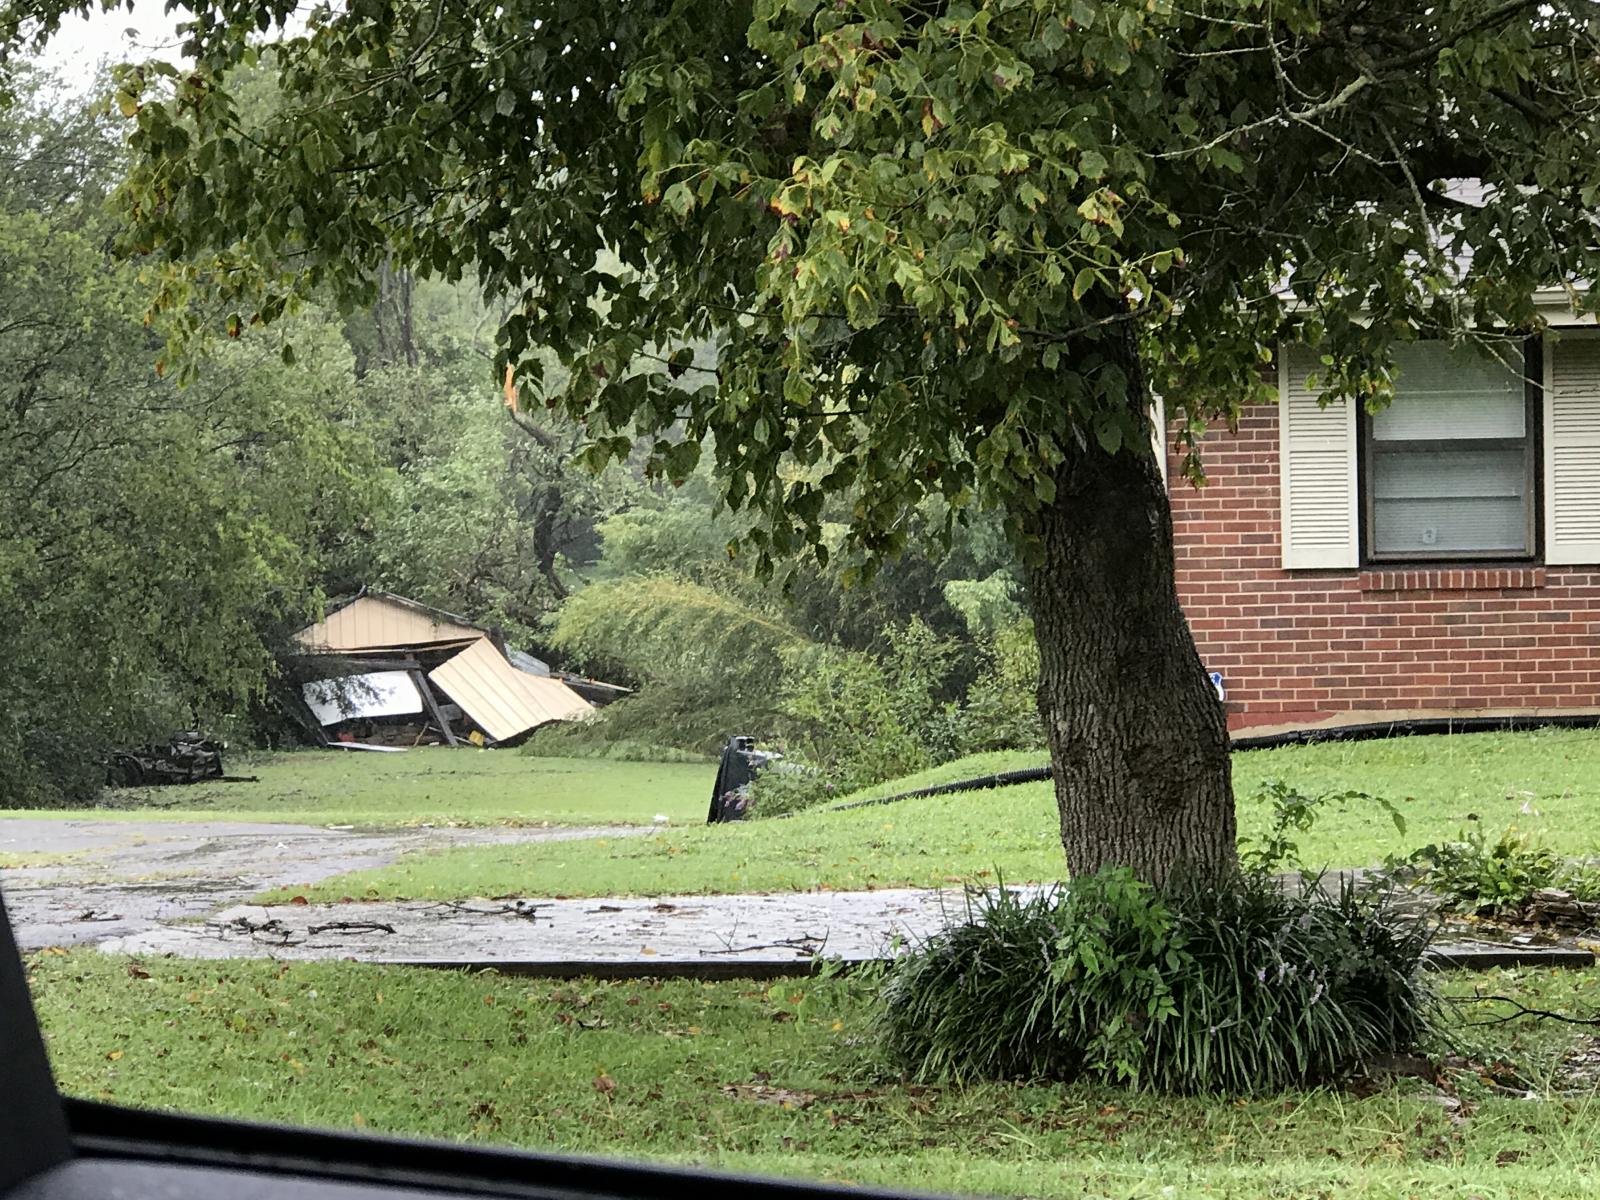
Donelson/Shelby Bottoms Damage Survey Photos & Map |
||||||||
 |
 |
|||||||
 |
 |
|||||||
| EF0 Perry County Tornado | ||||||||
| Counties: | Perry | |||||||
| Time: | 419 PM CDT | |||||||
| EF Scale: | EF0 | |||||||
| Estimated Peak Winds: | 80 mph | |||||||
| Damage Path Length: | 0.25 miles | |||||||
| Damage Path Width: | 50 yards | |||||||
| Fatalities: | 0 | |||||||
| Injuries | 0 | |||||||
|
Storm Survey:
|
||||||||
|
Perry County Damage Photos & Map |
||||||||
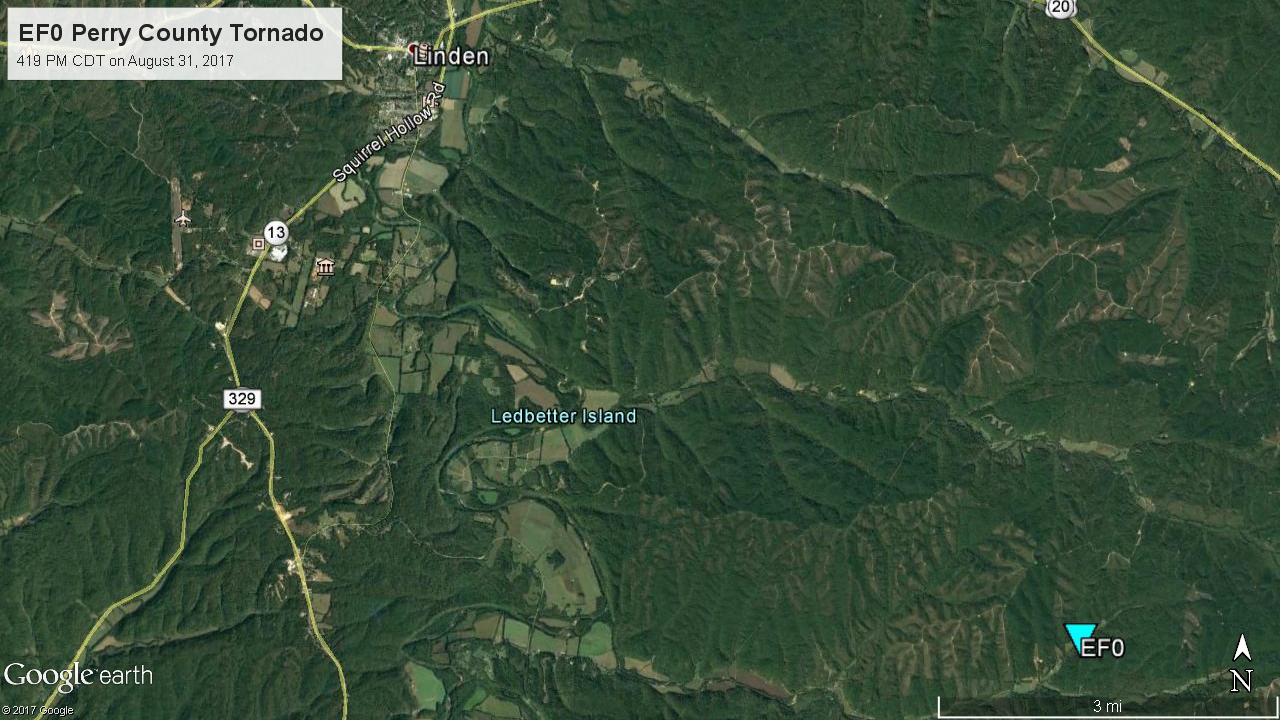 |
 Photo courtesy of WOPC News |
|||||||