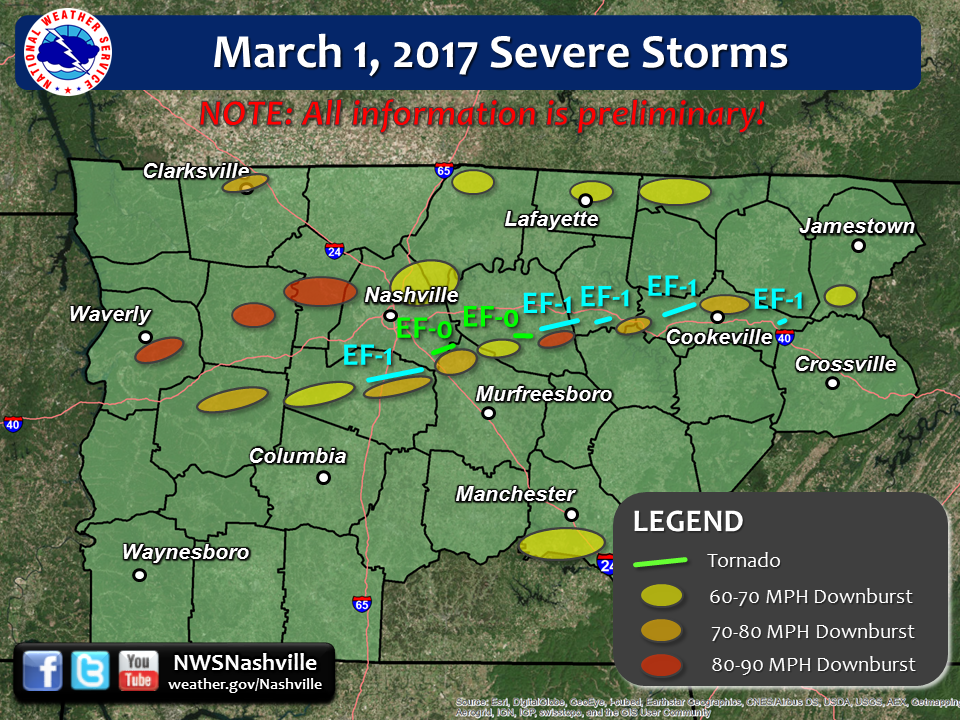
| Tornado Statistics | ||||||||
| # | Counties | Rating | Time (CST) | Length (miles) | Width (yards) | Fatalities | Injuries | |
| 1 | Williamson | EF1 | 0700 | 10.5 | 250 | 0 | 0 | |
| 2 | Davidson/Rutherford | EF0 | 0717 | 3.38 | 75 | 0 | 0 | |
| 3 | Wilson | EF0 | 0737 | 3.33 | 100 | 0 | 0 | |
| 4 | Wilson/Smith | EF1 | 0740 | 6.69 | 200 | 0 | 0 | |
| 5 | Smith | EF1 | 0751 | 3.91 | 200 | 0 | 0 | |
| 6 | Putnam | EF1 | 0804 | 7.67 | 150 | 0 | 0 | |
| 7 | Putnam | EF1 | 0835 | 0.90 | 100 | 0 | 0 | |
| Overview | |
| The most damaging severe weather outbreak in Middle Tennessee since the December 23, 2015 Tornado Outbreak struck during the morning hours on March 1, 2017. A line of strong to severe thunderstorms with embedded circulations, known as a Quasi-Linear Convective System (or QLCS), moved rapidly across Middle Tennessee at 60-70 mph from west to east between 6 AM and 10 AM CST. Additional severe thunderstorms developed later in the morning and affected areas of southern Middle Tennessee from the late morning into the early afternoon hours. Widespread damaging winds were reported in nearly every county along and north of I-40 across Middle Tennessee, with winds estimated up to 90 mph in some areas. These intense downburst winds caused 3 injuries - two in Clarksville when a tree fell on a mobile home, and one in Lavergne when a tractor trailer flipped over. In addition to the damaging winds, 7 confirmed tornadoes also touched down from the Nashville metro area eastward to the Upper Cumberland, damaging hundreds of homes and businesses. Several reports of large hail were also received in parts of southern Middle Tennessee. |
| Radar | |||
|
|||
| Reports & Outlooks | ||||
| SPC Storm Reports | SPC Event Archive | GIS Damage Map | Local Storm Reports | Public Information Statements |