Mark A. Rose
Meteorologist
National Weather Service
Old Hickory, Tennessee
I. Introduction
The worst ice storm in the history of Nashville, Tennessee, known as the "Great Blizzard," began on Monday, 29 January 1951 and ended on 1 February, causing a complete shutdown of transportation in Nashville for two days. By noon on 1 February, Nashville lay buried under 8 inches of ice and snow. Significant effects from the storm were felt for several days following the end of the precipitation.
The entire area suffered from power failures. Over 16,000 homes and 80,000 residents were without electricity, and over 2,000 telephones were out. Damage to transportation and communication systems alone easily exceeded $2 million (1951 dollars) (Alligood 2001). Miles of power and telephone lines had to be re-strung. Roofs collapsed because of the weight of snow and ice. Two people died in weather-related car crashes, and dozens of others were injured. Hundreds of automobiles were abandoned across the city, and thousands of trees had to be cleared from roads. No businesses opened for 3 days. Eastern Air Lines canceled flights for three days (Crowe and Foster). Trains of the Louisville & Nashville Railroad were as much as two days behind schedule.
In addition, gas and oil furnaces expended their fuel, forcing Nashvillians to seek alternative means of heat. And to exacerbate the problem, there were threats of floods as rain swollen creeks spilled over their banks due to the excessive precipitation (Historic Nashville). [1]
When the thaw finally began on 5 February, thousands of residents who had been stuck inside their homes took to the streets at the same time, creating what is still considered the worst traffic jam in Nashville's history (Alligood 2001). Traffic jams up to five miles long clogged the main arteries leading downtown. The ice and snow did not completely melt until 12 February.
II. Meteorological Data
a. Chronology of Surface Observations
A strong cold front moved through Nashville shortly after 1900 UTC on 28 January. It had been raining that day. Before the cold frontal passage, the temperature had reached 59°F. (Figure 1 gives an hour-by-hour graph of temperature and precipitation throughout the five-day event, or click here for a list of all BNA surface observations) But temperatures fell during the afternoon and evening, dropping below freezing just before midnight. A mixture of freezing rain, sleet, and snow continued into the next day, Monday, with 1.6 inches of snow and ice accumulating by midnight. Very little precipitation fell the next day, but on 31 January, five inches of snow and freezing rain fell, producing a water equivalent of 3.83 inches. This remains the greatest one-day precipitation event for January in Nashville's history. Much of the ice accumulated during the evening.
The precipitation continued on 1 February, most of it as snow, with an additional 5.2 inches accumulating. It finally ended around noon. By then, Nashville lay buried under 8 inches of ice and snow. (Table 1 lists Nashville's top ten snowstorms, for comparison.) Thus, for the five-day period of 28 January through 1 February, the water equivalent precipitation totaled 5.94 inches, including a remarkable 11.9 inches of ice and snow.
Meanwhile, sub-zero temperatures added to the misery. The temperature dropped to -13°F on the morning of 2 February, tying the all-time record low for Nashville. The temperature dropped to -10°F the following morning. [2]
Local observations and climatological summaries for Nashville show the fastest sustained wind speed during the period of 28 January through 1 February was 23 miles per hour (on 28 January). Therefore, what is historically known as the "Great Blizzard" actually fails qualify as a blizzard when official criteria are applied. Average wind speeds for the five-day period were 13.1, 11.0, 9.6, 6.3, and 12.3 miles per hour, respectively.
=======================================
Table 1. Nashville's Top Ten Snowstorms
=======================================
Rank  Inches  Date
---------------------------------------
  1    17.0   17 Mar 1892
  2    15.0   20 Feb 1929 - 21 Feb 1929
  3    10.2   31 Dec 1963 -  1 Jan 1964
  4     9.8    3 Feb 1886
  5     9.7   25 Feb 1894
  6     8.8   11 Feb 1910
  7     8.7   19 Mar 1996
  8     8.5   29 Jan 1905
  9     8.2   20 Mar 1968
 10     8.1    7 Jan 1988
=======================================
b. 500 millibar synopsis
The Northern Hemispheric 500 millibar analysis valid at 1500 UTC on 28 January (National Climatic Data Center, NCDC) showed the southeast United States under a southwesterly flow (Figure 2a). High pressure aloft was centered south of Cuba, with an upper-level low situated just south of Hudson Bay, and a shortwave trough trailing southwestward. The synoptic pattern looked much the same 24 hours later with the aforementioned features having shifted just slightly eastward (Figure 2b).
The 500 millibar analysis at 1500 UTC on 30 January showed high pressure having shifted somewhat eastward (Figure 2c). The low center was now located over Newfoundland. However, the longwave trough across the intermountain west was amplifying significantly, particularly as the northern and southern streams phased over southern California. The analysis 24 hours later showed further amplification of the longwave trough, with the flow over middle Tennessee having become more southerly ahead of a trough now stretched southward from the Rocky Mountains into Mexico (Figure 2d).
At 1500 UTC on 1 February, the longwave trough was situated over the Mississippi Valley, with the flow now almost due southerly, and deep cold air advection behind the longwave trough (Figure 2e).
c. Surface synopsis
The surface analysis at 1230 UTC on the morning of 28 January (NCDC) showed a quasi-stationary front draped across western Tennessee, just west of Nashville, with the city enjoying a pleasant southwesterly flow on the backside of a Bermuda high (Figure 3a). Nashville had temperature readings in the upper 50's during the morning, although temperatures would plummet to freezing by evening, following the frontal passage. At 1230 UTC the following morning, the front had moved slowly into the southern Appalachians. Middle Tennessee was now under a much different air mass due to an intense 1050 millibar high, with one center over British Columbia, and another center on the Montana-Idaho border (Figure 3b).
The surface map valid at 1230 UTC on 30 January -- a day when very little weather was observed in Nashville -- showed the aforementioned frontal boundary now well south and east of middle Tennessee, with a 1040 millibar high centered over Wisconsin (Figure 3c). Twenty-four hours later, on 31 January -- by far the most active weather day during the Great Blizzard -- an inverted trough of low pressure had formed just east of Nashville, with strong southerly warm air advection over the trough and into the colder air west of the boundary. This set up a pronounced inversion (documented in the following section) which provided the conditions under which 3.83 inches of water equivalent precipitation fell into a shallow sub-freezing boundary layer covering much of middle Tennessee (Figure 3d).
By the morning of 1 February, a surface low had developed near Atlanta along the quasi-stationary frontal boundary, with middle Tennessee now under a brisk northerly wind. Strong low-level cold air advection and drying across middle Tennessee was occurring at 1230 UTC, bringing a rapid end to measurable precipitation across the region. Meanwhile, a 1040 millibar high settling over Colorado introduced a frigid polar air mass to middle Tennessee (Figure 3e).
d. Soundings
Fortunately, ample sounding data are available from Nashville throughout the event (Table 2). Beginning with the 0300 UTC sounding on 29 January (figure 4a), when the surface temperature was still above freezing and rain was falling, a strong frontal inversion was present in the 950-900 mb layer. Raw data show the temperature at 950 mb was -1.7°C, but was 9.6°C just 50 mb higher (a difference of 11.3°C). By 1600 UTC, though, the lower atmosphere had cooled sufficiently to allow a mixture of rain, sleet, and snow (figure 4b). Note the 1000-850 mb thickness had fallen to 1284 meters -- below the 1300-meter threshold commonly used to differentiate between rain- and snow-producing environments (Gordon 1997). The frontal inversion remained a strong 10.1°C.
At 0400 UTC on 30 January (figure 4c) the surface temperature was -7.9°C, with the 1000-850 mb thickness having decreased to 1262 meters. Still, the 850-700 mb thickness remained 1564 meters -- above the 1540 meter snow threshold used for that layer. The frontal inversion remained confined to the 950-850 mb layer, but had increased to 13.5°C. By 1500 UTC, though, significant drying had occurred above 800 mb, which helps explain why just 0.06 inches of water equivalent precipitation was measured (figure 4d). Still, the aforementioned low-level features remained intact, with generally cold low-levels, warmer mid-levels, and an inversion strength now of 15.7°C. (Remarkably, the temperature at 650 mb was greater than that at the surface.)
The sounding taken at 0300 UTC on 31 January (figure 4e), indicated that significant moisture advection had occurred in the mid-levels, with the precipitable water having increased from 0.49 to 0.70 inches since the previous sounding. Also, some warming had occurred at all levels, with the 1000-850 mb thickness having increased 30 meters in 12 hours, and the 1000-500 mb thickness having increased 43 meters. And the omnipresent 950-850 mb inversion maintained a strength of 12.7°C. At 1500 UTC, with the worst of the freezing rain now in progress, the atmosphere had undergone significant moisture advection, with a nearly saturated surface-to-350 mb column, and a remarkable precipitable water value of 0.99 inches (figure 4f). The environment also exhibited additional warming, with the 1000-850 mb thickness now 1303 meters, and a 1000-500 mb thickness of 5491 meters. Although the frontal inversion had diminished to 8.9°C, sufficient warming had taken place to allow the precipitation to fall to the surface as liquid, only to freeze upon contact with the surface, where the temperature had been at or below freezing since 2300 UTC on 28 January. (Although the 0300 UTC sounding from 29 January used a surface temperature of 35°F, the hourly temperature observation listed in the local climatological data for Nashville at that time was 31°F.)
As the heaviest precipitation was concluding, the lowest surface pressure of the event, 992 mb, was measured at the time of the 0300 UTC sounding on 1 February (figure 4g). Due to early termination of the sounding, no observed data were available above 750 mb, although cold advection was underway as evidenced by a decrease in the 1000-850 mb thickness to 1291 meters. [3] Deep cold advection was underway by 1600 UTC, where significant drying had occurred above 700 mb, and the inversion had largely eroded (figure 4h). By then, the precipitation had ended.
| Table 2. Sounding parameters during the Ice Storm of 1951 | ||||||||
|---|---|---|---|---|---|---|---|---|
| Parameter | 01/29/51 0300 UTC |
01/29/51 1600 UTC |
01/30/51 0400 UTC |
01/30/51 1500 UTC |
01/31/51 0300 UTC |
01/31/51 1500 UTC |
02/01/51 0300 UTC |
02/01/51 1600 UTC |
| 1000-850 mb thickness |
|
|
|
|
|
|
|
|
| 1000-500 mb thickness |
|
|
|
|
|
|
|
|
| 850-700 mb thickness |
|
|
|
|
|
|
|
|
| Surface pressure |
|
|
|
|
|
|
|
|
| 850 mb height |
|
|
|
|
|
|
|
|
| 700 mb height |
|
|
|
|
|
|
|
|
| 500 mb height |
|
|
|
|
|
|
|
|
| Surface temperature |
|
|
|
|
|
|
|
|
| Surface dew point |
|
|
|
|
|
|
|
|
| 850 mb temperature |
|
|
|
|
|
|
|
|
| 850 mb dew point |
|
|
|
|
|
|
|
|
| Precipitable water |
|
|
|
|
|
|
|
|
III. Recollections of the Ice Storm
It is difficult for residents of the south to comprehend an ice storm of this magnitude, especially those who did not live during the Great Blizzard. The value of personal accounts and photographs of the aftermath of the storm cannot be overstated in appreciating the effects of such an event. Although weather observations and measurements speak for themselves in terms of the rarity of such winter storms, remembrances of those who endured the Ice Storm of 1951 add a historical dimension that simply cannot be captured by the meteorological data.
One woman, who was in her mid-20's at the time of the Great Blizzard, captures the awesome reality of the storm through her written account (below) and photographs (Figures 5a-5e).
Then, boom, all of a sudden on Wednesday night, January 31, 1951, one ice blizzard put our magic fairyland of electricity out of business for over a week. It seemed like the lights were going out all over the world. Back we go to the woodburning cookstove and back to using the kerosene lamps. On the last afternoon of January there was a sudden onslaught of cold, sleet, snow, and ice that struck the entire area. This is no casual drizzle, no temperate storm nor even a settled downpour. This ice is a deluge the proportions of which one would not think the sky capable. I was on my way home from work and witnessed the whole thing. It started with an ice storm, a rain of sleet that broke tree and limbs and electric wires. Following the sleet and ice came about eight inches of snow, the weight of which brought down tree after tree and power line after power line leaving a complete blackout (Midgett).
A Nashvillian and former AT&T employee remembered the event similarly.
That first night you would have thought that fireworks were going off the way the electric lines were popping. You wouldn't believe the damage it did to the trees, especially the hackberry trees. Nearly every one of them had snapped. I set out to go to work on the ice, but 21st Avenue looked like ocean waves the way the snow and ice had fallen and driven by the wind. I just backed it up and called it a day. Nothing you could do (Alligood 2001).
Of course, newspaper coverage of the event was widespread, and the Nashville Tennessean ran several noteworthy photographs of Nashville besieged by the ice and snow (Figures 5f-5k) (Historic Nashville).
IV. Conclusions
Middle Tennessee is not accustomed to severe wintry weather such as occurred in 1951. In fact, normal annual snowfall for Nashville is just 9.1 inches (NCDC). Certainly, ice storms have occurred both before and since the Great Blizzard, but none has ever had the impact of this rare event. Unfortunately, meteorological data from that era are not as plentiful as today, and, of course, satellite and radar imagery are not available for that time.
It is also enlightening to read how Nashvillians dealt with the ice, and then the extreme cold. One would think that because of the increased population of the Nashville area today (more automobiles, power and telephone lines, roads, and infrastructure), as well as our far greater reliance on modern conveniences than our fellow citizens from two generations ago, such an event today would produce far graver consequences.
It is also not known how well (or how badly) the Weather Bureau forecast this event. Even today, winter weather forecasting remains perhaps the most challenging for forecasters in this part of the nation. Although today we can refer to a variety of model forecasts and research techniques to aid in the forecast process, pattern recognition of past events should not be neglected.
Although the synoptic and mesoscale situations which produced the Ice Storm of 1951 may never be duplicated, forecasters should be curious enough to occasionally look back to the "big events" and learn what ingredients made these storms so extraordinary. The soundings presented in this paper represent the classic freezing rain profile.
This is why the truly phenomenal meteorological events, such as the Super Outbreak of 1974 and the Storm of the Century in 1993 should always be catalogued for ready reference. Rare as these events are, recognition of such ominous patterns can provide some assistance in forecasting significant meteorological developments.
__________
1 - Although specific information on flooding could not be located, local climatological data for Nashville show the Cumberland River crested at 37.0 feet, just 3.0 feet below flood stage, at 0100 UTC on 3 February.
2 - This record would be broken 12 years later, but remains Nashville's all-time record low for February.
3 - Please note that 700 mb temperature and dew point for this sounding were interpolated using 700 mb data from both the previous and succeeding soundings. This was done in order to create a display for this sounding. Without 700 mb readings, the software could not display the radiosonde data.
Acknowledgements
The author offers his thanks to Mauna Faye Crabtree, daughter of Willie Mine Midgett, for providing information on Devil's Elbow, and for granting permission to use the photographs shown in Figures 5a-5e. Special thanks go to Historic Nashville, who supplied the electronic images shown in Figures 5f-5k. The author is also grateful to Henry Steigerwaldt, Science-and-Operations Officer, and Michael Murphy, Service Hydrologist, both of the National Weather Service Office in Old Hickory, for their reviews and suggestions for improving this manuscript. Finally, thanks go to Peter C. Banacos, Storm Prediction Center, for his thorough peer review and numerous suggestions, and Jeffrey Craven, who served as the manuscript's editor.
REFERENCES
Alligood, Leon. Nashville's Worst Blizzard Crippled City 50 Years Ago. The Tennessean. 31 January 2001.
Crowe, Shawn and Stuart A. Foster. Fact Sheet: The Great Ice Storm of '51. The Kentucky Climate Center. https://kyclim.wku.edu/factsheets/ice_storm_51.
Gordon, J., 1997: A comprehensive winter weather forecast checklist. CR Applied Research Paper 18-08.
Historic Nashville. Snowstorm 1951. https://www.nashvillewebreview.com/automat/nashville/events/snowstorm1951/snowstorm1951_1.html.
Midgett, Willie Mine. The Blizzard of '51. Joelton.com. https://www.joelton.com/history/blizzard.htm.
National Climatic Data Center. Normals, Means, and Extremes for Nashville, Tennessee (1971-2000).
National Climatic Data Center. Synoptic Weather Maps. 28 January 1951 - 1 February 1951.
Figure 1. Graph showing hourly surface temperature and hourly precipitation (water equivalent) during the 120-hour period from 1200 UTC on 28 January 1951 to 1200 UTC on 2 February 1951.
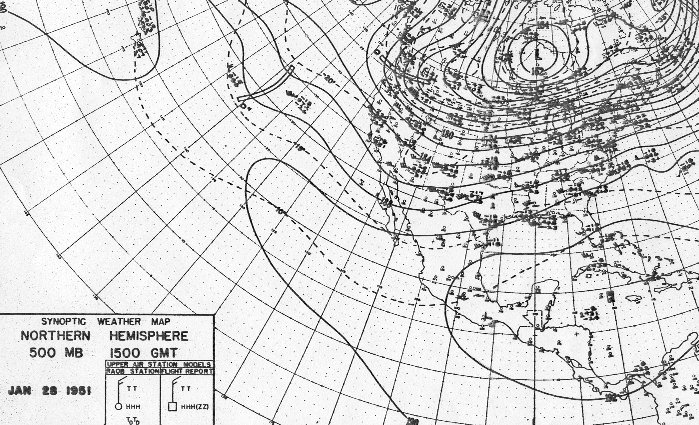
Figure 2a. 500 millibar analysis valid at 1500 UTC on 28 January 1951 (Source: NCDC).
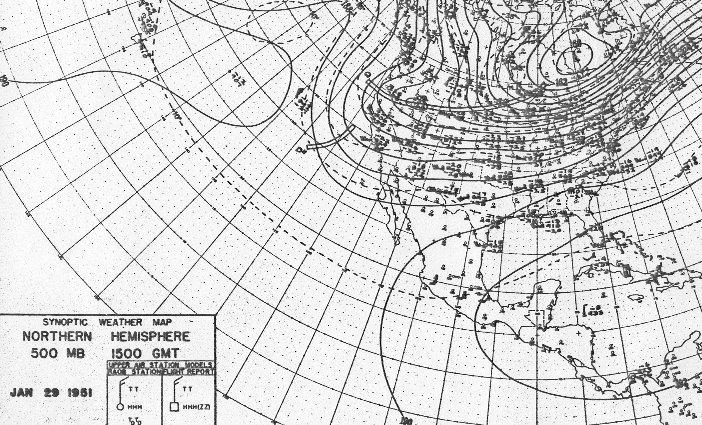
Figure 2b. 500 millibar analysis valid at 1500 UTC on 29 January 1951 (Source: NCDC).
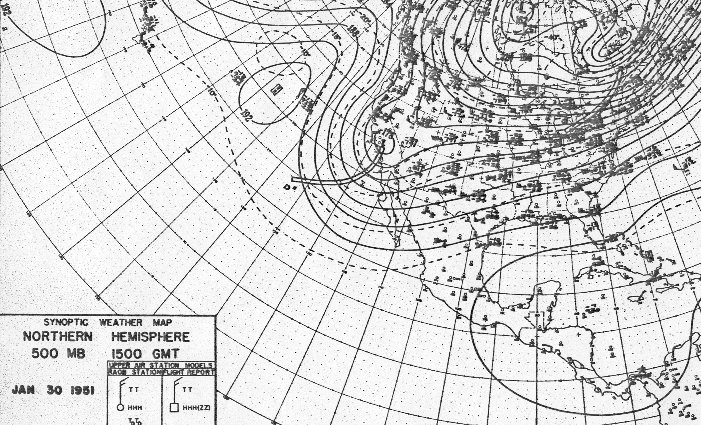
Figure 2c. 500 millibar analysis valid at 1500 UTC on 30 January 1951 (Source: NCDC).
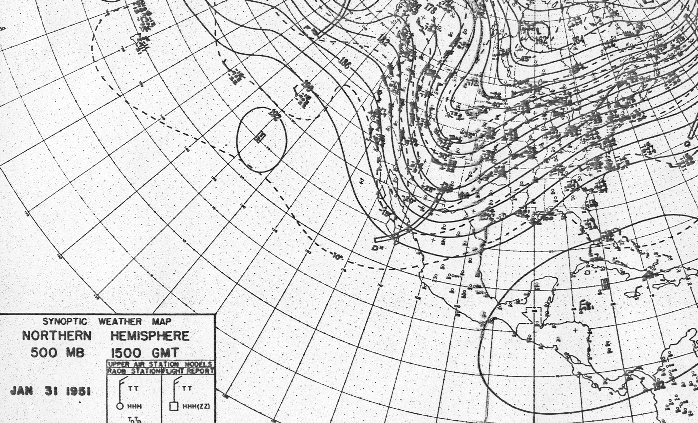
Figure 2d. 500 millibar analysis valid at 1500 UTC on 31 January 1951 (Source: NCDC).
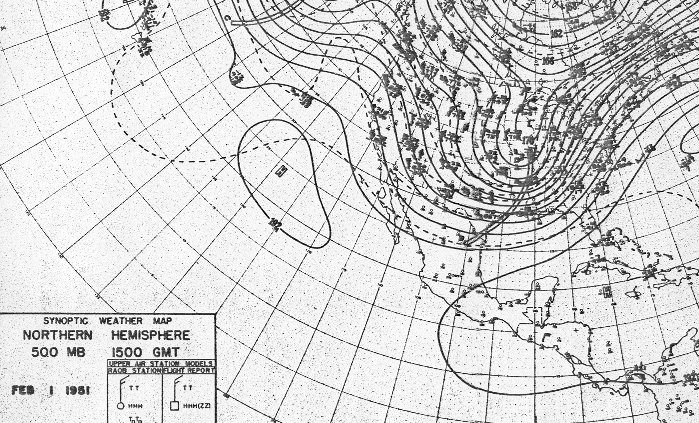
Figure 2e. 500 millibar analysis valid at 1500 UTC on 1 February 1951 (Source: NCDC).
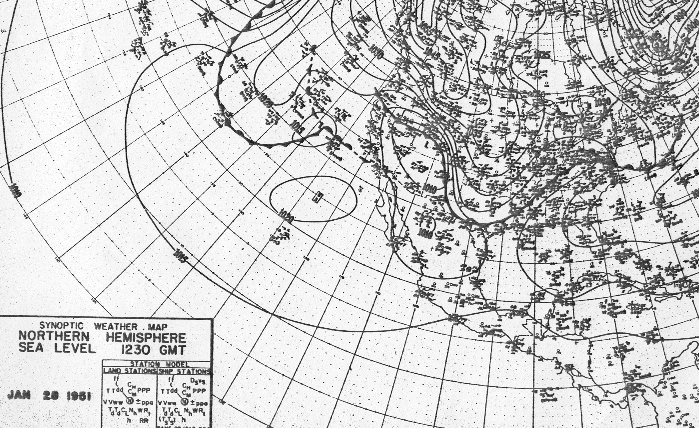
Figure 3a. Surface analysis valid at 1230 UTC on 28 January 1951 (Source: NCDC).
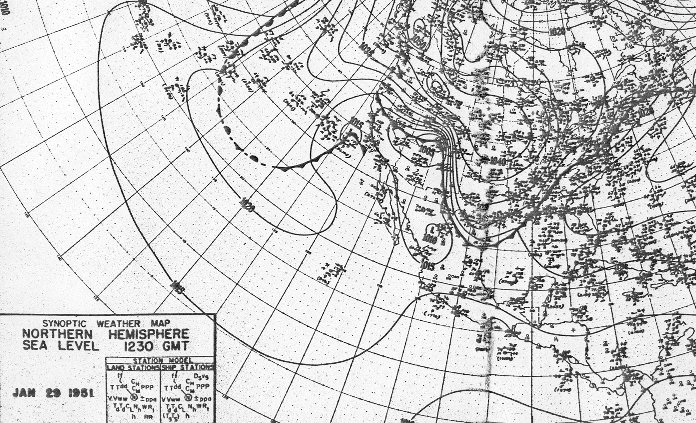
Figure 3b. Surface analysis valid at 1230 UTC on 29 January 1951 (Source: NCDC).
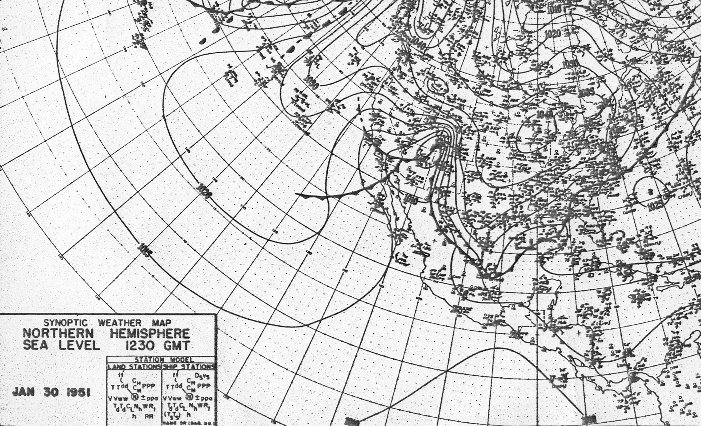
Figure 3c. Surface analysis valid at 1230 UTC on 30 January 1951 (Source: NCDC).
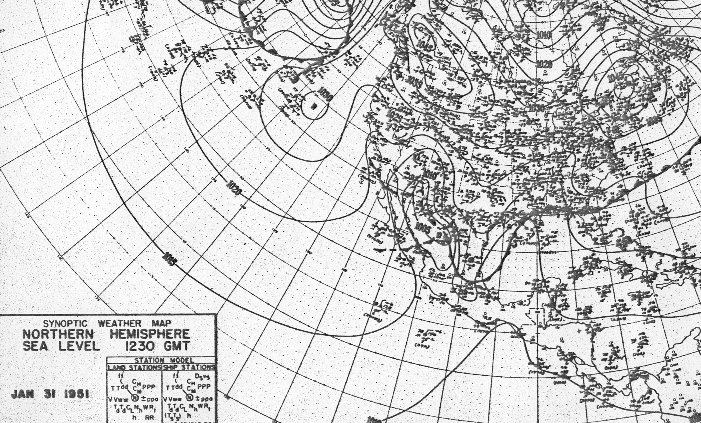
Figure 3d. Surface analysis valid at 1230 UTC on 31 January 1951 (Source: NCDC).
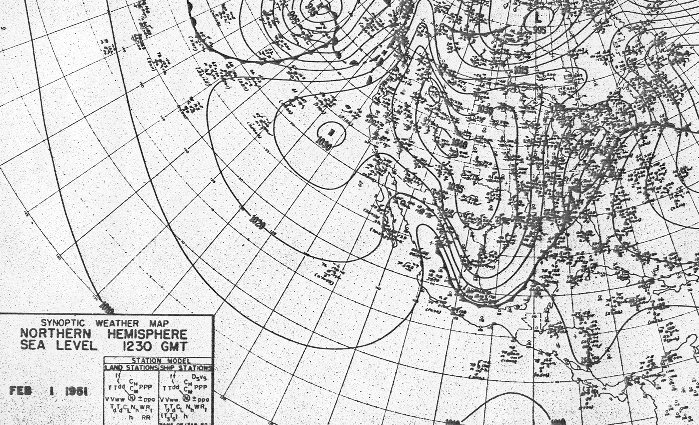
Figure 3e. Surface analysis valid at 1230 UTC on 1 February 1951 (Source: NCDC).
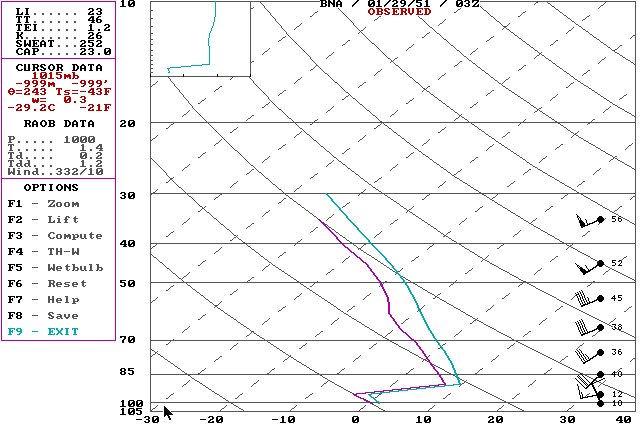
Figure 4a. Sounding from Nashville taken at 0300 UTC on 29 January 1951.
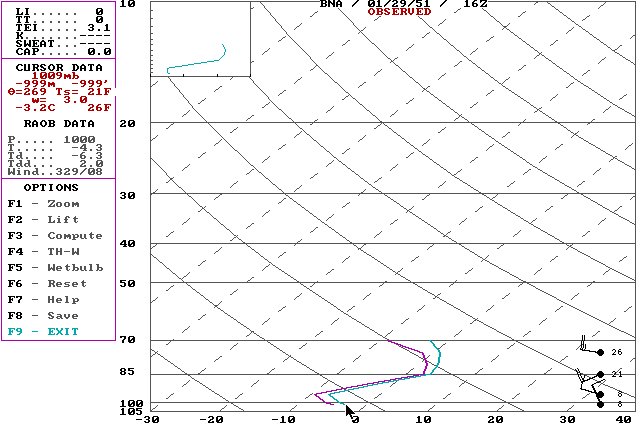
Figure 4b. Sounding from Nashville taken at 1600 UTC on 29 January 1951.
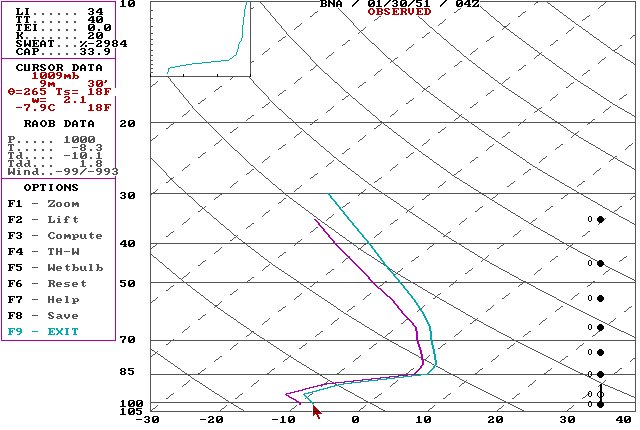
Figure 4c. Sounding from Nashville taken at 0400 UTC on 30 January 1951.
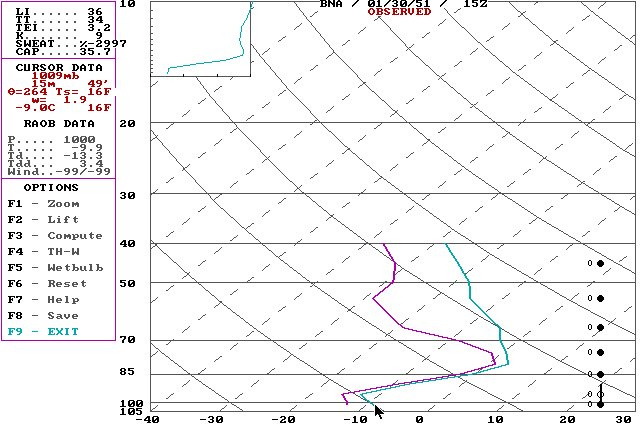
Figure 4d. Sounding from Nashville taken at 1500 UTC on 30 January 1951.
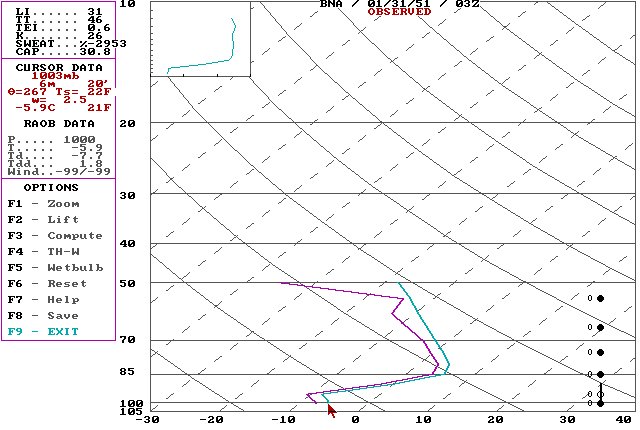
Figure 4e. Sounding from Nashville taken at 0300 UTC on 31 January 1951.
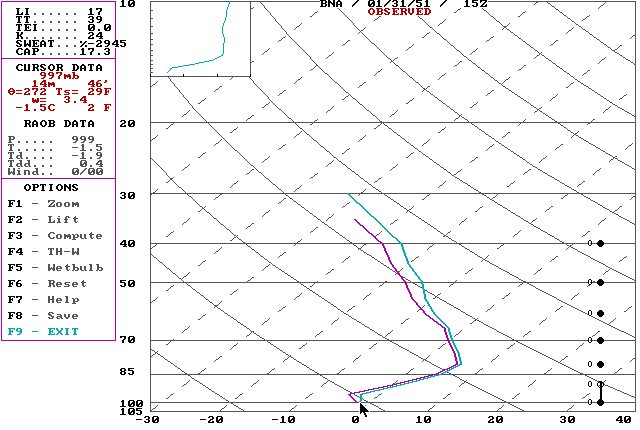
Figure 4f. Sounding from Nashville taken at 1500 UTC on 31 January 1951.
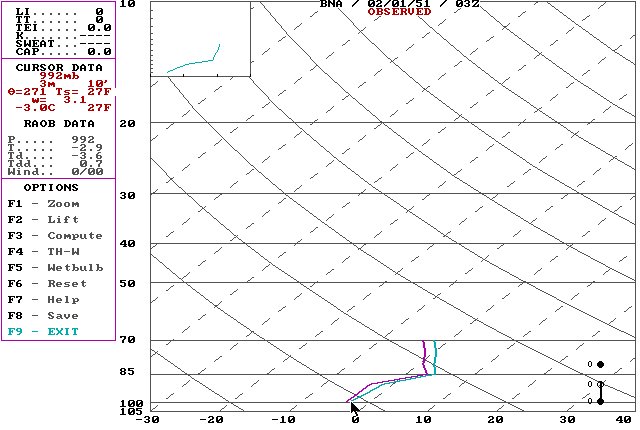
Figure 4g. Sounding from Nashville taken at 0300 UTC on 1 February 1951.
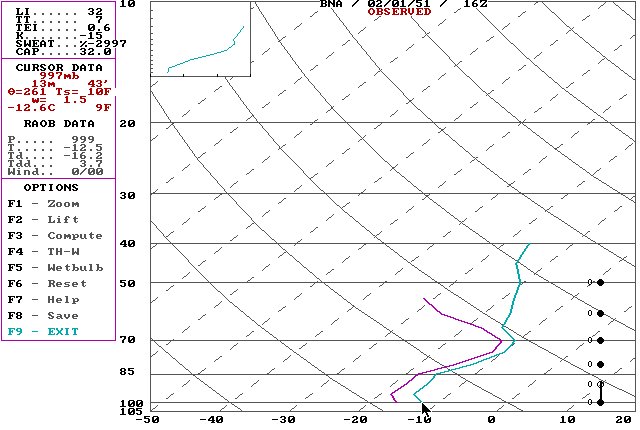
Figure 4h. Sounding from Nashville taken at 1600 UTC on 1 February 1951.
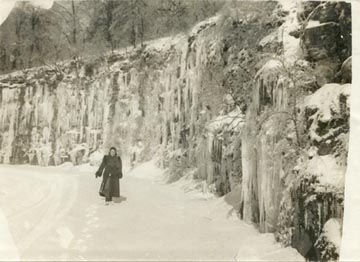
Figure 5a. This photograph was taken by W.C. Midgett at Devil's Elbow, a very winding stretch of highway that climbs from Whites Creek onto the ridge in the northwest corner of Davidson County. Historically, this area was called Paradise Ridge, but is now known as Joelton. The elbow is known as one of the most treacherous pieces of road to travel in Davidson County during icy winter weather, as it consists of a rock bluff on one side and a ravine on the other. The name no doubt comes from the wicked curve at the foot of the hill.
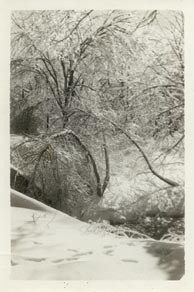
Figure 5b.
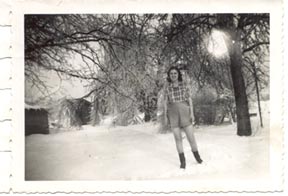
Figure 5c.
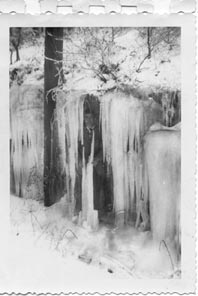
Figure 5d.
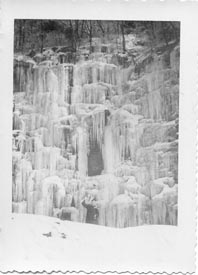
Figure 5e.
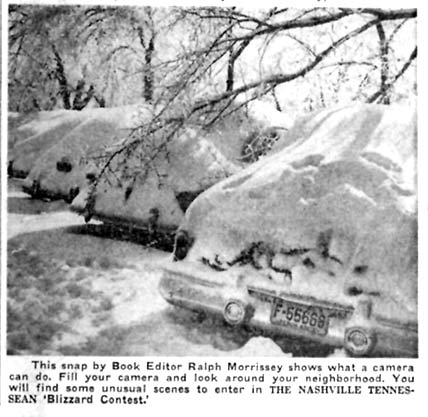
Figure 5f.
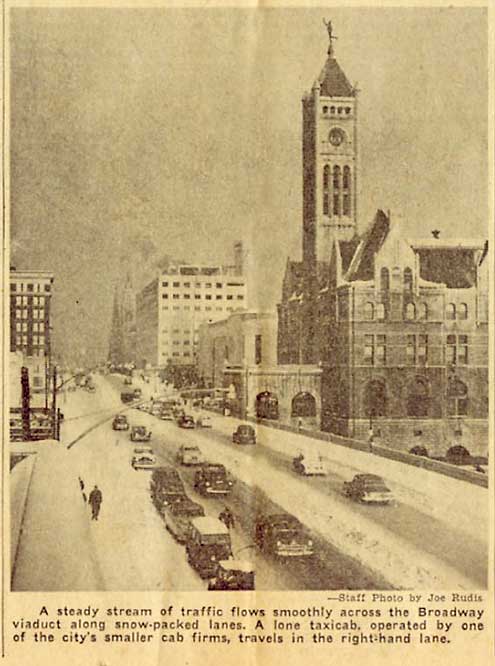
Figure 5g.
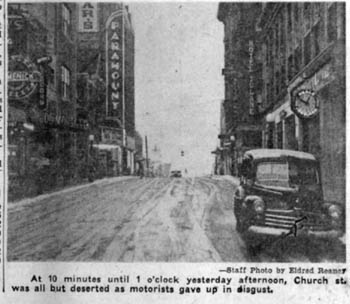
Figure 5h.
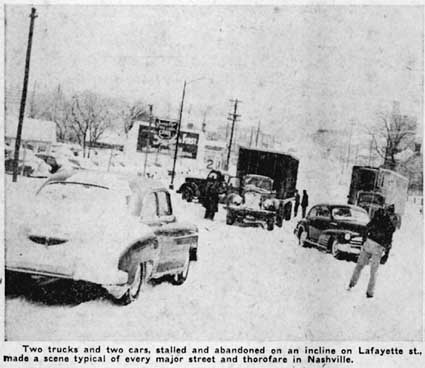
Figure 5i.
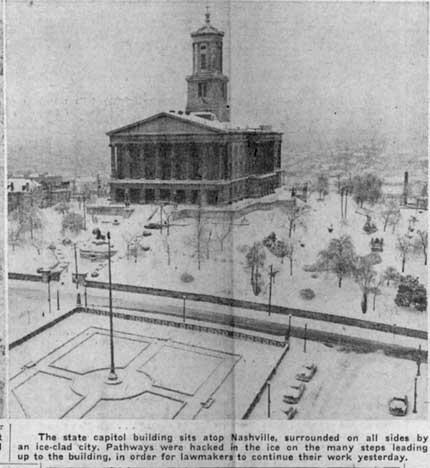
Figure 5j.
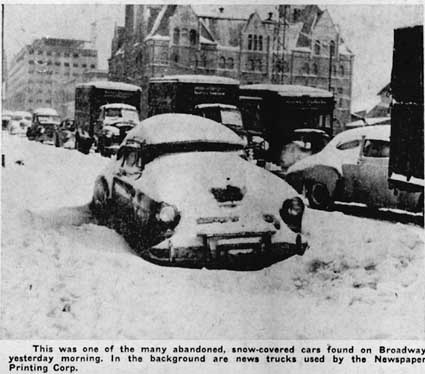
Figure 5k.