Upper Missouri Basin
May precipitation across the Upper Missouri Basin was above average. Basin for the Missouri Basin precipitation summaries include: Milk St. Mary, 51 percent; Milk Canada, 54 percent;
Lower Milk, 123 percent; above Toston, 67 percent; Toston to Ft. Peck, 112 percent.
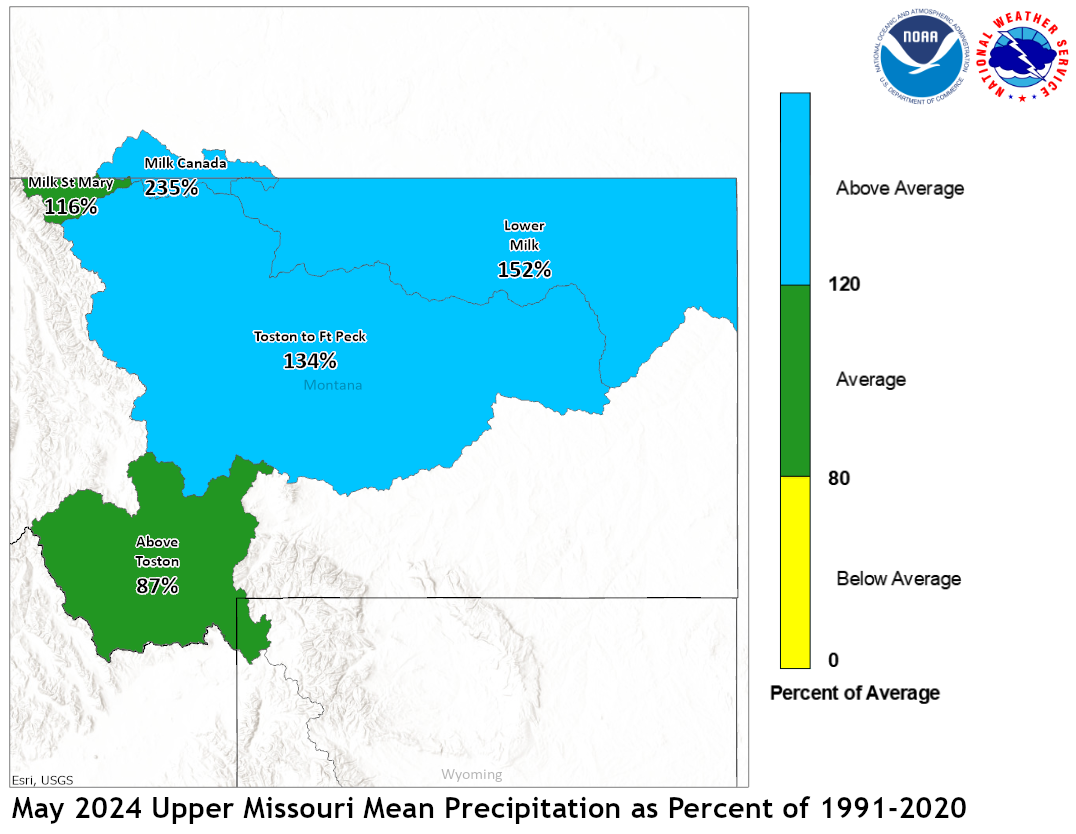
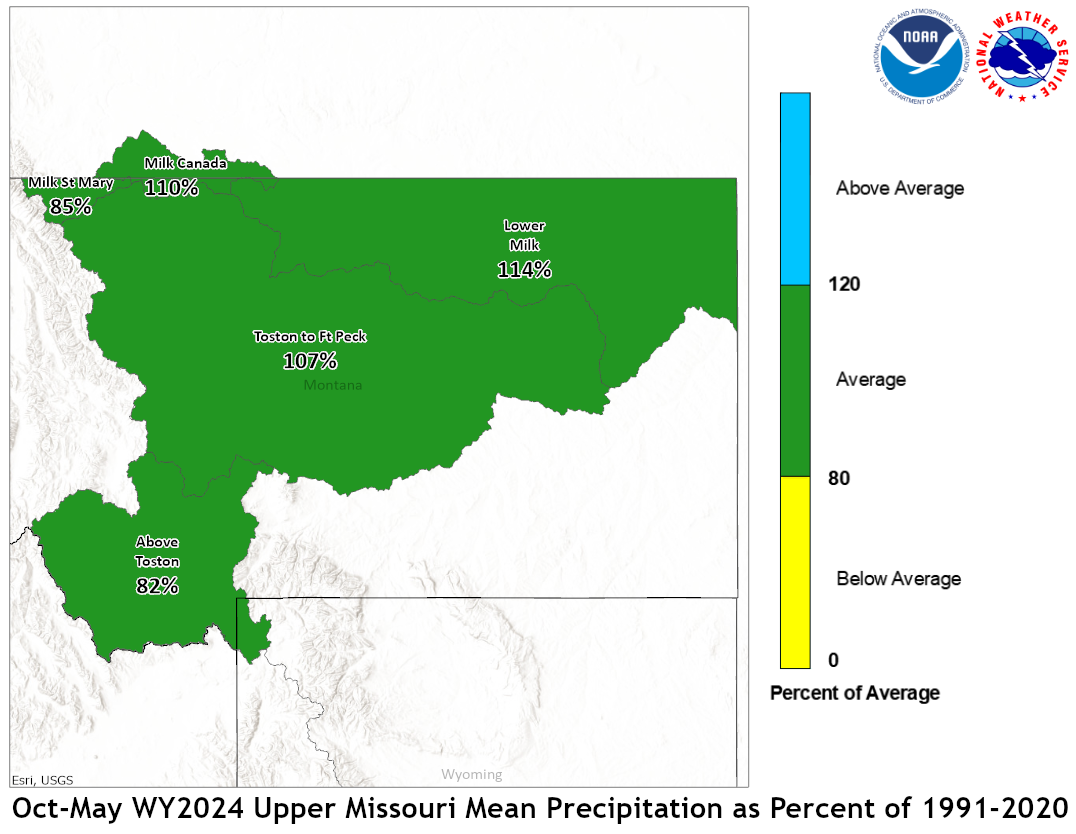
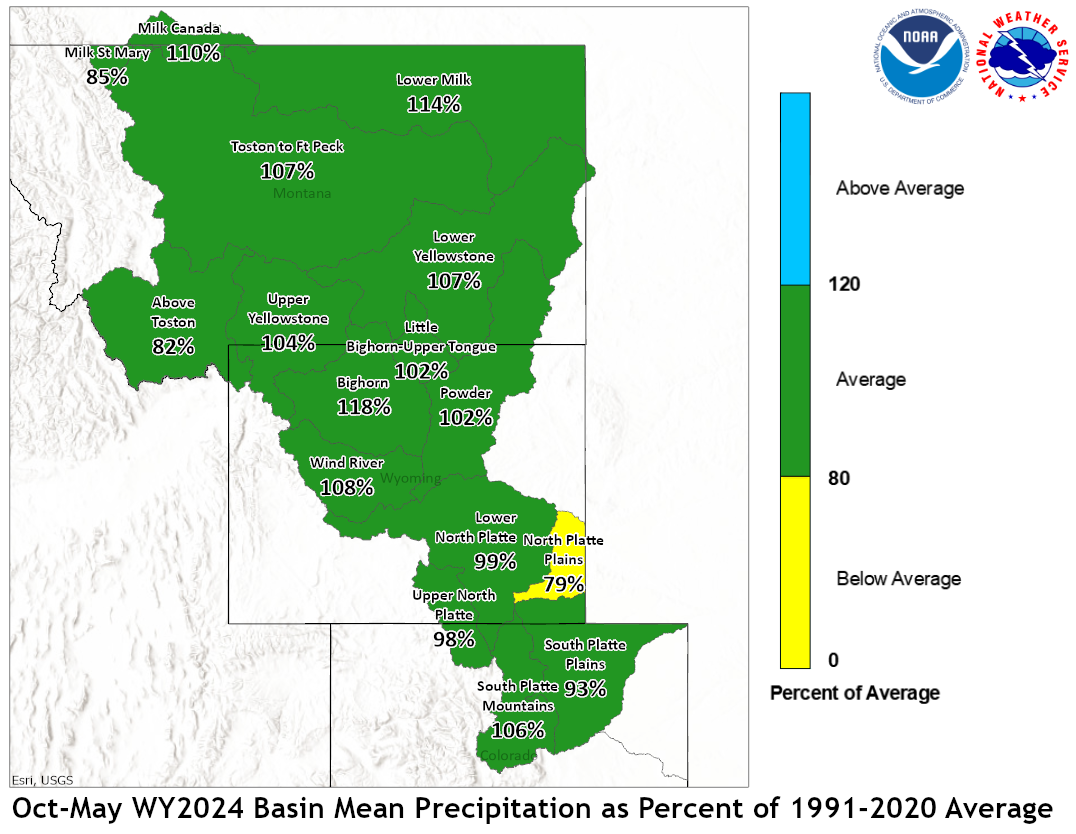
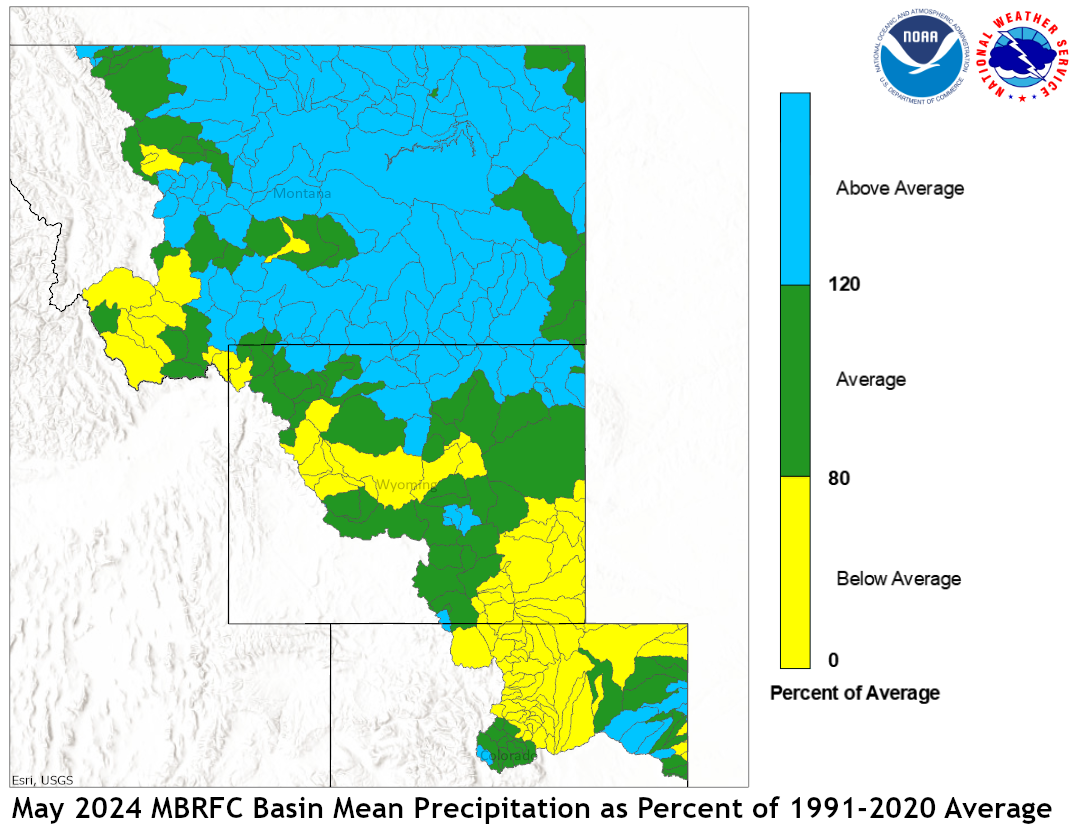
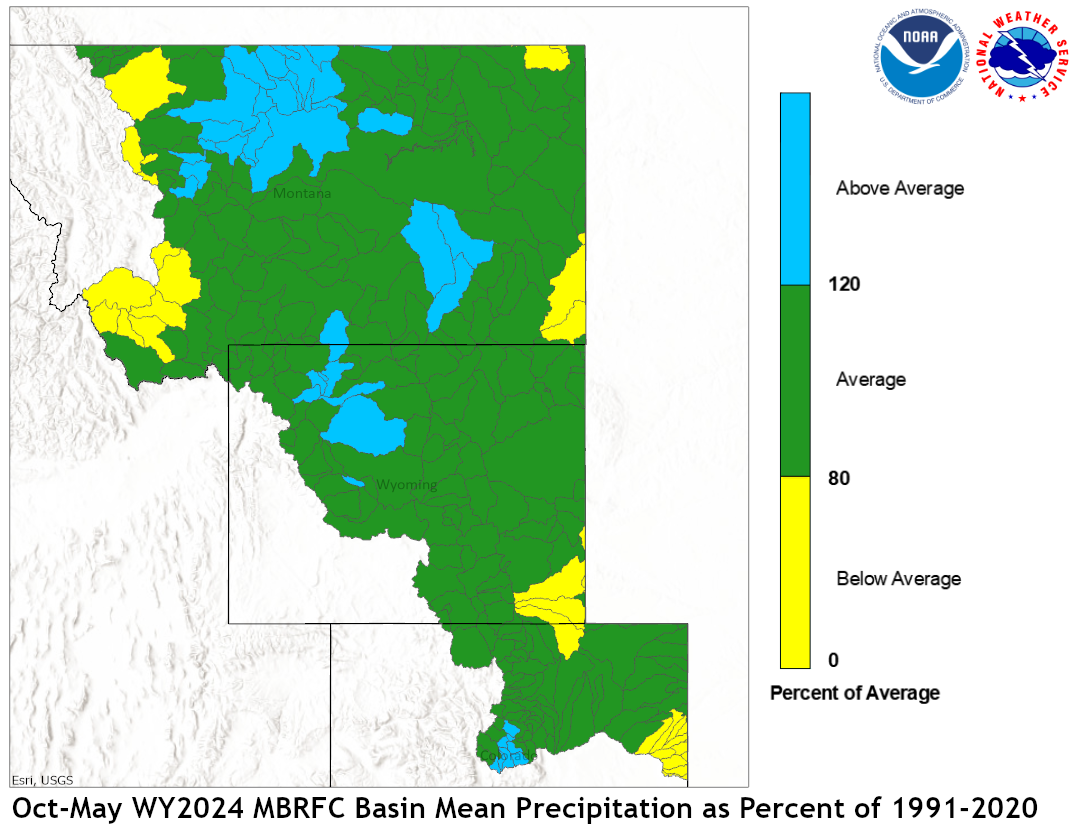
May 2024 Upper Missouri Mean Precip Oct-May WY2024 Upper Missouri Mean Precip
Of the four major irrigation reservoirs in Montana; Lima
Reservoir had 117 percent average storage, Clark Canyon was
holding 125 percent of average water, Gibson Reservoir had 95
percent of average stored water, and Fresno Reservoir had
107 percent of average stored water.
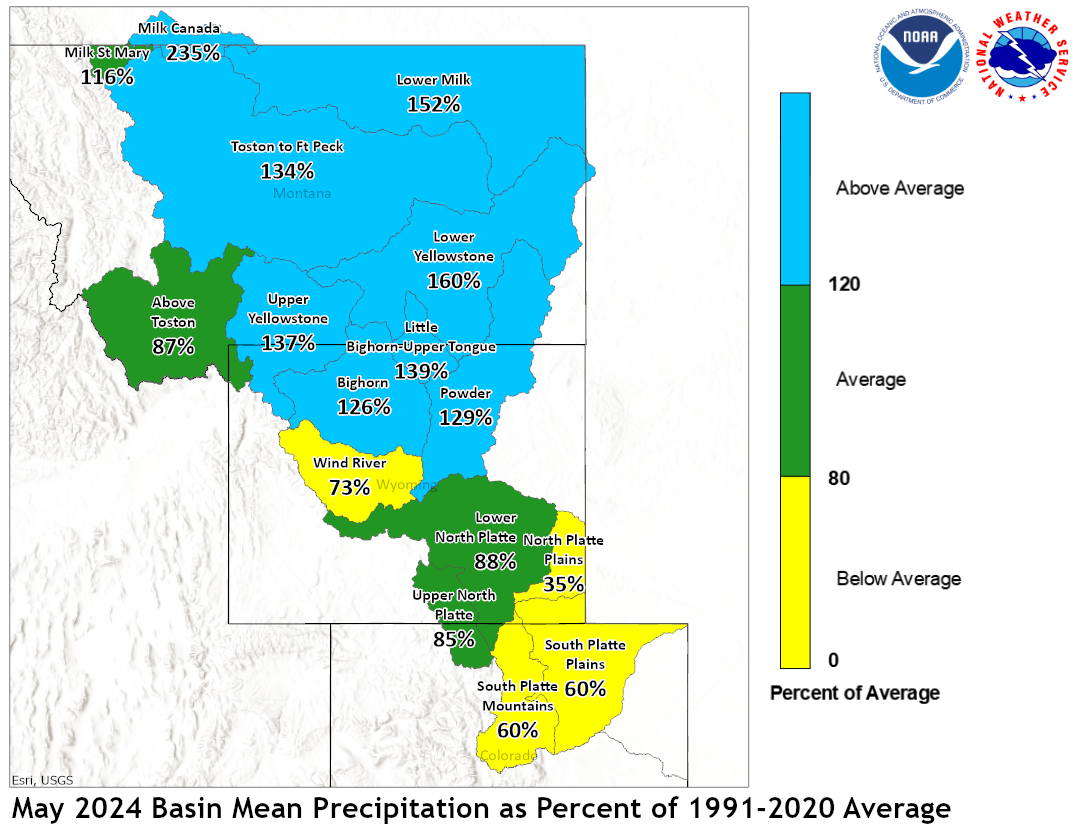
Yellowstone Basin
Precipitation during May was above average. The upper Yellowstone
River Basin received 137 percent of average precipitation while the Lower
Yellowstone River Basin reported 160 percent of average. The Bighorn
Basin received 126 percent of average precipitation while the
Wind River Basin received 73 percent of average. The Little Bighorn -
Upper Tongue Basin received 139 percent of average and the Powder River
had 129 percent of average precipitation.
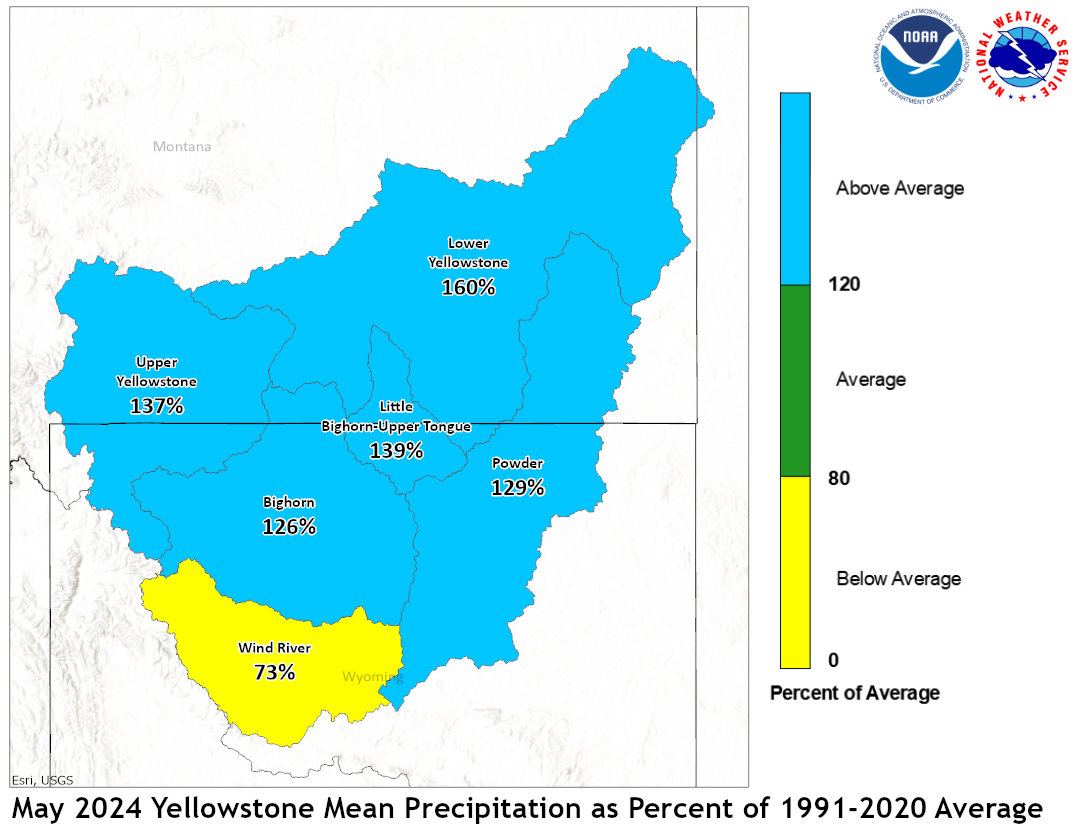
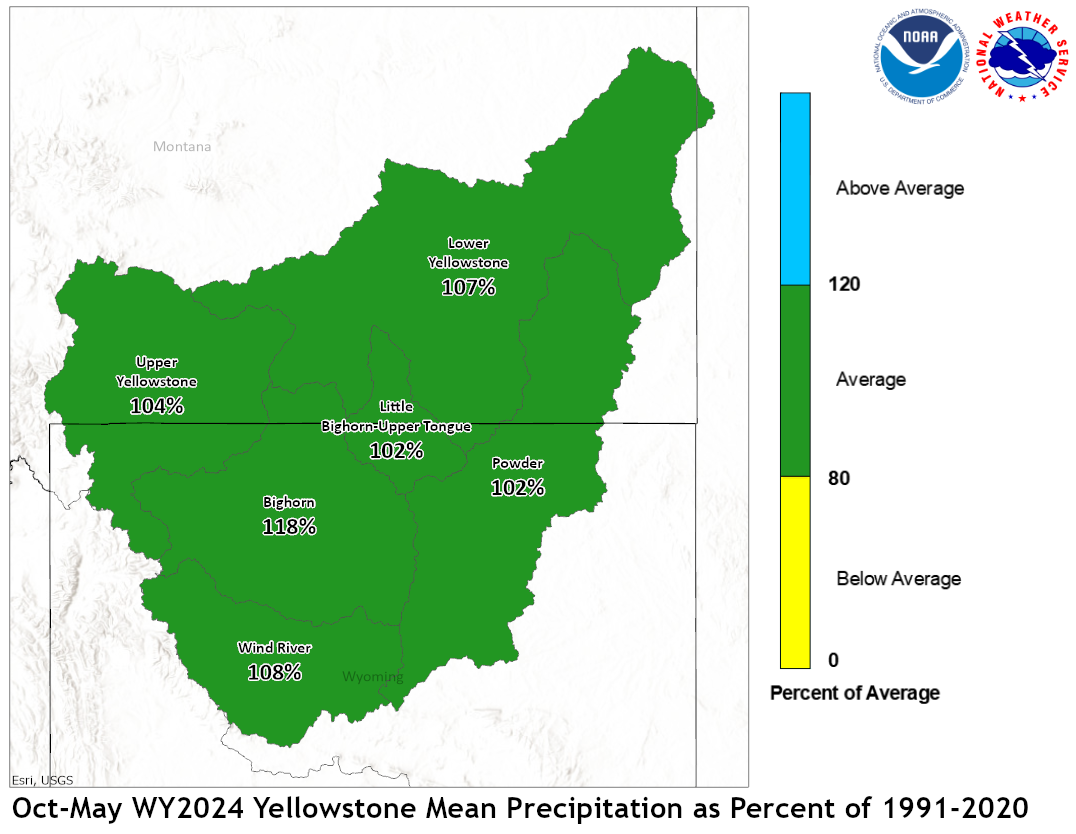
May 2024 Yellowstone Mean Precip Oct-May WY2024 Yellowstone Mean Precip
Month end storage at Boysen Reservoir was 96 percent of average.
Stored water in Buffalo Bill Reservoir was 107 percent of average.
Month end storage was 96 percent of average at Bighorn Reservoir.
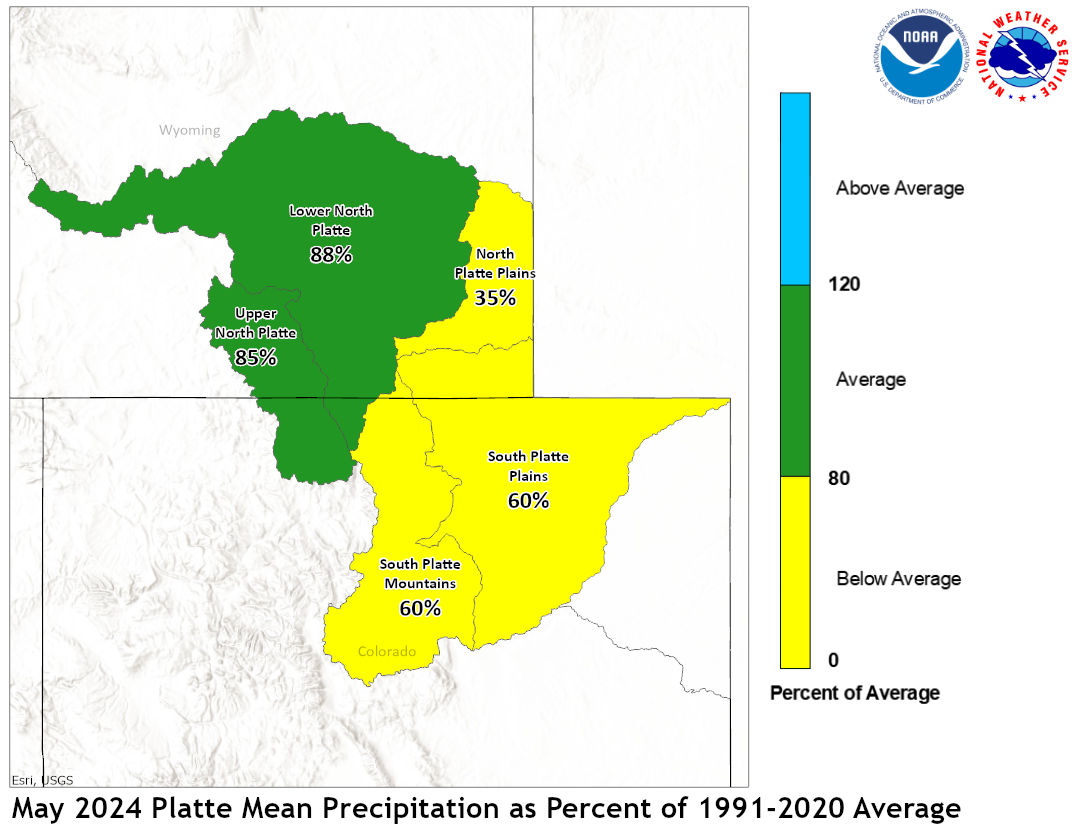
Platte Basin
Precipitation during May in the Upper North Platte Basin was 85
percent of average. In the Lower North Platte Basin, precipitation
was 87 percent of average. The North Platte Plains below Guernsy
Reservoir had 88 percent. The South Platte Mountains had 60
percent whereas the Plains had 60 percent of average May
precipitation.
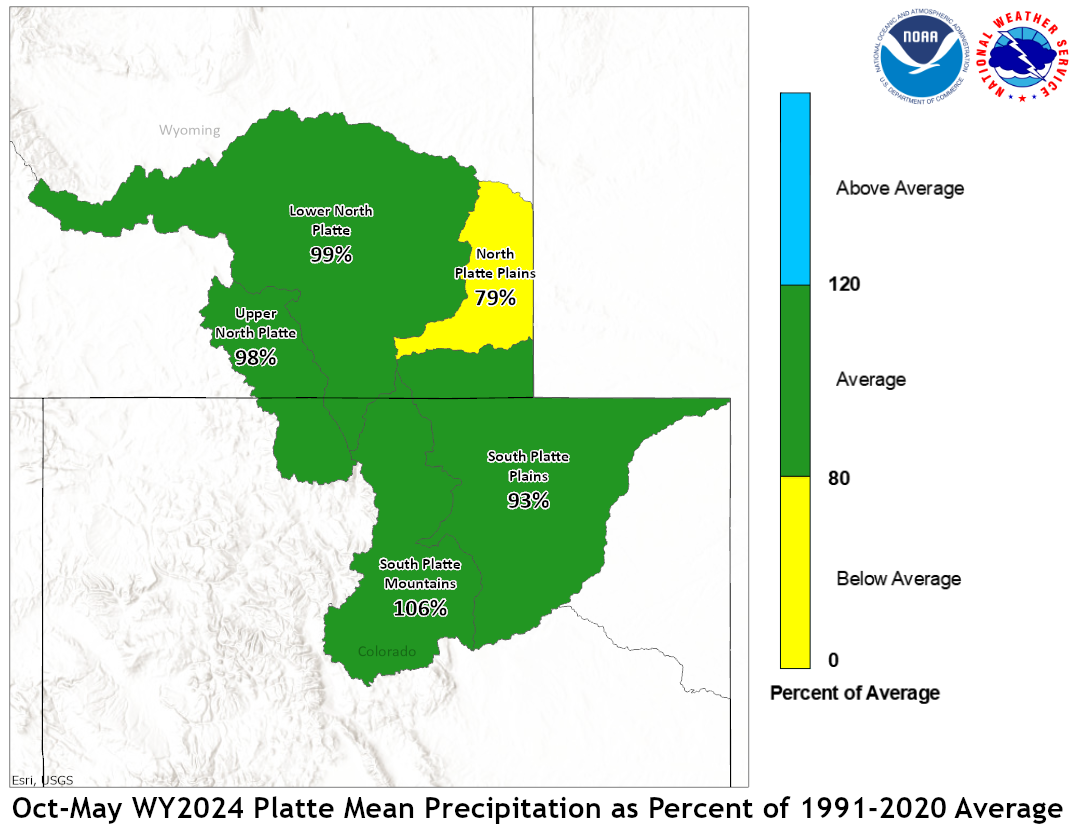
May 2024 Platte Mean Precip Oct-May WY2024 Platte Mean Precip
Stored water in the South Platte Basin was 108 percent of average
on June 1.
FGUS63 KKRF 051927
ESPKRF
WATER SUPPLY FORECAST
NWS MISSOURI BASIN RIVER FORECAST CENTER
PLEASANT HILL MISSOURI

1408 CDT WEDNESDAY JUNE 05, 2024

DATA CURRENT AS OF: JUNE 01, 2024

MISSOURI/YELLOWSTONE/PLATTE RIVER BASIN FORECASTS


                                          50%   %   10%   90%   AVG
FORECAST POINT                   PERIOD  (KAF) AVG (KAF) (KAF) (KAF)
--------------------------------------------------------------------

Boysen Resvr Inflow              Apr-Sep  432   60   570  387    720
SBDW4

Boysen Resvr Inflow              Apr-Sep  763   86   927  701    890
SBDW4N

Bighorn R at Kane                Apr-Sep  990  101  1202  923    985
LVEW4

Bighorn R at Kane                Apr-Sep 1719  119  1980 1617   1440
LVEW4N

Greybull R at Meeteetse          Apr-Sep  239  122   276  210    196
MEEW4

Greybull R at Meeteetse          Apr-Sep  239  117   276  210    205
MEEW4N

Buffalo Bill Resvr Inflow        Apr-Sep  596   73   683  538    815
CDYW4

Buffalo Bill Resvr Inflow        Apr-Sep  691   76   777  638    910
CDYW4N

Keyhole Resvr Inflow             Apr-Sep    5  125     8    4      4
KEYW4

St. Mary R nr Babb               Apr-Sep  349   76   390  324    460
SMYM8

St. Mary R nr Babb               Apr-Sep  334   62   374  306    535
SMYM8N

St. Mary R at Intl Boundary      Apr-Sep  258   66   320  224    390
SMBM8

St. Mary R at Intl Boundary      Apr-Sep  331   50   389  299    660
SMBM8N

Milk R nr Western Crossing       Apr-Sep   19   17    33   18    113
PDBM8

Milk R nr Western Crossing       Apr-Sep   23   56    44   19     41
PDBM8N

Milk R nr Eastern Crossing       Apr-Sep  175   81   215  168    215
ERNM8

Milk R nr Eastern Crossing       Apr-Sep   67   60   137   55    112
ERNM8N

North Platte R nr Northgate      Apr-Sep  258  105   306  236    245
NGTC2

North Platte R nr Northgate      Apr-Sep  310  105   358  287    295
NGTC2N

Encampment R nr Encampment       Apr-Sep  175  112   187  168    156
ECRW4

Encampment R nr Encampment       Apr-Sep  189  114   201  182    166
ECRW4N

Rock Cr nr Arlington             Apr-Sep   59  111    64   58     53
KCRW4

Rock Cr nr Arlington             Apr-Sep   59  111    64   58     53
KCRW4N

Seminoe Resvr Inflow             Apr-Sep  773  101   900  725    765
SETW4

Seminoe Resvr Inflow             Apr-Sep  986  107  1103  946    920
SETW4N

Laramie R nr Woods Landing       Apr-Sep   60   56    77   54    108
WODW4

Laramie R nr Woods Landing       Apr-Sep   99   70   116   92    142
WODW4N

Little Laramie R nr Filmore      Apr-Sep   49   89    56   46     55
SMTW4

Little Laramie R nr Filmore      Apr-Sep   51   89    59   48     57
SMTW4N

Antero Resvr Inflow              Apr-Sep   17  121    21   16     14
ANRC2

Antero Resvr Inflow              Apr-Sep   17  121    22   16     14
ANRC2N

Spinney Mountain Resvr Inflow    Apr-Sep   63  111    76   58     57
SPYC2

Spinney Mountain Resvr Inflow    Apr-Sep   51  113    64   47     45
SPYC2N

Elevenmile Canyon Resvr Inflow   Apr-Sep   57   97    70   52     59
EVNC2

Elevenmile Canyon Resvr Inflow   Apr-Sep   49   98    62   42     50
EVNC2N

Cheesman Lk Inflow               Apr-Sep  105  105   123   95    100
CHEC2

Cheesman Lk Inflow               Apr-Sep  101  109   118   89     93
CHEC2N

S Platte R at S Platte           Apr-Sep  327  136   360  312    240
SPTC2

S Platte R at S Platte           Apr-Sep  173   84   206  150    205
SPTC2N

Bear Cr at Morrison              Apr-Sep   20   77    23   19     26
MRRC2

Bear Cr at Morrison              Apr-Sep   20   77    23   19     26
MRRC2N

Clear Cr at Golden               Apr-Sep   87   74    97   82    118
GLDC2

Clear Cr at Golden               Apr-Sep  100   76   111   93    131
GLDC2N

St. Vrain Cr at Lyons            Apr-Sep   51   65    62   47     79
LNSC2

St. Vrain Cr at Lyons            Apr-Sep   75   69    89   69    109
LNSC2N

Boulder Cr nr Orodell            Apr-Sep   34   72    41   32     47
OROC2

Boulder Cr nr Orodell            Apr-Sep   45   87    53   43     52
OROC2N

S Boulder Cr nr Eldorado Sprgs   Apr-Sep   30   86    35   28     35
BELC2

S Boulder Cr nr Eldorado Sprgs   Apr-Sep   30   75    36   28     40
BELC2N

Cache La Poudre at Canyon Mouth  Apr-Sep  125  116   144  113    108
FTDC2

Cache La Poudre at Canyon Mouth  Apr-Sep  125   60   154  113    210
FTDC2N

Lima Resvr Inflow                Apr-Sep   49   64    53   47     76
LRRM8

Lima Resvr Inflow                Apr-Sep   49   62    53   47     79
LRRM8N

Clark Canyon Resvr Inflow        Apr-Sep   80   73    85   79    110
CLKM8

Clark Canyon Resvr Inflow        Apr-Sep  110   56   119  105    198
CLKM8N

Beaverhead R at Barretts         Apr-Sep  148   74   155  147    199
BARM8

Beaverhead R at Barretts         Apr-Sep  139   50   153  133    280
BARM8N

Ruby R Resvr Inflow              Apr-Sep   80   91    90   74     88
ALRM8

Ruby R Resvr Inflow              Apr-Sep   81   84    91   75     97
ALRM8N

Big Hole R nr Melrose            Apr-Sep  352   59   426  311    595
MLRM8

Big Hole R nr Melrose            Apr-Sep  418   63   491  375    660
MLRM8N

Hebgen Resvr Inflow              Apr-Sep  411   88   427  391    465
HBDM8

Hebgen Resvr Inflow              Apr-Sep  412   89   427  391    465
HBDM8N

Ennis Resvr Inflow               Apr-Sep  618   86   655  580    715
ELMM8

Ennis Resvr Inflow               Apr-Sep  634   87   672  590    730
ELMM8N

Gallatin R nr Gateway            Apr-Sep  398   84   494  345    475
GLGM8

Gallatin R nr Gateway            Apr-Sep  398   84   493  344    475
GLGM8N

Gallatin R at Logan              Apr-Sep  424   84   543  349    505
LOGM8

Gallatin R at Logan              Apr-Sep  571   88   691  496    650
LOGM8N

Missouri R at Toston             Apr-Sep 1554   75  1842 1366   2060
TOSM8

Missouri R at Toston             Apr-Sep 2170   77  2454 1971   2830
TOSM8N

Missouri R at Fort Benton        Apr-Sep 2075   68  2169 2052   3060
FBNM8

Missouri R at Fort Benton        Apr-Sep 3043   74  3381 2803   4100
FBNM8N

Missouri R nr Virgelle           Apr-Sep 2234   65  2344 2199   3420
VRGM8

Missouri R nr Virgelle           Apr-Sep 3362   74  3756 3105   4560
VRGM8N

Missouri R nr Landusky           Apr-Sep 2349   64  2509 2299   3680
LDKM8

Missouri R nr Landusky           Apr-Sep 3580   73  3980 3324   4890
LDKM8N

Missouri R below Fort Peck Dam   Apr-Sep 2807   73  2975 2736   3840
FPKM8

Missouri R below Fort Peck Dam   Apr-Sep 4189   81  4588 3903   5180
FPKM8N

Gibson Resvr Inflow              Apr-Sep  247   55   315  215    450
AGSM8

Gibson Resvr Inflow              Apr-Sep  247   55   315  215    450
AGSM8N

Marias R nr Shelby               Apr-Sep  210   48   267  192    435
SHLM8

Marias R nr Shelby               Apr-Sep  262   53   320  239    490
SHLM8N

Musselshell R at Harlowton       Apr-Sep   53   66    70   37     80
HLWM8

Musselshell R at Harlowton       Apr-Sep   71   75    89   52     95
HLWM8N

Yellowstone R at Yellowstone Lk  Apr-Sep  736   90   793  697    815
YLOW4

Yellowstone R at Yellowstone Lk  Apr-Sep  603   72   675  552    840
YLOW4N

Yellowstone R at Corwin Sprgs    Apr-Sep 1531   77  1656 1440   1980
CORM8

Yellowstone R at Corwin Sprgs    Apr-Sep 1496   72  1641 1393   2070
CORM8N

Yellowstone R at Livingston      Apr-Sep 1805   79  1938 1701   2290
LIVM8

Yellowstone R at Livingston      Apr-Sep 1835   75  1988 1720   2440
LIVM8N

Yellowstone R at Billings        Apr-Sep 2967   73  3323 2728   4070
BILM8

Yellowstone R at Billings        Apr-Sep 3645   76  4004 3396   4790
BILM8N

Yellowstone R at Miles City      Apr-Sep 4767   81  5419 4440   5850
MILM8

Yellowstone R at Miles City      Apr-Sep 6872   89  7620 6462   7690
MILM8N

Yellowstone R at Sidney          Apr-Sep 4791   84  5527 4446   5710
SIDM8

Yellowstone R at Sidney          Apr-Sep 7335   91  8154 6916   8060
SIDM8N

Boulder R at Big Timber          Apr-Sep  197   59   238  179    335
BTMM8

Boulder R at Big Timber          Apr-Sep  240   64   280  223    375
BTMM8N

Stillwater R nr Absarokee        Apr-Sep  375   69   433  323    540
SRAM8

Stillwater R nr Absarokee        Apr-Sep  435   73   492  385    595
SRAM8N

Clks Fk Yellowstone R nr Belfry  Apr-Sep  464   75   522  417    620
BFYM8

Clks Fk Yellowstone R nr Belfry  Apr-Sep  538   77   594  491    695
BFYM8N

Bighorn R nr St. Xavier          Apr-Sep 1388   97  1674 1271   1430
STXM8

Bighorn R nr St. Xavier          Apr-Sep 2682  109  3050 2530   2460
STXM8N

Little Bighorn R nr Hardin       Apr-Sep  143  113   153  138    127
HRDM8

Little Bighorn R nr Hardin       Apr-Sep  143  113   153  138    127
HRDM8N

Tongue R nr Dayton               Apr-Sep   68   71    79   62     96
DAYW4

Tongue R nr Dayton               Apr-Sep   74   73    85   68    101
DAYW4N

Tongue R nr Decker               Apr-Sep  187   80   208  176    235
DSLM8

Tongue R nr Decker               Apr-Sep  224   93   247  214    240
DSLM8N

Tongue R Resvr Inflow            Apr-Sep  161   69   183  151    235
DKRM8

Tongue R Resvr Inflow            Apr-Sep  204   83   227  194    245
DKRM8N

Powder R at Moorhead             Apr-Sep  191   85   206  183    225
MHDM8

Powder R at Moorhead             Apr-Sep  251   93   267  240    270
MHDM8N

Powder R nr Locate               Apr-Sep  224   86   245  216    260
LOCM8

Powder R nr Locate               Apr-Sep  287   94   308  275    305
LOCM8N


Locations with an `N` suffix indicate natural flows excluding
stream augmentations.

KAF: Thousands of Acre-feet

%AVG: Current 50%/AVG

AVG: Average(50%) seasonal runoff voulme as simulated by the river
forecast model considering acontinuous simulation of the basin
response to historic climate data (observed precipitation and
temperatures) over the period of 1991-2020.

The 50%, 10% and 90% columns indicate the probability that the
actual volume will exceed the forecast for the valid time period.

Beginning April 1, May and June official forecasts include observed
runoff volume up to official forecast date.

For more information, please visit: www.weather.gov/mbrfc/water

