June 1, 2022 Spring and Summer Streamflow Forecasts
Upper Missouri Basin
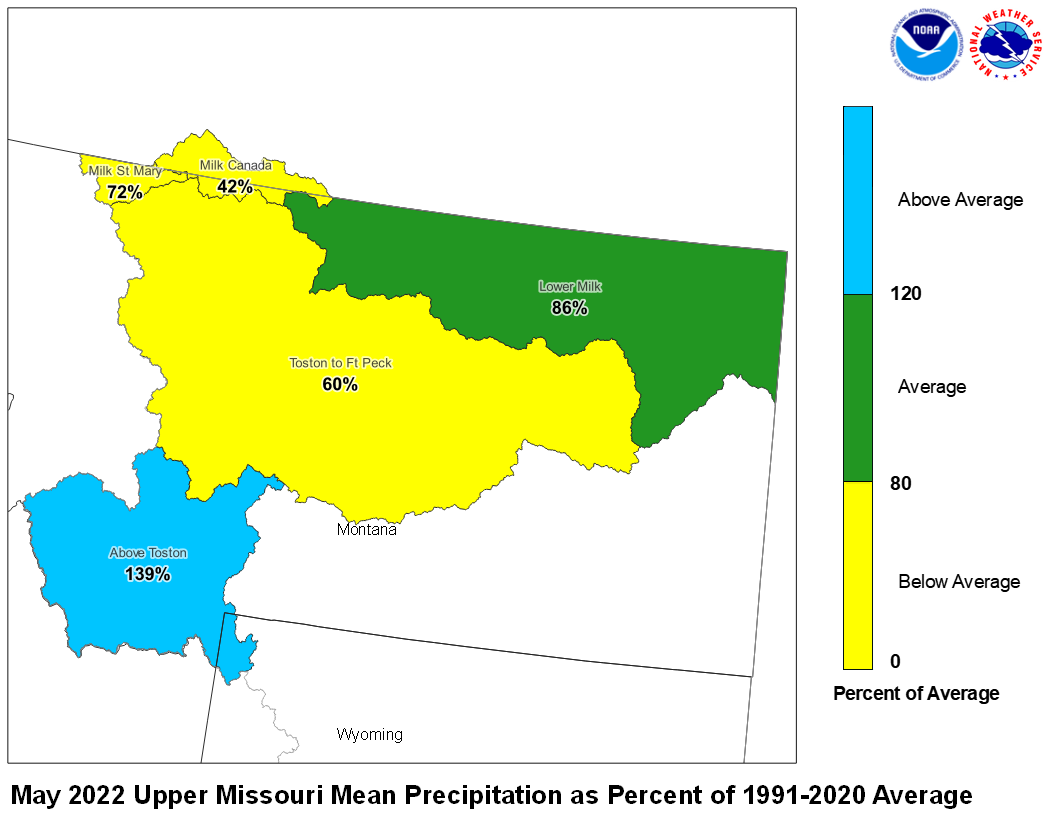
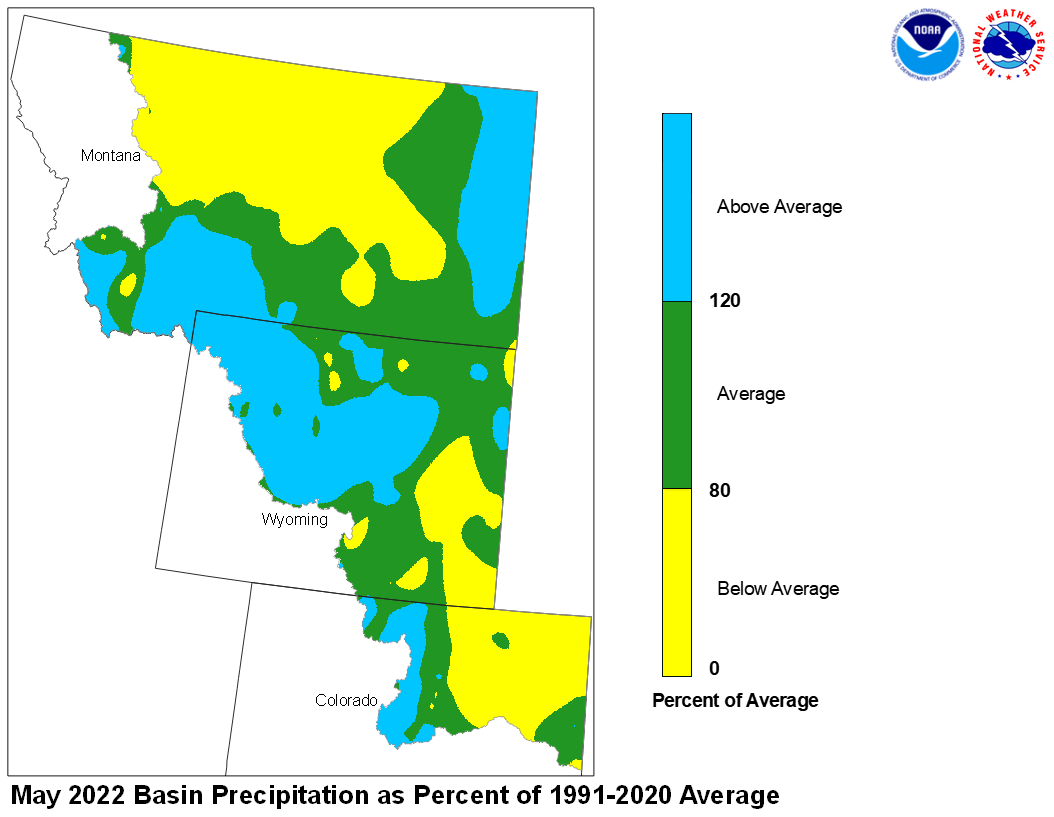
May precipitation across the Upper Missouri Basin ranged from below to above
average. Basin precipitation summaries for the Missouri Basin include: Milk St. Mary,
72 percent; Milk Canada, 42 percent; Lower Milk, 86 percent; above Toston,
139 percent; Toston to Ft. Peck, 60 percent.
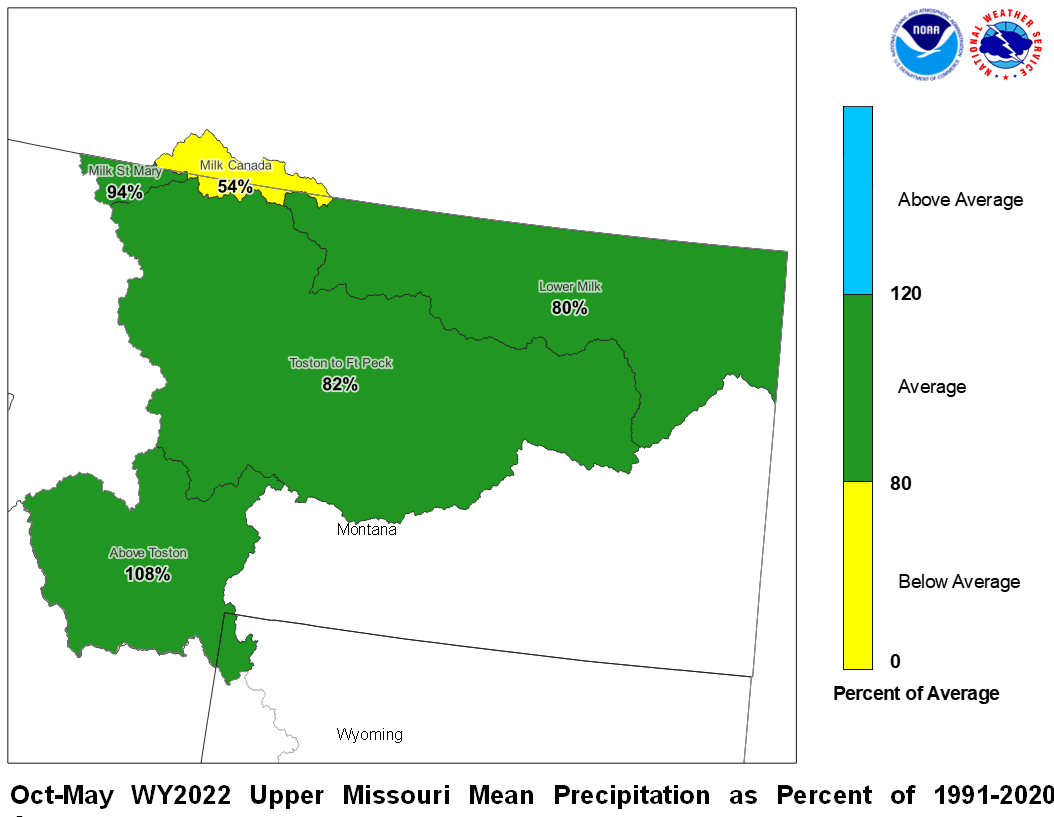
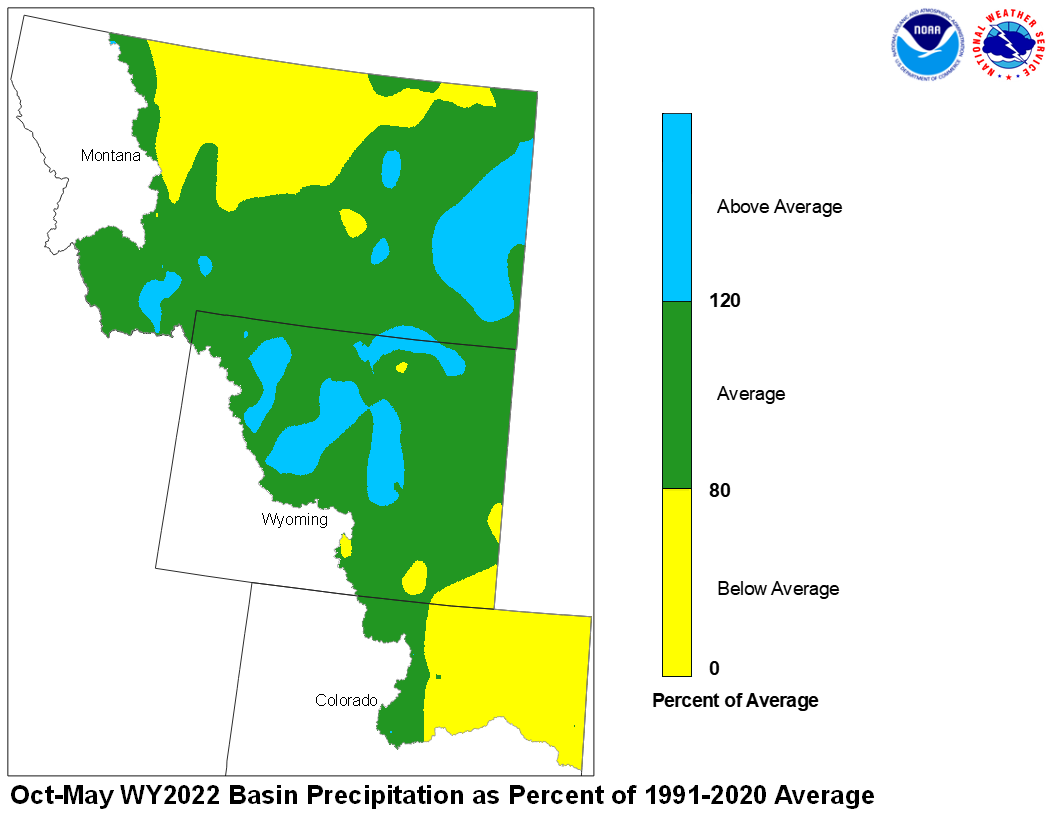
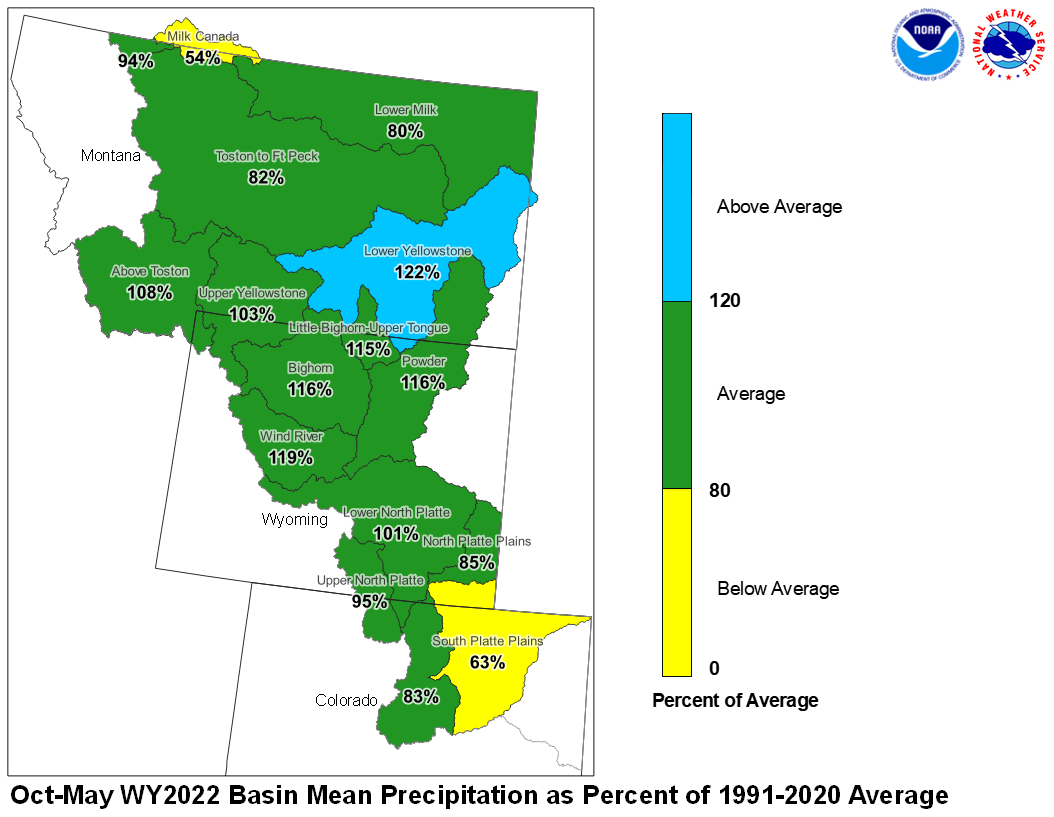
May 2022 Upper Missouri Mean Precip Oct-May WY2022 Upper Missouri Mean Precip
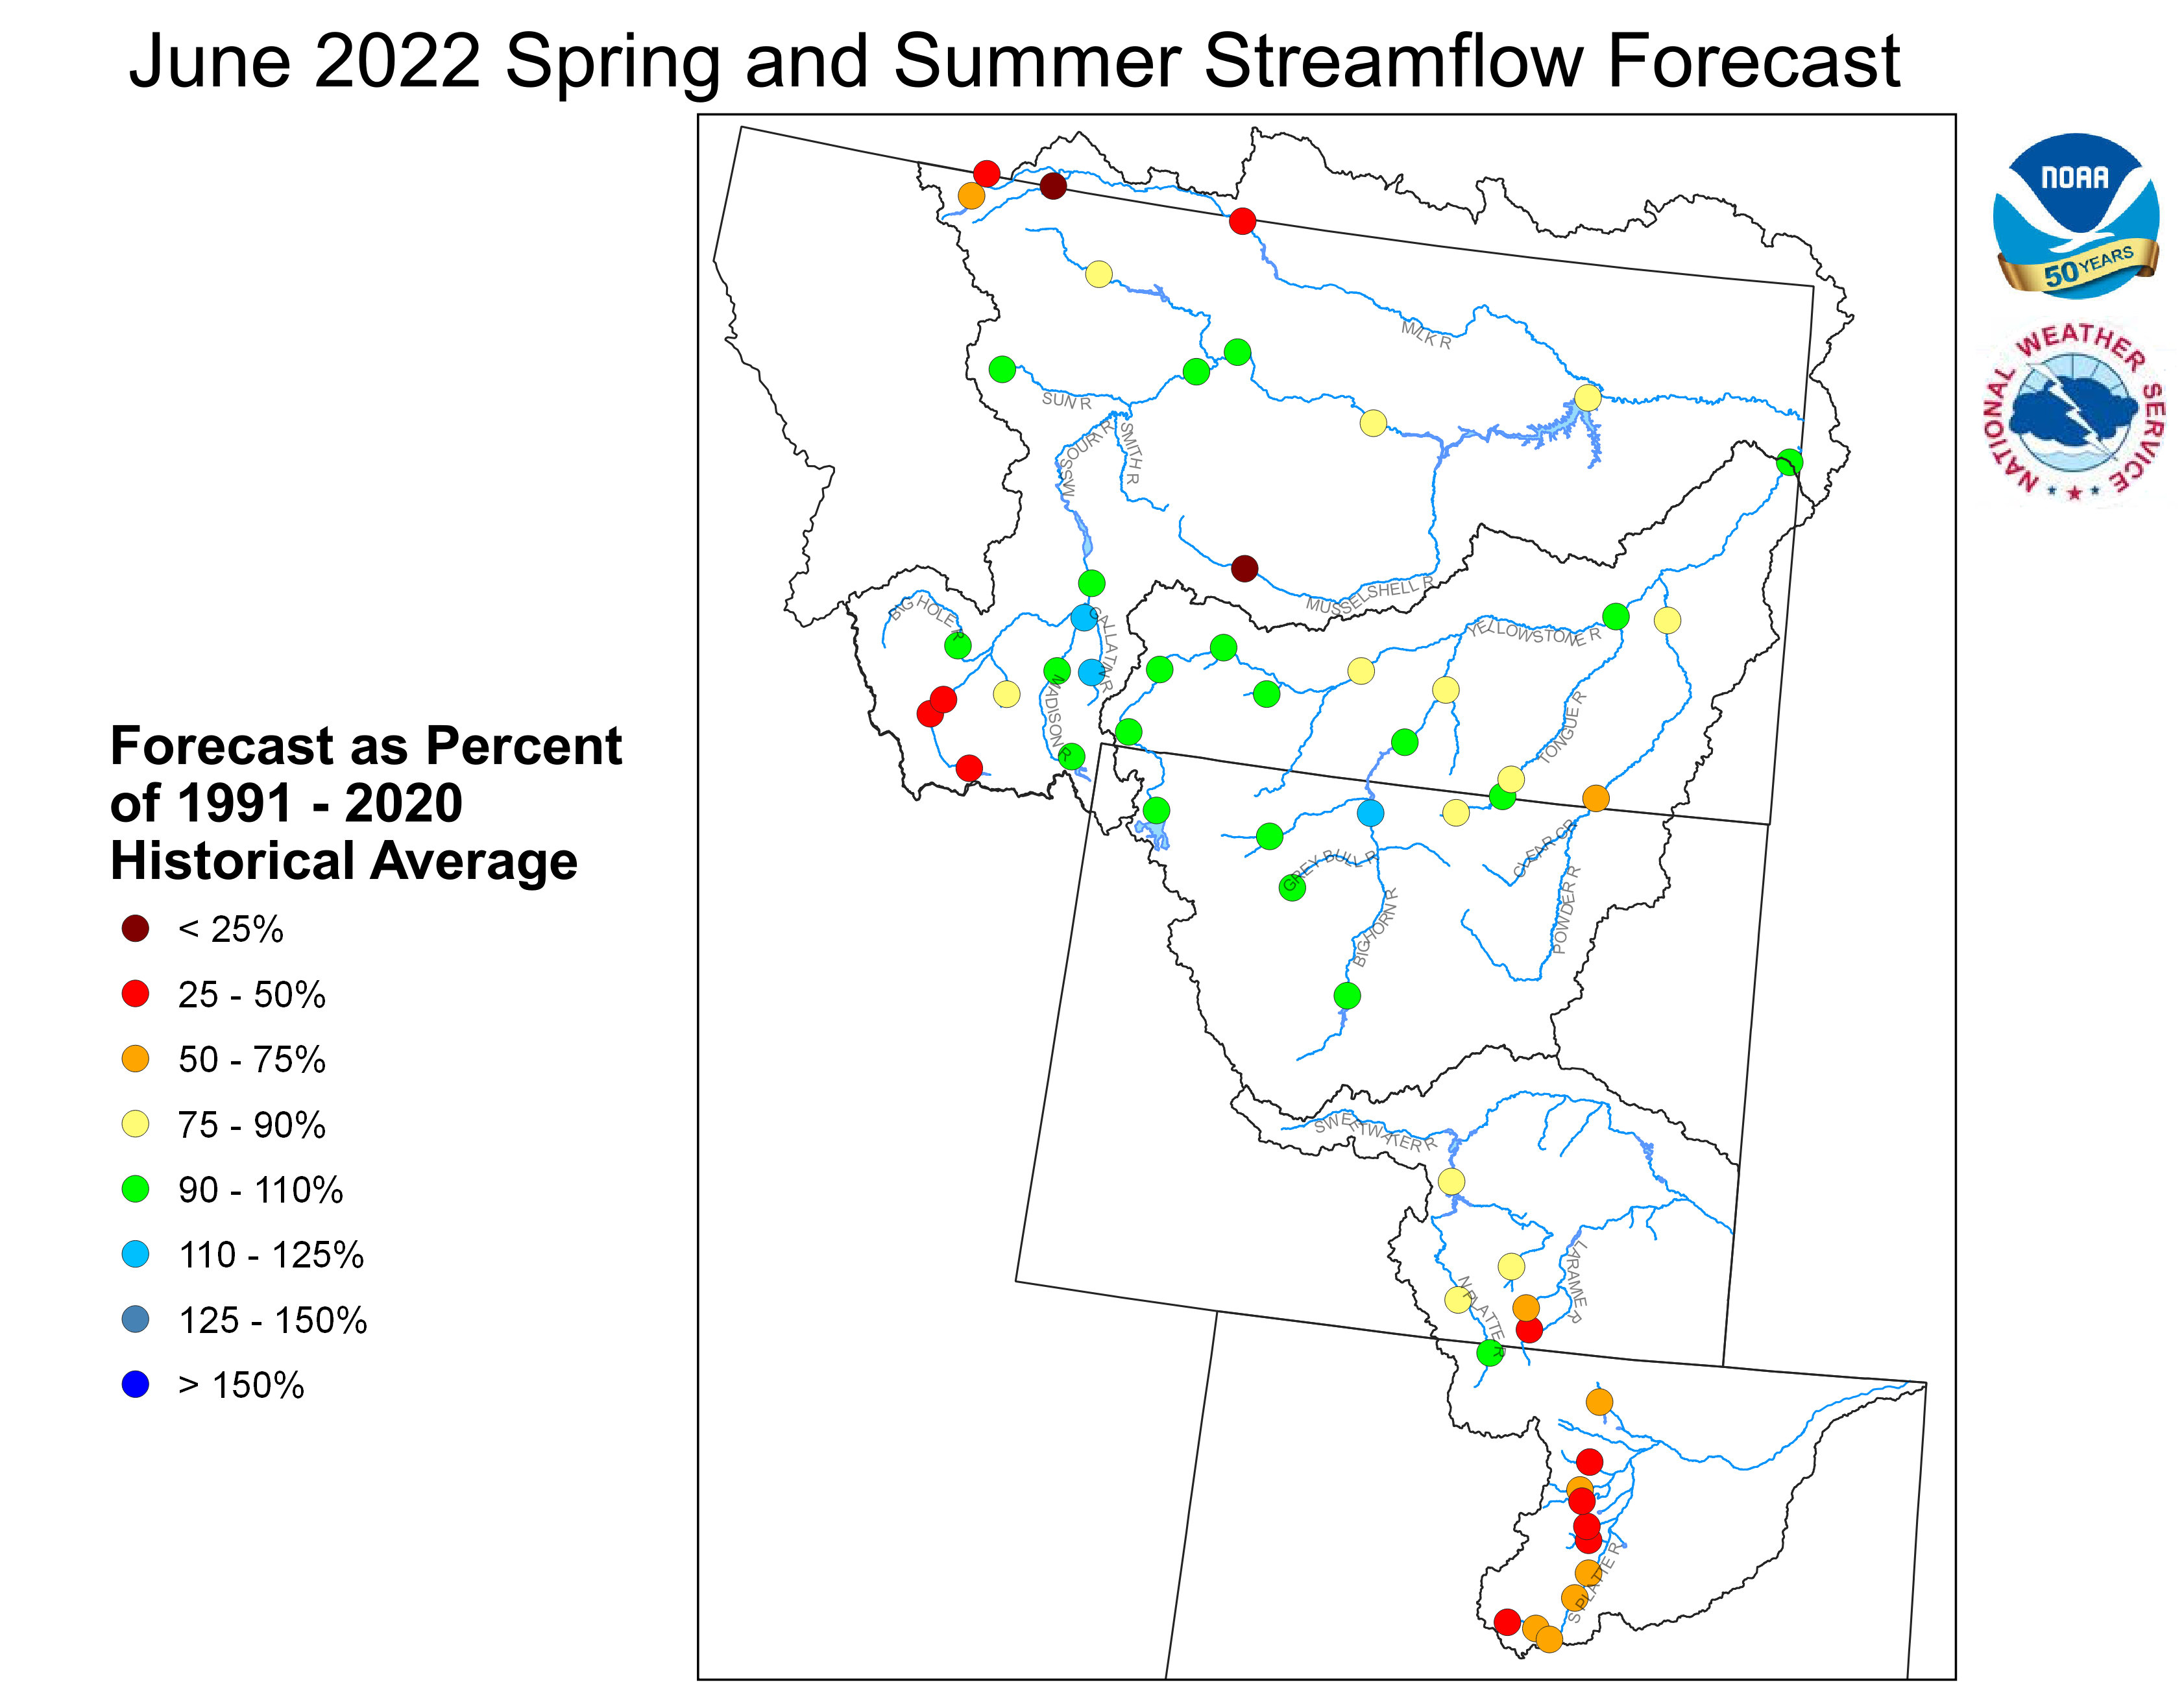
Stream flow in the Upper Missouri Basin is forecast to be
below average during the upcoming Spring and Summer.
The St. Mary River is forecast to have 54 percent of average
June-September flows. Runoff is expected to range around
87 percent of average for the Missouri Basin above Fort Peck,
Montana.
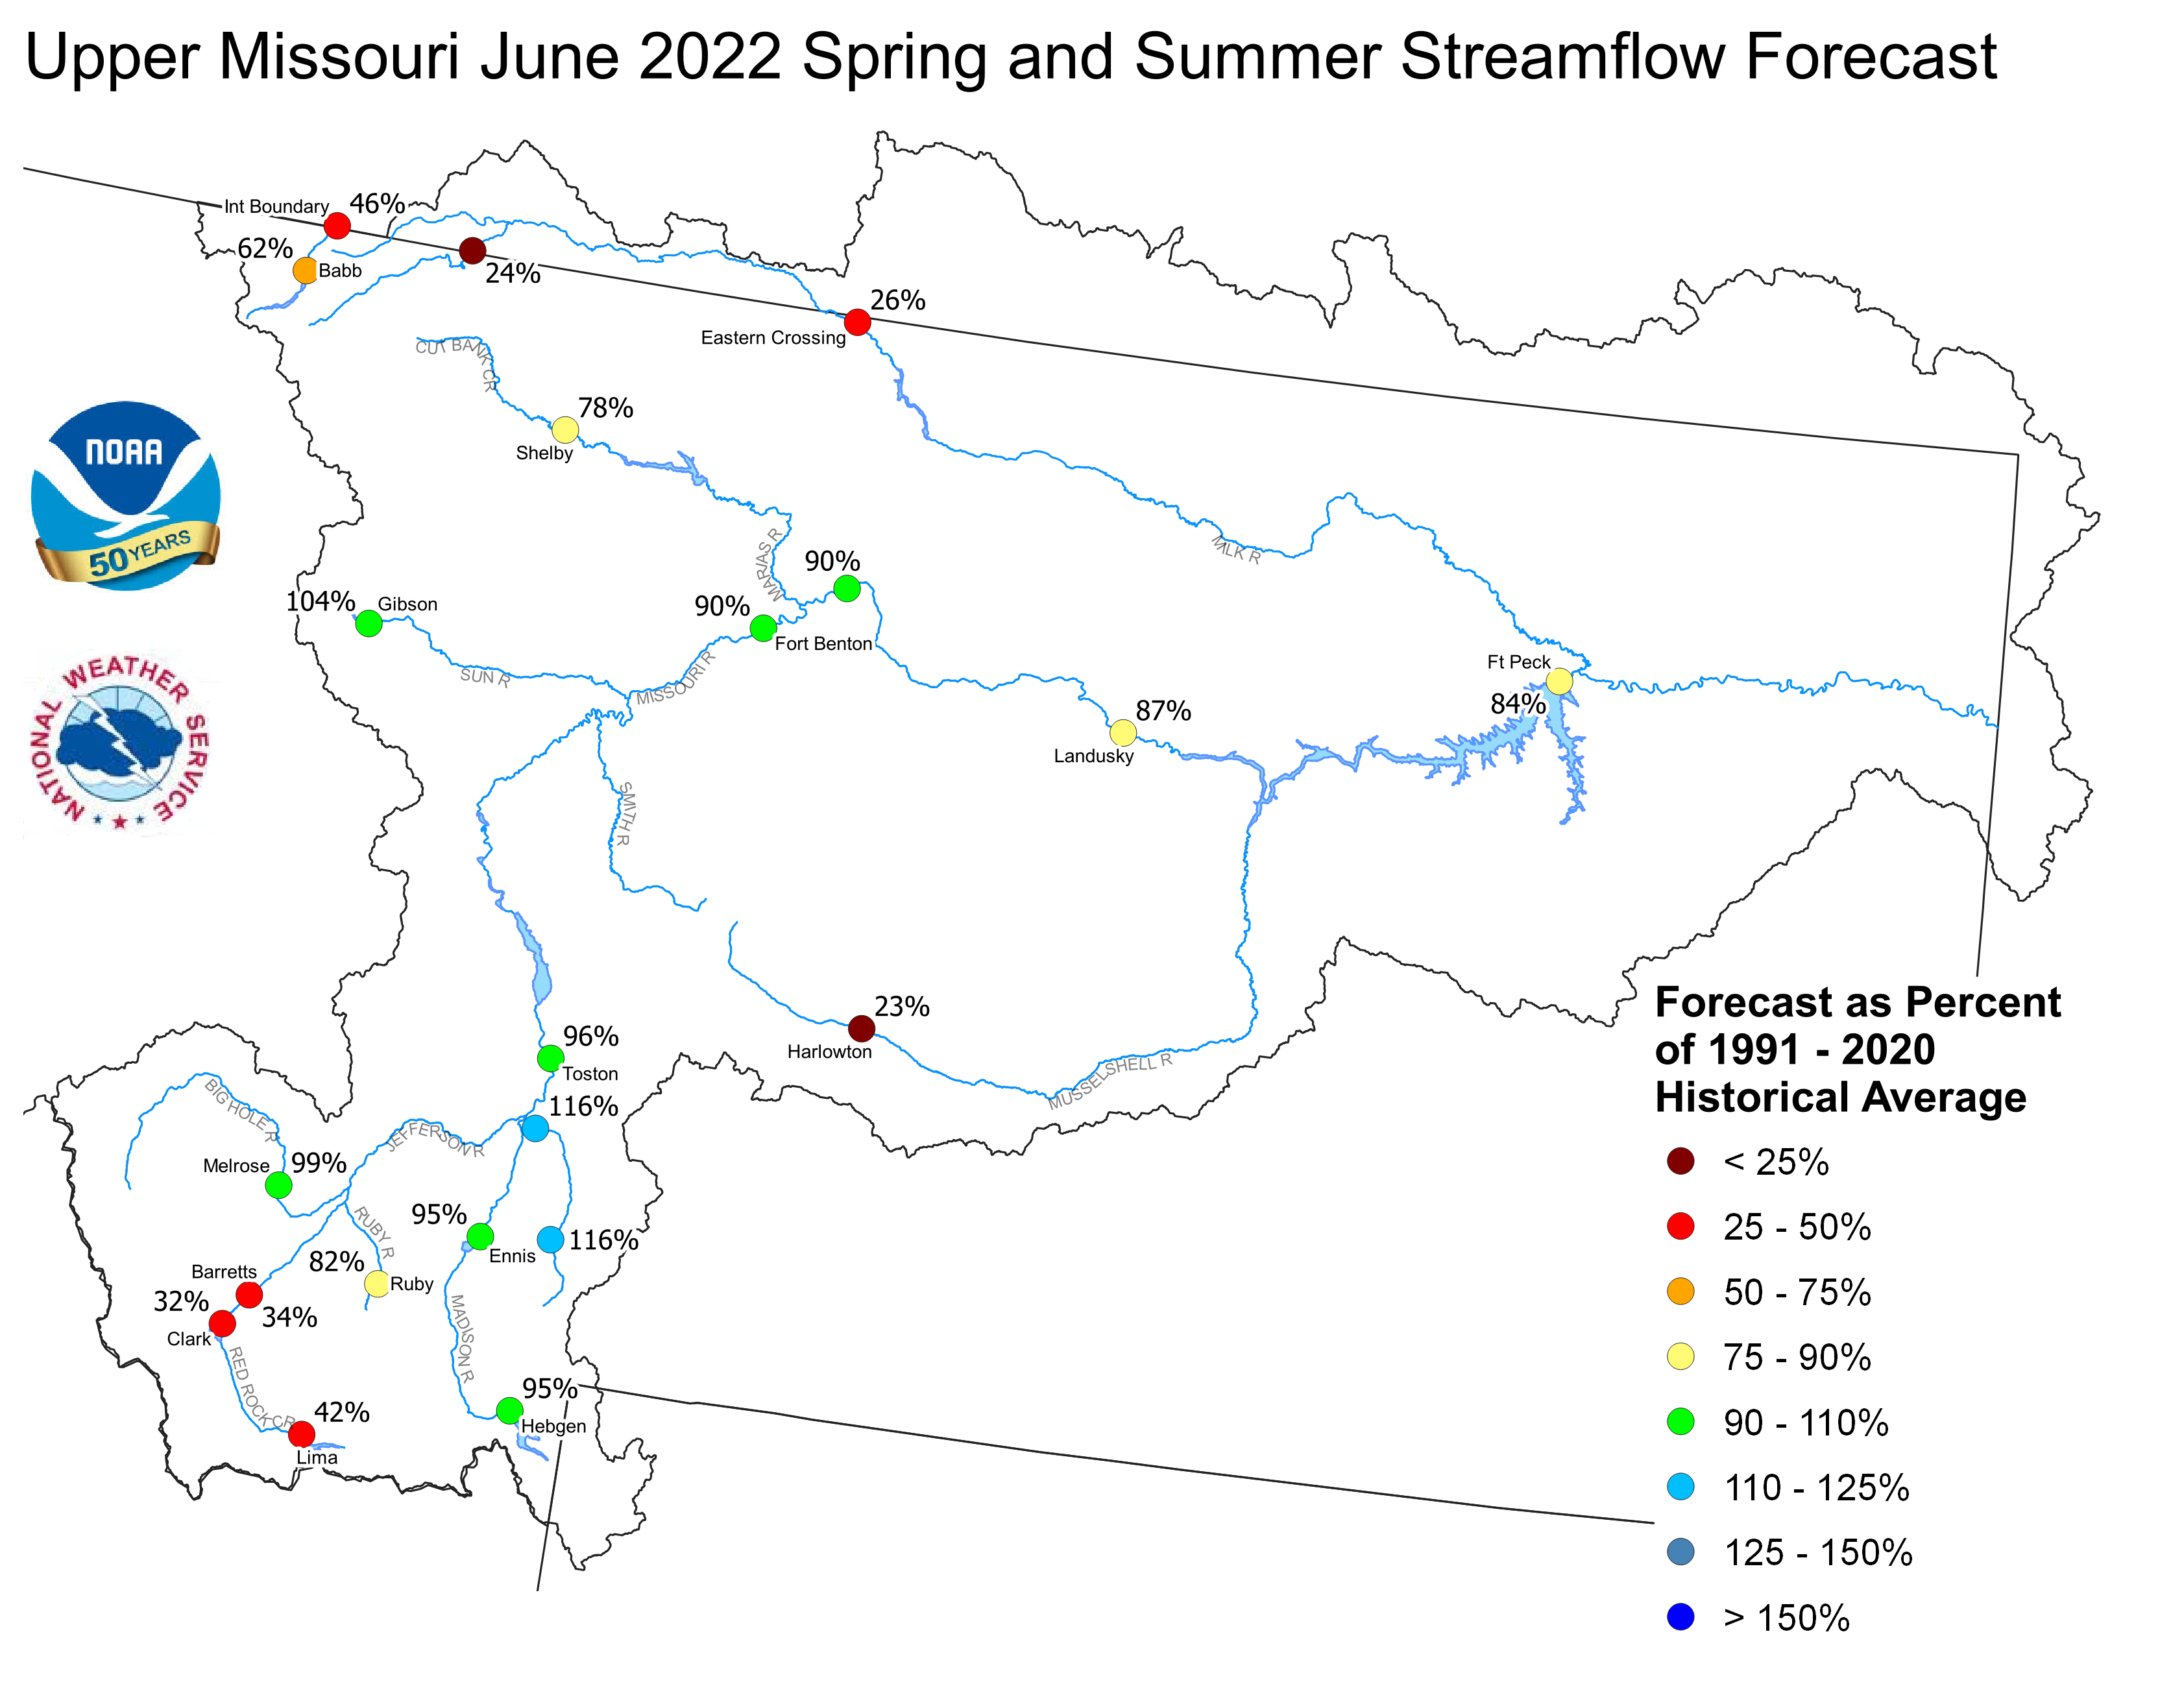
Upper Missouri June 1, 2022 Spring and Summer Streamflow Forecasts
Of the four major irrigation reservoirs in Montana; Lima
Reservoir had 74 percent average storage, Clark Canyon was
holding 71 percent of average water, Gibson Reservoir had 65
percent of average stored water, and Fresno Reservoir had
41 percent of average stored water.
Yellowstone Basin
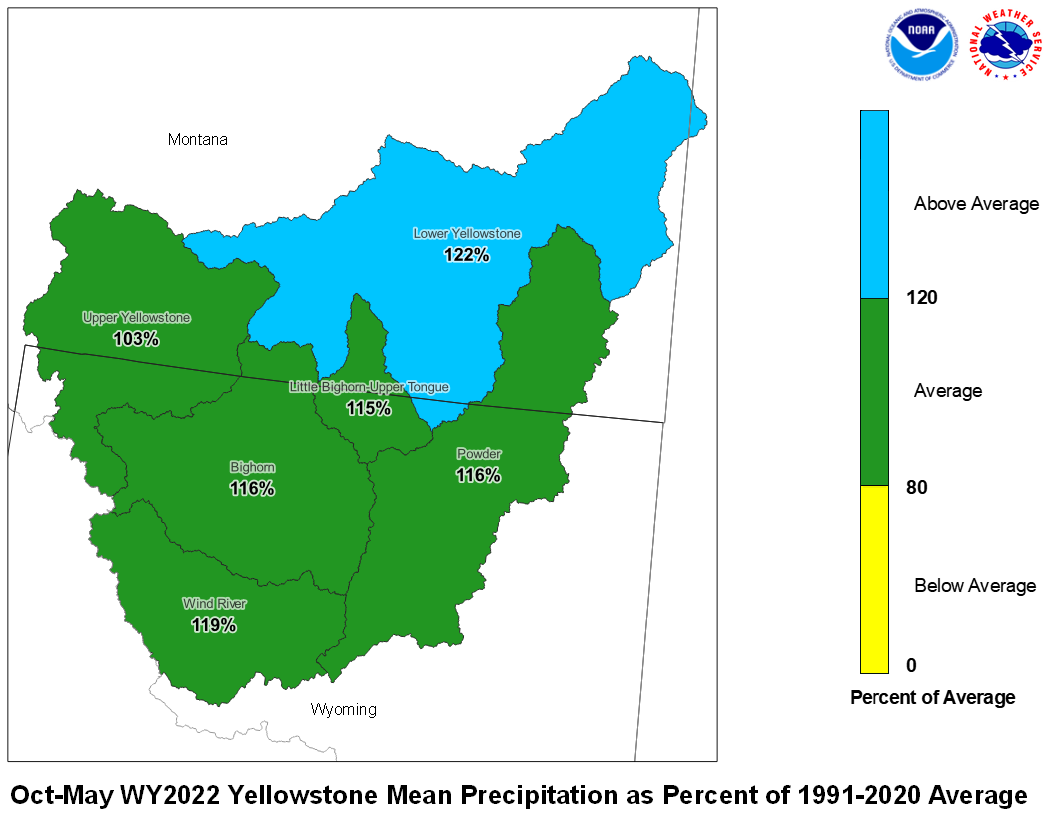
Precipitation during May was above average. The upper Yellowstone River
Basin received 147 percent of average precipitation while the Lower
Yellowstone River Basin reported 103 percent of average. The Bighorn
Basin received 136 percent of average precipitation while the
Wind River Basin received 150 percent of average. The Little Bighorn -
Upper Tongue Basin received 110 percent of average and the Powder River
had 121 percent of average precipitation.

May 2022 Yellowstone Mean Precip Oct-May WY2022 Yellowstone Mean Precip
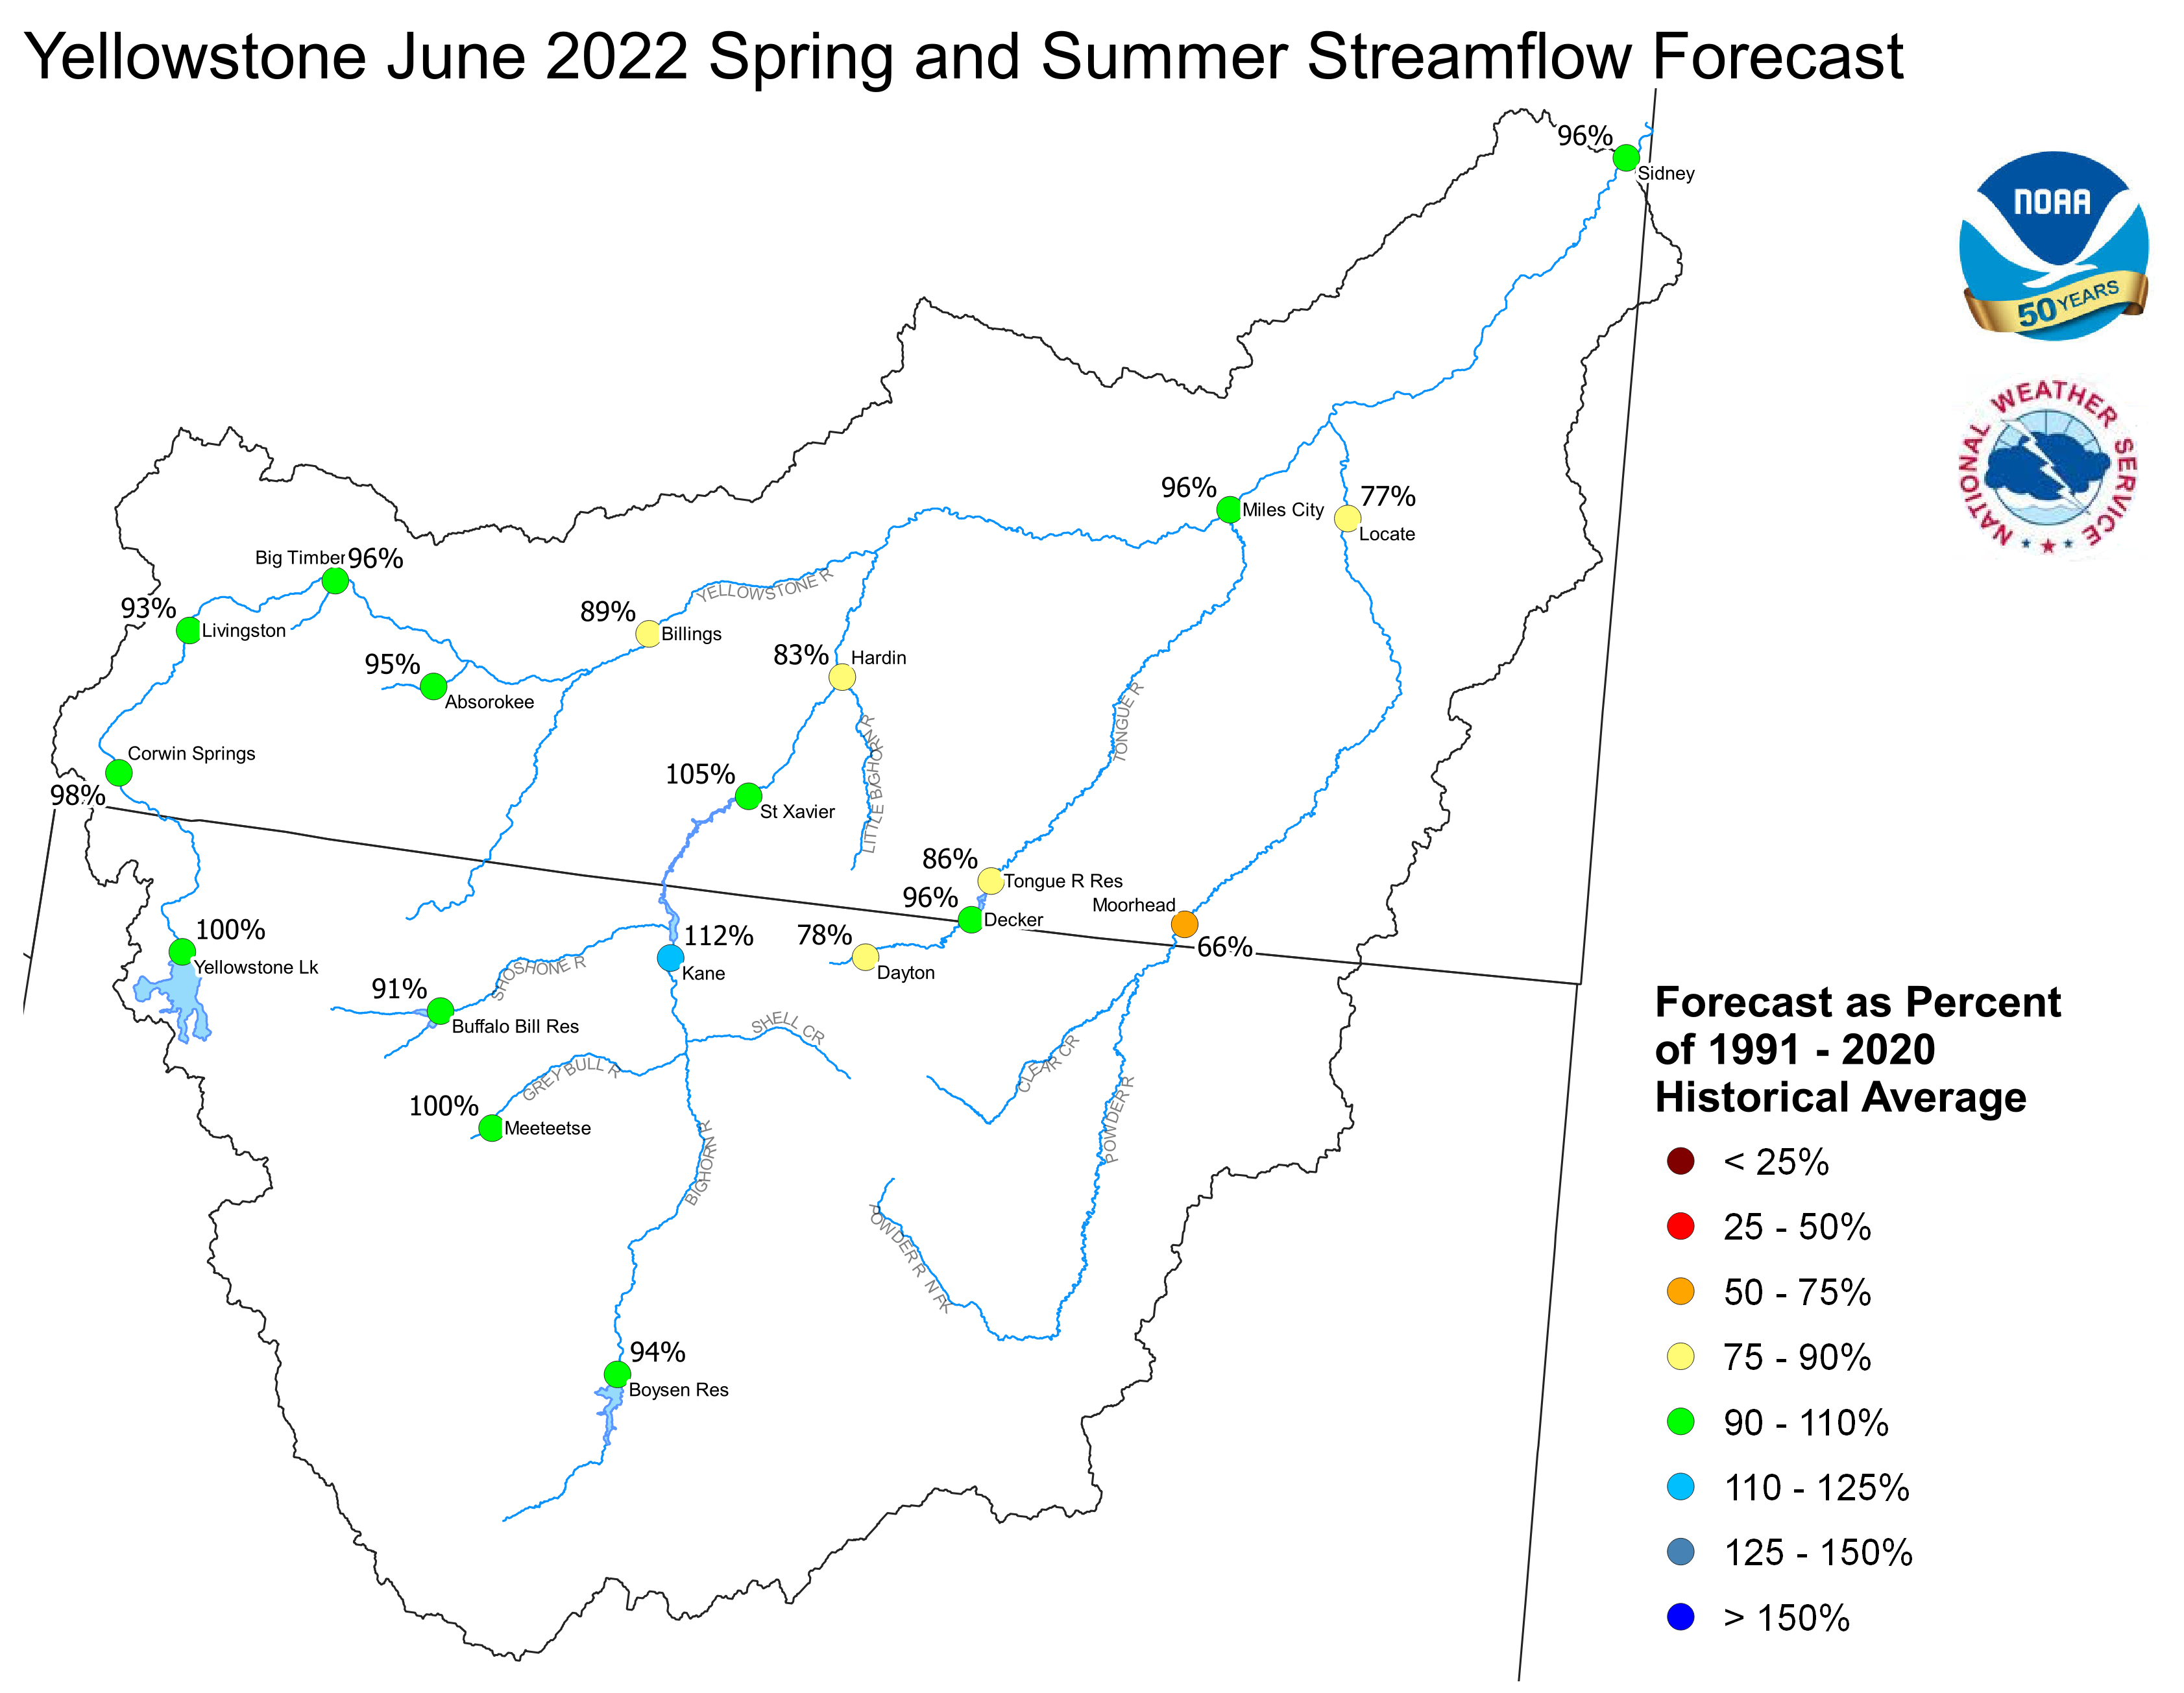
Forecast stream flow in the Yellowstone Basin is near average
for the upcoming Spring and Summer. Stream flow for the
Yellowstone River above Sidney, Montana is forecast to be about
96 percent of average. Flow in the Tongue Basin is expected to be
86 percent of average. Flows in the Powder River are expected
to be about 72 percent of average.
Month end storage at Boysen Reservoir was 108 percent of average.
Stored water in Buffalo Bill Reservoir was 89 percent of average.
Month end storage was 99 percent of average at Bighorn Reservoir.
Yellowstone June 1, 2022 Spring and Summer Streamflow Forecasts
Platte Basin
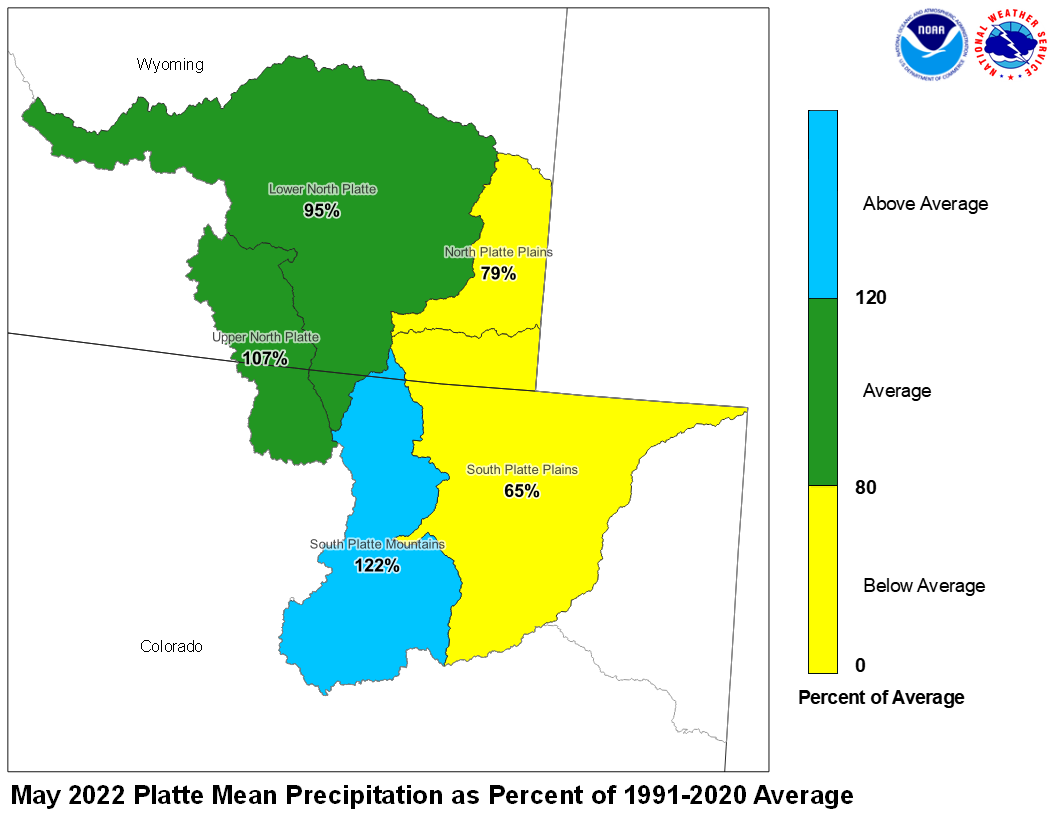
Precipitation during May in the Upper North Platte Basin was 107
percent of average. In the Lower North Platte Basin, precipitation
was 95 percent of average. The North Platte Plains below Guernsy
Reservoir had 79 percent. The South Platte Mountains had 122
percent whereas the Plains had 65 percent of average May
precipitation.

May 2022 Platte Mean Precip Oct-May WY2022 Platte Mean Precip
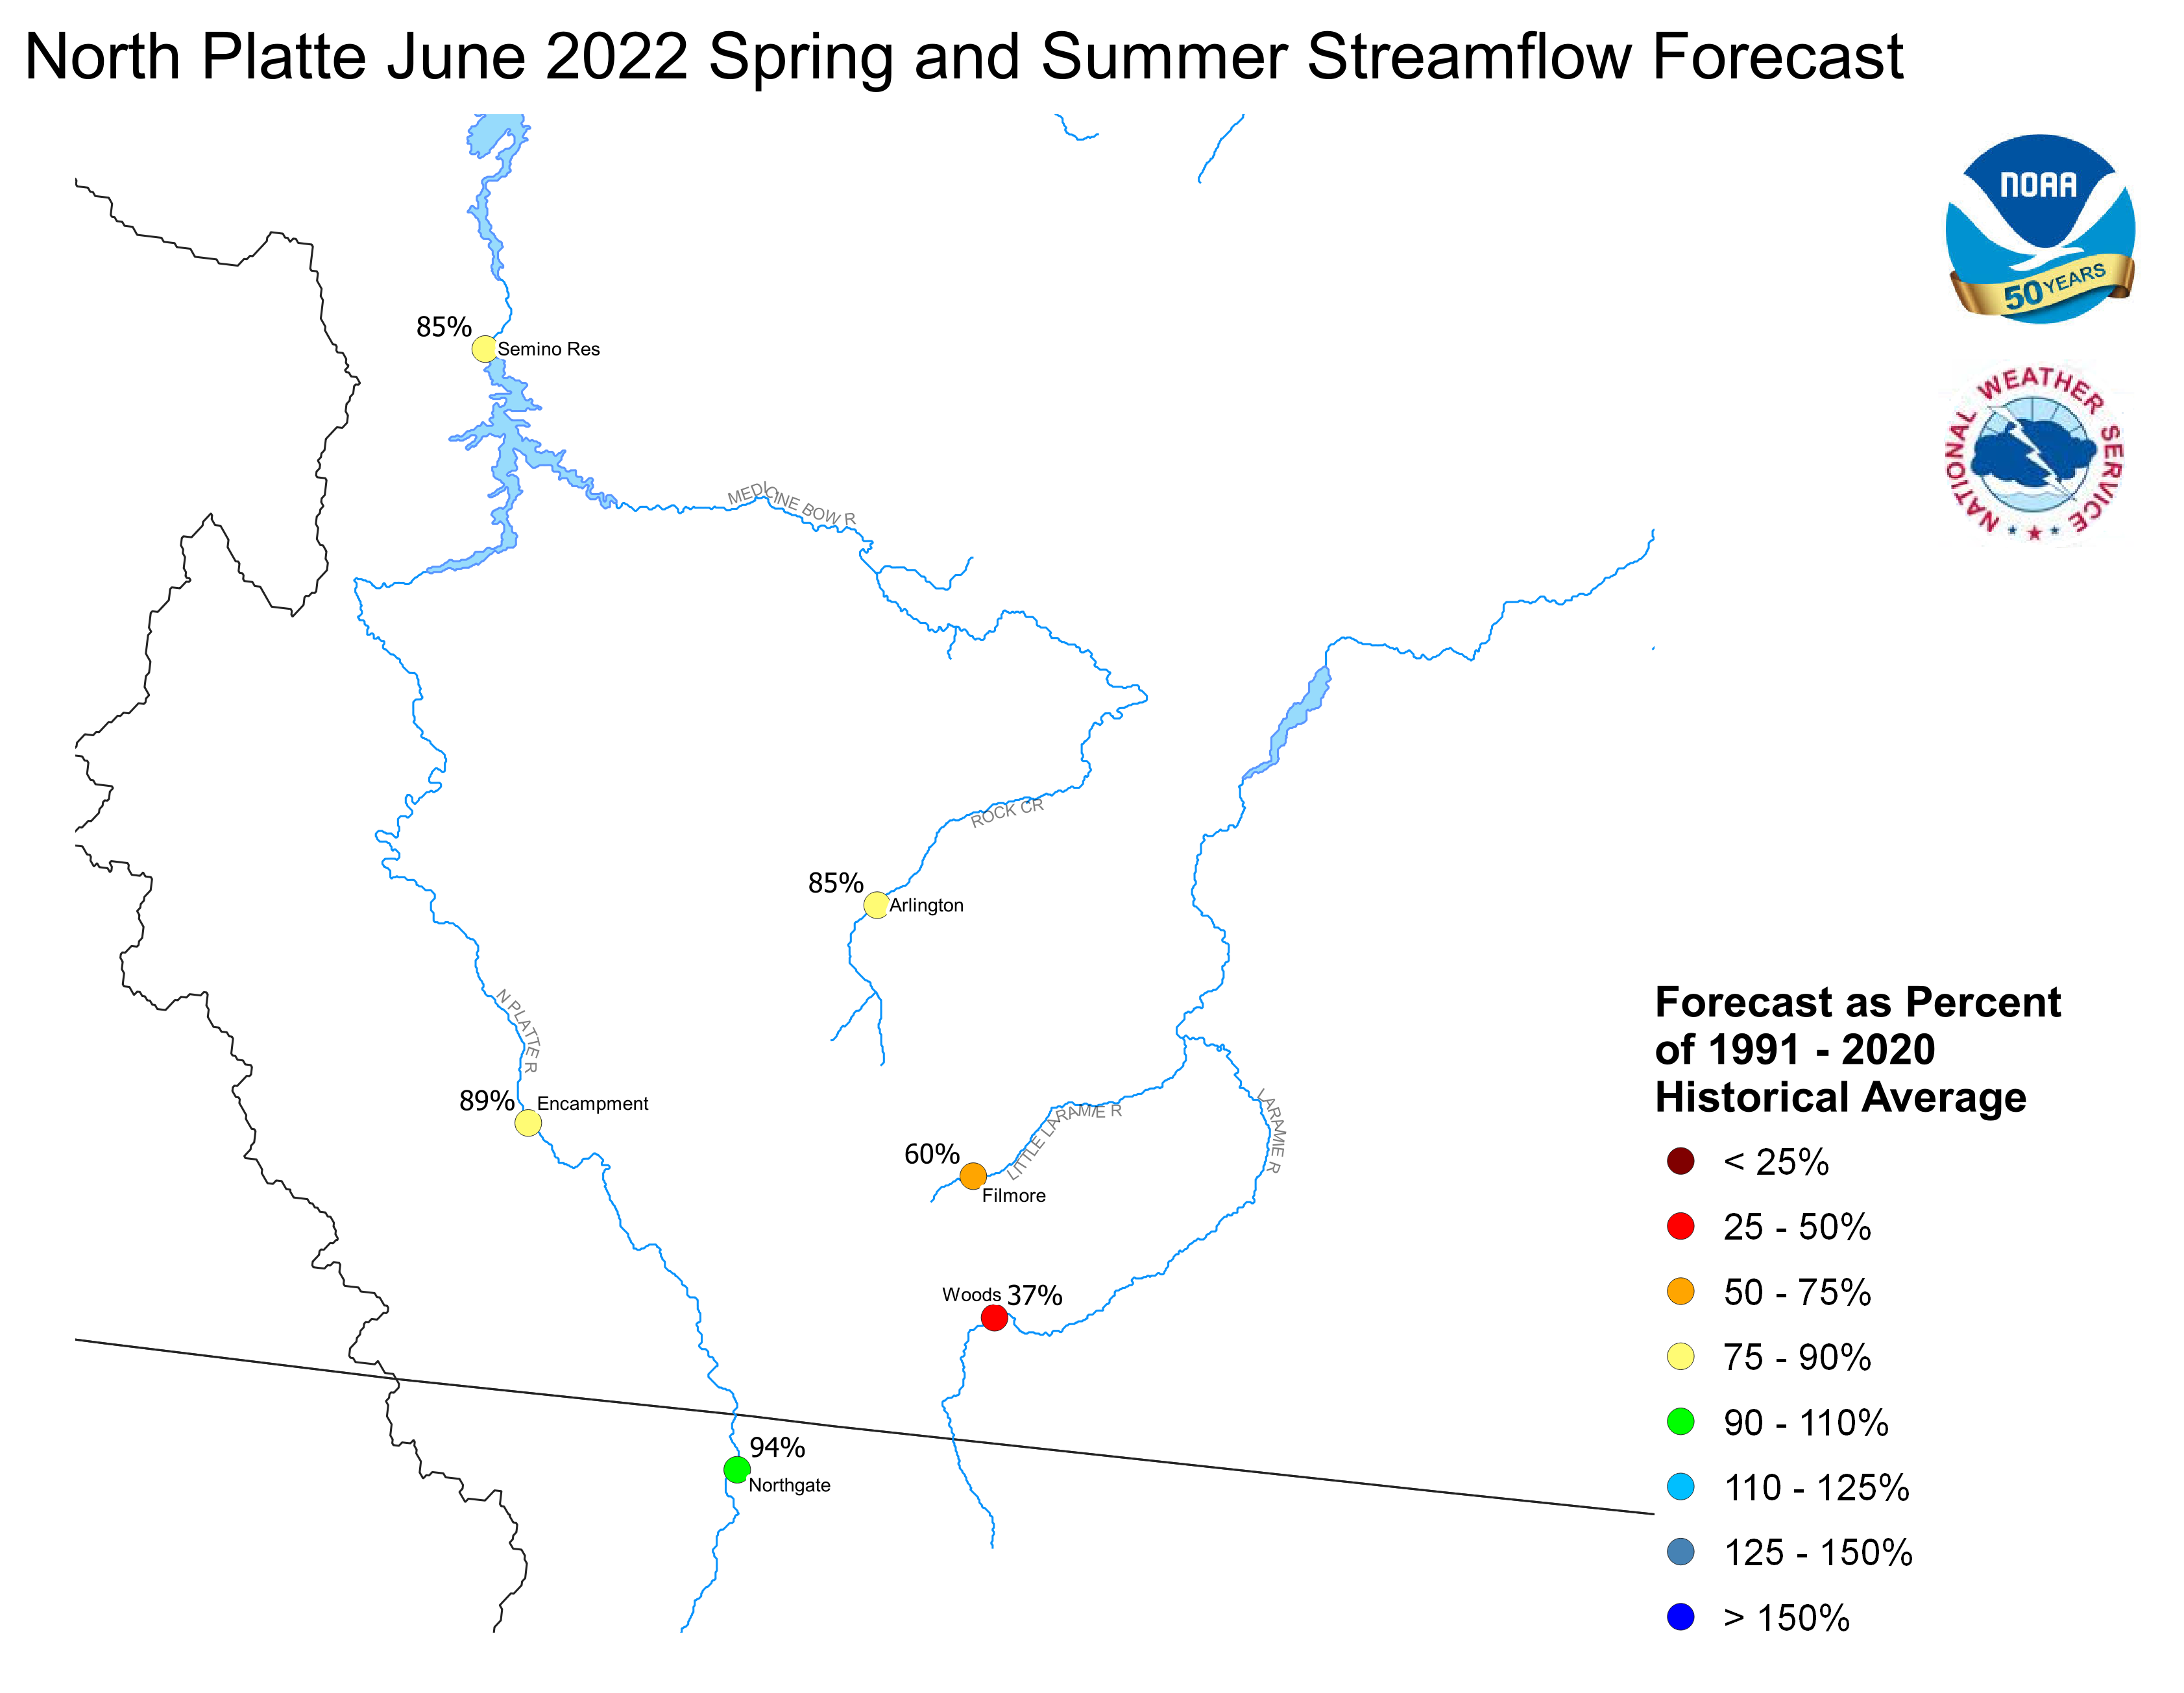
Stream flow in the Platte Basin is forecast to be below
average during the upcoming Spring and Summer. Runoff
for streams above Seminoe Reservoir are expected to be
about 85 percent of average. Streams in the South Platte
Basin above South Platte, Colorado can expect 54 percent
of average flow. For the remainder of the South Platte
basin, flows are expected near 48 percent.
Stored water in the South Platte Basin was 91 percent of average
on June 1.
North Platte Streamflow Fcst South Platte Streamflow Fcst
000
FGUS63 KKRF 031654
ESPKRF
WATER SUPPLY FORECAST
NWS MISSOURI BASIN RIVER FORECAST CENTER
PLEASANT HILL MISSOURI

1148 CDT FRIDAY JUNE 03, 2022

DATA CURRENT AS OF: JUNE 01, 2022

MISSOURI/YELLOWSTONE/PLATTE RIVER BASIN FORECASTS


                                          50%   %   10%   90%   AVG
FORECAST POINT                   PERIOD  (KAF) AVG (KAF) (KAF) (KAF)
--------------------------------------------------------------------

Boysen Resvr Inflow              Apr-Sep  471   65   665  415    720
SBDW4

Boysen Resvr Inflow              Apr-Sep  840   94  1036  762    890
SBDW4N

Bighorn R at Kane                Apr-Sep  999  101  1304  905    985
LVEW4

Bighorn R at Kane                Apr-Sep 1613  112  1941 1497   1440
LVEW4N

Greybull R at Meeteetse          Apr-Sep  206  105   249  176    196
MEEW4

Greybull R at Meeteetse          Apr-Sep  206  100   249  176    205
MEEW4N

Buffalo Bill Resvr Inflow        Apr-Sep  726   89   843  657    815
CDYW4

Buffalo Bill Resvr Inflow        Apr-Sep  824   91   935  759    910
CDYW4N

St. Mary R nr Babb               Apr-Sep  349   76   395  329    460
SMYM8

St. Mary R nr Babb               Apr-Sep  332   62   379  311    535
SMYM8N

St. Mary R at Intl Boundary      Apr-Sep  230   59   298  198    390
SMBM8

St. Mary R at Intl Boundary      Apr-Sep  302   46   367  274    660
SMBM8N

Milk R nr Western Crossing       Apr-Sep    7    6    19    6    113
PDBM8

Milk R nr Western Crossing       Apr-Sep   10   24    27    8     41
PDBM8N

Milk R nr Eastern Crossing       Apr-Sep  177   82   201  169    215
ERNM8

Milk R nr Eastern Crossing       Apr-Sep   29   26    79   22    112
ERNM8N

North Platte R nr Northgate      Apr-Sep  221   90   271  196    245
NGTC2

North Platte R nr Northgate      Apr-Sep  277   94   326  252    295
NGTC2N

Encampment R nr Encampment       Apr-Sep  139   89   151  133    156
ECRW4

Encampment R nr Encampment       Apr-Sep  148   89   159  142    166
ECRW4N

Rock Cr nr Arlington             Apr-Sep   44   83    50   43     53
KCRW4

Rock Cr nr Arlington             Apr-Sep   45   85    50   43     53
KCRW4N

Seminoe Resvr Inflow             Apr-Sep  609   80   737  561    765
SETW4

Seminoe Resvr Inflow             Apr-Sep  781   85   901  740    920
SETW4N

Laramie R nr Woods Landing       Apr-Sep   60   56    72   54    108
WODW4

Laramie R nr Woods Landing       Apr-Sep   53   37    65   47    142
WODW4N

Little Laramie R nr Filmore      Apr-Sep   32   58    39   29     55
SMTW4

Little Laramie R nr Filmore      Apr-Sep   34   60    41   32     57
SMTW4N

Antero Resvr Inflow              Apr-Sep    6   43    10    6     14
ANRC2

Antero Resvr Inflow              Apr-Sep    6   43    10    5     14
ANRC2N

Spinney Mountain Resvr Inflow    Apr-Sep   43   75    50   38     57
SPYC2

Spinney Mountain Resvr Inflow    Apr-Sep   31   69    40   26     45
SPYC2N

Elevenmile Canyon Resvr Inflow   Apr-Sep   47   80    54   44     59
EVNC2

Elevenmile Canyon Resvr Inflow   Apr-Sep   33   66    44   27     50
EVNC2N

Cheesman Lk Inflow               Apr-Sep   57   57    72   50    100
CHEC2

Cheesman Lk Inflow               Apr-Sep   50   54    68   38     93
CHEC2N

S Platte R at S Platte           Apr-Sep  184   77   205  177    240
SPTC2

S Platte R at S Platte           Apr-Sep  103   50   136   84    205
SPTC2N

Bear Cr at Morrison              Apr-Sep   11   42    15   10     26
MRRC2

Bear Cr at Morrison              Apr-Sep   11   42    15   10     26
MRRC2N

Clear Cr at Golden               Apr-Sep   44   37    53   40    118
GLDC2

Clear Cr at Golden               Apr-Sep   50   38    61   46    131
GLDC2N

St. Vrain Cr at Lyons            Apr-Sep   32   41    41   28     79
LNSC2

St. Vrain Cr at Lyons            Apr-Sep   51   47    64   46    109
LNSC2N

Boulder Cr nr Orodell            Apr-Sep   23   49    28   21     47
OROC2

Boulder Cr nr Orodell            Apr-Sep   35   67    42   33     52
OROC2N

S Boulder Cr nr Eldorado Sprgs   Apr-Sep   12   34    17   11     35
BELC2

S Boulder Cr nr Eldorado Sprgs   Apr-Sep   12   30    18   11     40
BELC2N

Cache La Poudre at Canyon Mouth  Apr-Sep  156  144   183  146    108
FTDC2

Cache La Poudre at Canyon Mouth  Apr-Sep  151   72   182  140    210
FTDC2N

Lima Resvr Inflow                Apr-Sep   33   43    40   31     76
LRRM8

Lima Resvr Inflow                Apr-Sep   33   42    40   31     79
LRRM8N

Clark Canyon Resvr Inflow        Apr-Sep   38   35    42   37    110
CLKM8

Clark Canyon Resvr Inflow        Apr-Sep   63   32    76   56    198
CLKM8N

Beaverhead R at Barretts         Apr-Sep  117   59   124  114    199
BARM8

Beaverhead R at Barretts         Apr-Sep   96   34   116   89    280
BARM8N

Ruby R Resvr Inflow              Apr-Sep   78   89    91   70     88
ALRM8

Ruby R Resvr Inflow              Apr-Sep   80   82    92   72     97
ALRM8N

Big Hole R nr Melrose            Apr-Sep  583   98   680  501    595
MLRM8

Big Hole R nr Melrose            Apr-Sep  651   99   746  565    660
MLRM8N

Hebgen Resvr Inflow              Apr-Sep  443   95   463  420    465
HBDM8

Hebgen Resvr Inflow              Apr-Sep  443   95   464  420    465
HBDM8N

Ennis Resvr Inflow               Apr-Sep  628   88   684  585    715
ELMM8

Ennis Resvr Inflow               Apr-Sep  695   95   752  649    730
ELMM8N

Gallatin R nr Gateway            Apr-Sep  549  116   660  484    475
GLGM8

Gallatin R nr Gateway            Apr-Sep  549  116   659  484    475
GLGM8N

Gallatin R at Logan              Apr-Sep  613  121   759  503    505
LOGM8

Gallatin R at Logan              Apr-Sep  752  116   895  660    650
LOGM8N

Missouri R at Toston             Apr-Sep 2036   99  2393 1776   2060
TOSM8

Missouri R at Toston             Apr-Sep 2724   96  3077 2456   2830
TOSM8N

Missouri R at Fort Benton        Apr-Sep 1733   57  2160 1630   3060
FBNM8

Missouri R at Fort Benton        Apr-Sep 3707   90  4170 3380   4100
FBNM8N

Missouri R nr Virgelle           Apr-Sep 1855   54  2287 1755   3420
VRGM8

Missouri R nr Virgelle           Apr-Sep 4104   90  4657 3755   4560
VRGM8N

Missouri R nr Landusky           Apr-Sep 1912   52  2354 1807   3680
LDKM8

Missouri R nr Landusky           Apr-Sep 4237   87  4793 3879   4890
LDKM8N

Missouri R below Fort Peck Dam   Apr-Sep 1937   50  2407 1817   3840
FPKM8

Missouri R below Fort Peck Dam   Apr-Sep 4335   84  4897 3962   5180
FPKM8N

Gibson Resvr Inflow              Apr-Sep  468  104   557  429    450
AGSM8

Gibson Resvr Inflow              Apr-Sep  469  104   558  429    450
AGSM8N

Marias R nr Shelby               Apr-Sep  316   73   409  293    435
SHLM8

Marias R nr Shelby               Apr-Sep  380   78   467  353    490
SHLM8N

Musselshell R at Harlowton       Apr-Sep   16   20    18   15     80
HLWM8

Musselshell R at Harlowton       Apr-Sep   22   23    25   21     95
HLWM8N

Yellowstone R at Yellowstone Lk  Apr-Sep  895  110   970  844    815
YLOW4

Yellowstone R at Yellowstone Lk  Apr-Sep  838  100   931  770    840
YLOW4N

Yellowstone R at Corwin Sprgs    Apr-Sep 2014  102  2168 1884   1980
CORM8

Yellowstone R at Corwin Sprgs    Apr-Sep 2027   98  2215 1886   2070
CORM8N

Yellowstone R at Livingston      Apr-Sep 2186   95  2367 2041   2290
LIVM8

Yellowstone R at Livingston      Apr-Sep 2274   93  2481 2120   2440
LIVM8N

Yellowstone R at Billings        Apr-Sep 3857   95  4362 3533   4070
BILM8

Yellowstone R at Billings        Apr-Sep 4264   89  4785 3950   4790
BILM8N

Yellowstone R at Miles City      Apr-Sep 5356   92  6194 4828   5850
MILM8

Yellowstone R at Miles City      Apr-Sep 7371   96  8295 6790   7690
MILM8N

Yellowstone R at Sidney          Apr-Sep 5355   94  6240 4888   5710
SIDM8

Yellowstone R at Sidney          Apr-Sep 7731   96  8675 7137   8060
SIDM8N

Boulder R at Big Timber          Apr-Sep  326   97   373  294    335
BTMM8

Boulder R at Big Timber          Apr-Sep  361   96   410  331    375
BTMM8N

Stillwater R nr Absarokee        Apr-Sep  527   98   595  471    540
SRAM8

Stillwater R nr Absarokee        Apr-Sep  567   95   636  512    595
SRAM8N

Clks Fk Yellowstone R nr Belfry  Apr-Sep  639  103   712  583    620
BFYM8

Clks Fk Yellowstone R nr Belfry  Apr-Sep  694  100   765  640    695
BFYM8N

Bighorn R nr St. Xavier          Apr-Sep 1176   82  1598  997   1430
STXM8

Bighorn R nr St. Xavier          Apr-Sep 2584  105  3003 2382   2460
STXM8N

Little Bighorn R nr Hardin       Apr-Sep  105   83   119   98    127
HRDM8

Little Bighorn R nr Hardin       Apr-Sep  105   83   119   98    127
HRDM8N

Tongue R nr Dayton               Apr-Sep   74   77    81   67     96
DAYW4

Tongue R nr Dayton               Apr-Sep   79   78    86   72    101
DAYW4N

Tongue R nr Decker               Apr-Sep  198   84   218  179    235
DSLM8

Tongue R nr Decker               Apr-Sep  230   96   249  211    240
DSLM8N

Tongue R Resvr Inflow            Apr-Sep  165   70   185  146    235
DKRM8

Tongue R Resvr Inflow            Apr-Sep  210   86   230  191    245
DKRM8N

Powder R at Moorhead             Apr-Sep  141   63   164  132    225
MHDM8

Powder R at Moorhead             Apr-Sep  178   66   199  166    270
MHDM8N

Powder R nr Locate               Apr-Sep  195   75   221  185    260
LOCM8

Powder R nr Locate               Apr-Sep  235   77   258  221    305
LOCM8N


Locations with an `N` suffix indicate natural flows excluding
stream augmentations.

KAF: Thousands of Acre-feet

%AVG: Current 50%/AVG

AVG: Average(50%) seasonal runoff voulme as simulated by the river
forecast model considering acontinuous simulation of the basin
response to historic climate data (observed precipitation and
temperatures) over the period of 1991-2020.

The 50%, 10% and 90% columns indicate the probability that the
actual volume will exceed the forecast for the valid time period.

Beginning April 1, May and June official forecasts include observed
runoff volume up to official forecast date.

For more information, please visit: www.weather.gov/mbrfc/water


$$


