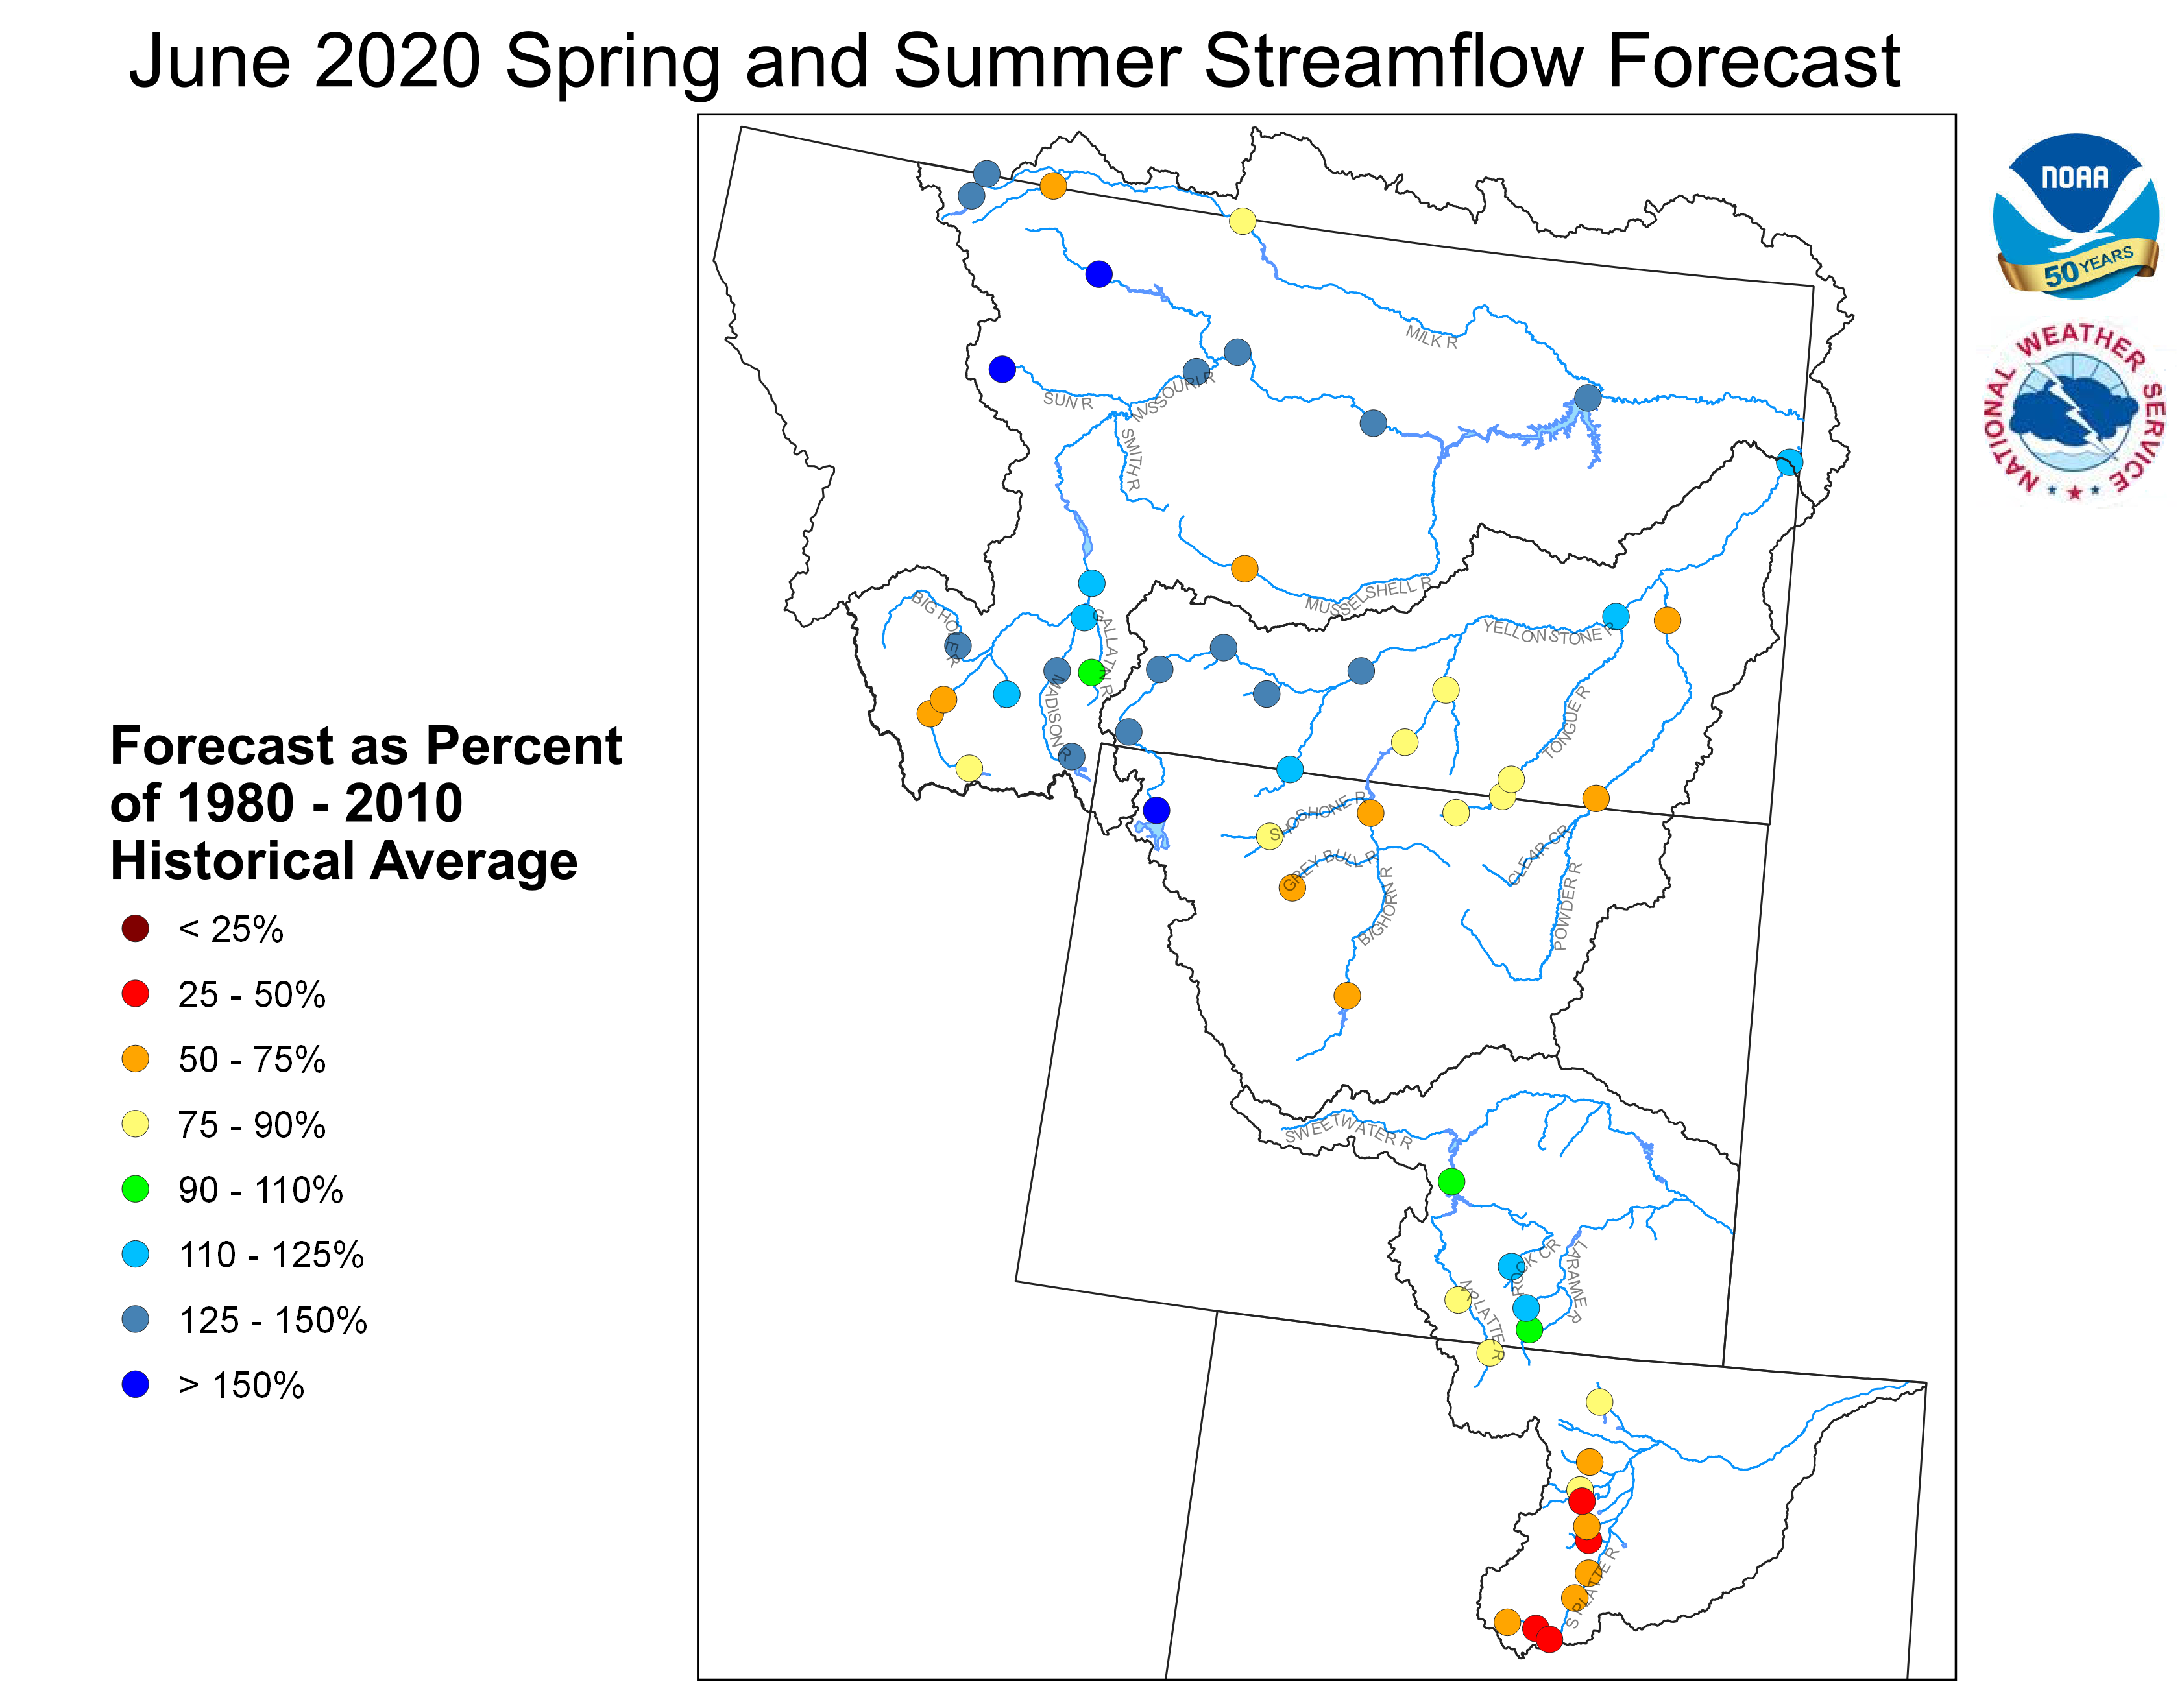
June 1, 2020 Spring and Summer Streamflow Forecasts
Upper Missouri Basin
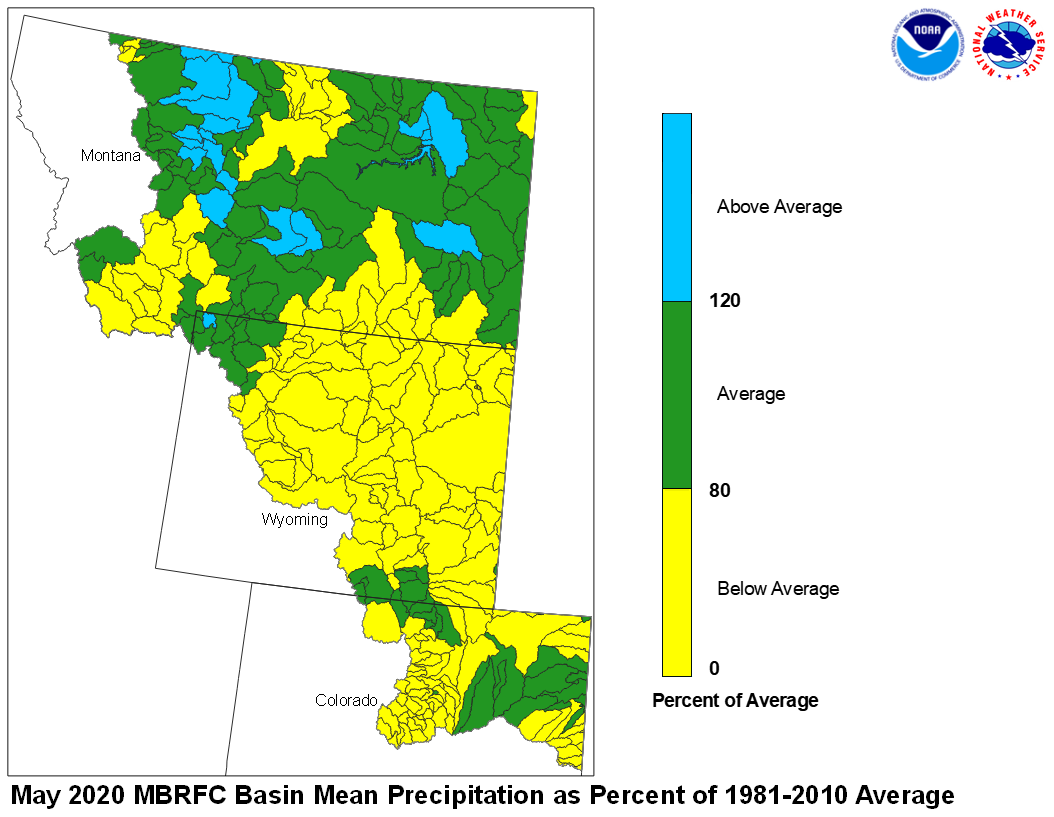
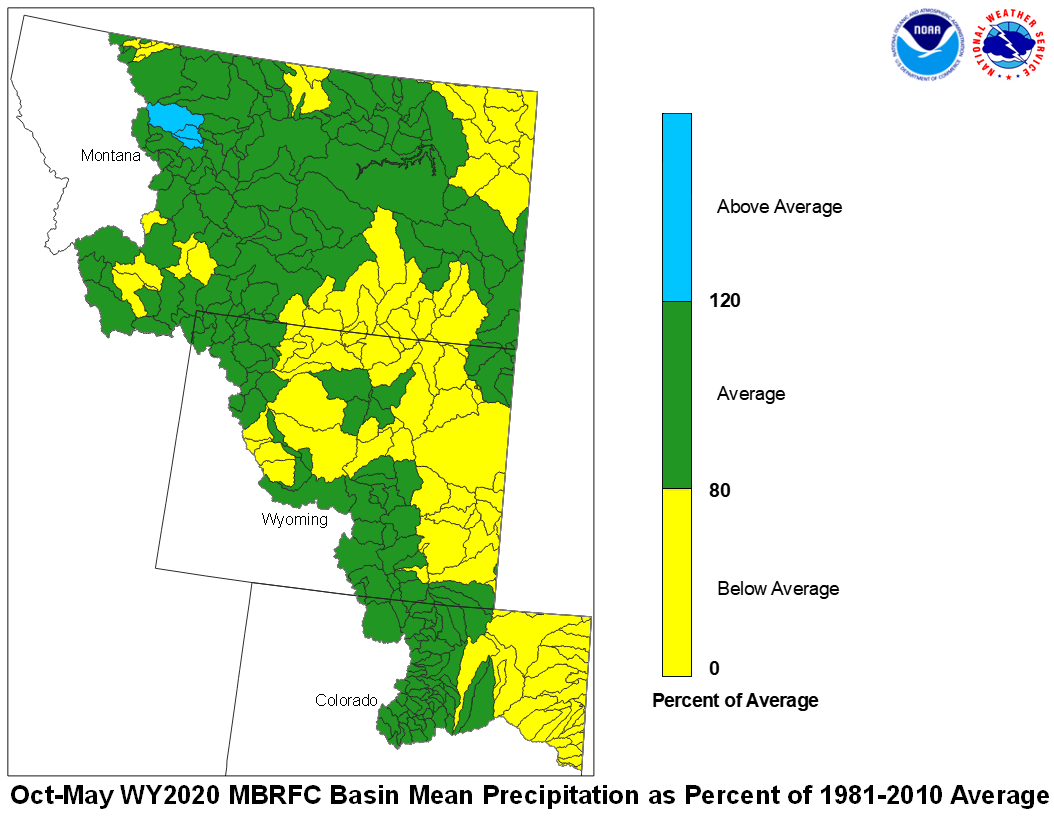
The high elevation snow pack in the Upper Missouri Basin as of June 1 was near average. The snow pack above Fort Peck, Montana was 89 percent. The snow pack in the St. Mary Basin was not available, and the Milk River Basin was not available.
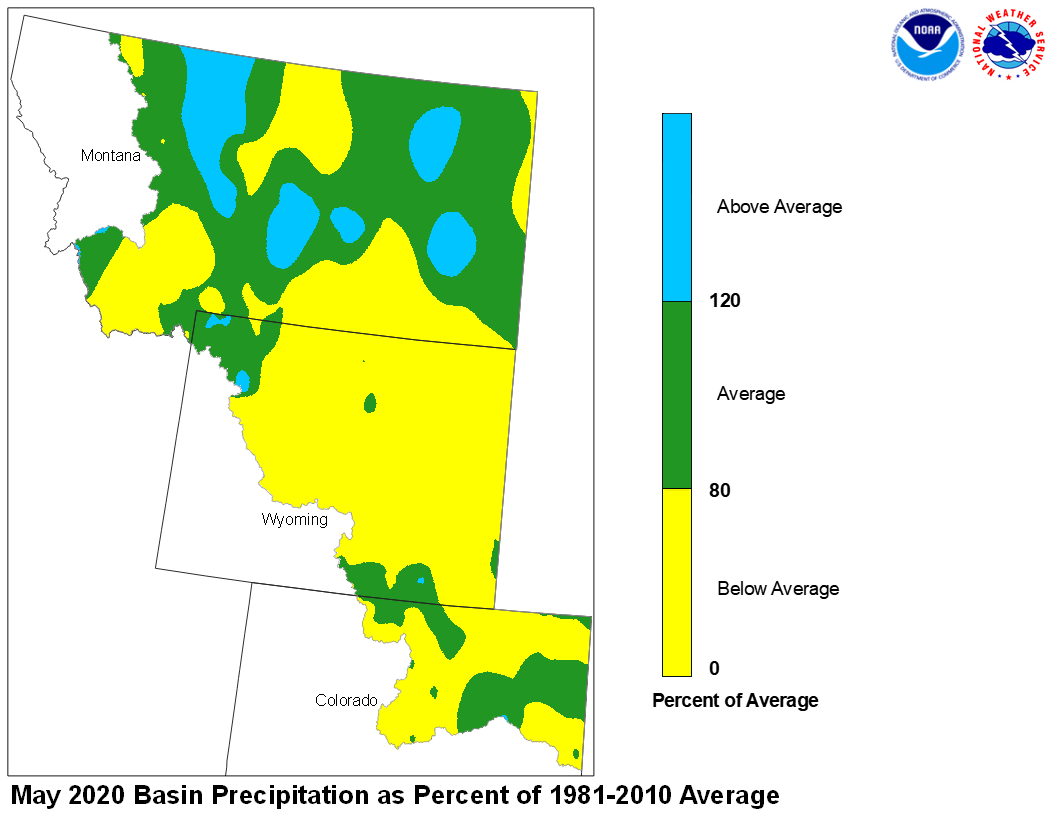
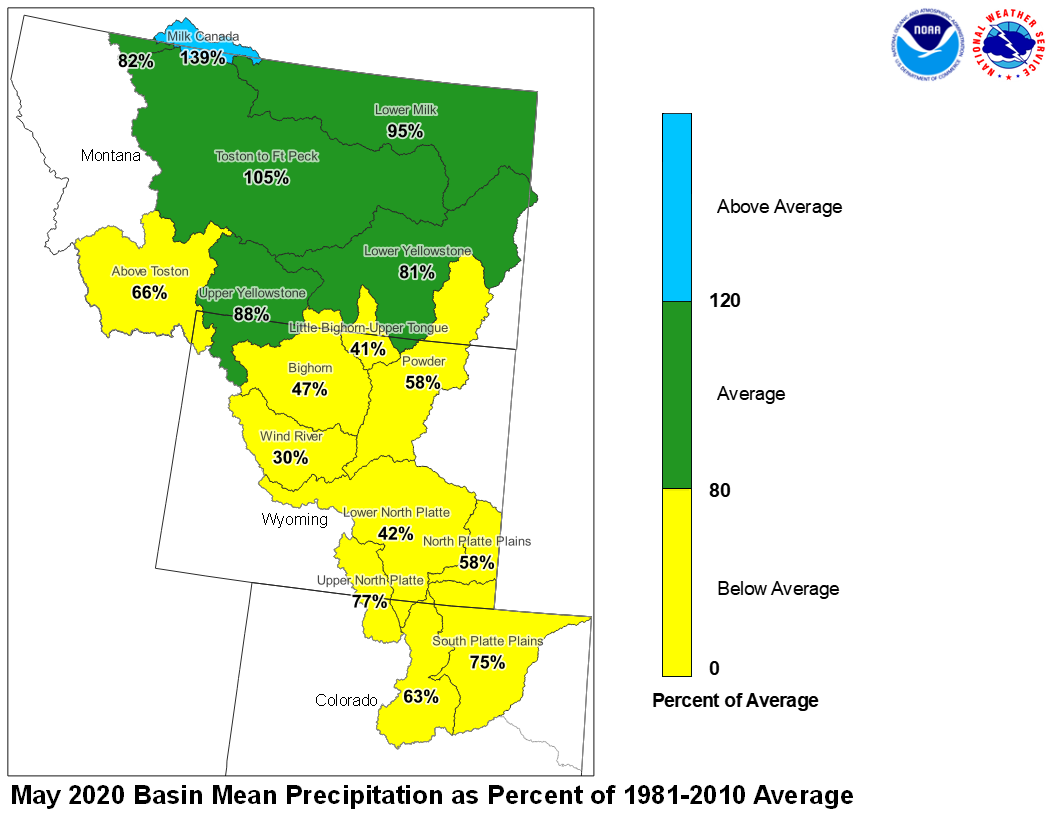
May precipitation across the Upper Missouri Basin was near to above average. Basin precipitation summaries for the Missouri Basin include: Milk St. Mary, 82 percent; Milk Canada, 139 percent; Lower Milk, 95 percent; above Toston, 66 percent; Toston to Ft. Peck, 105 percent.
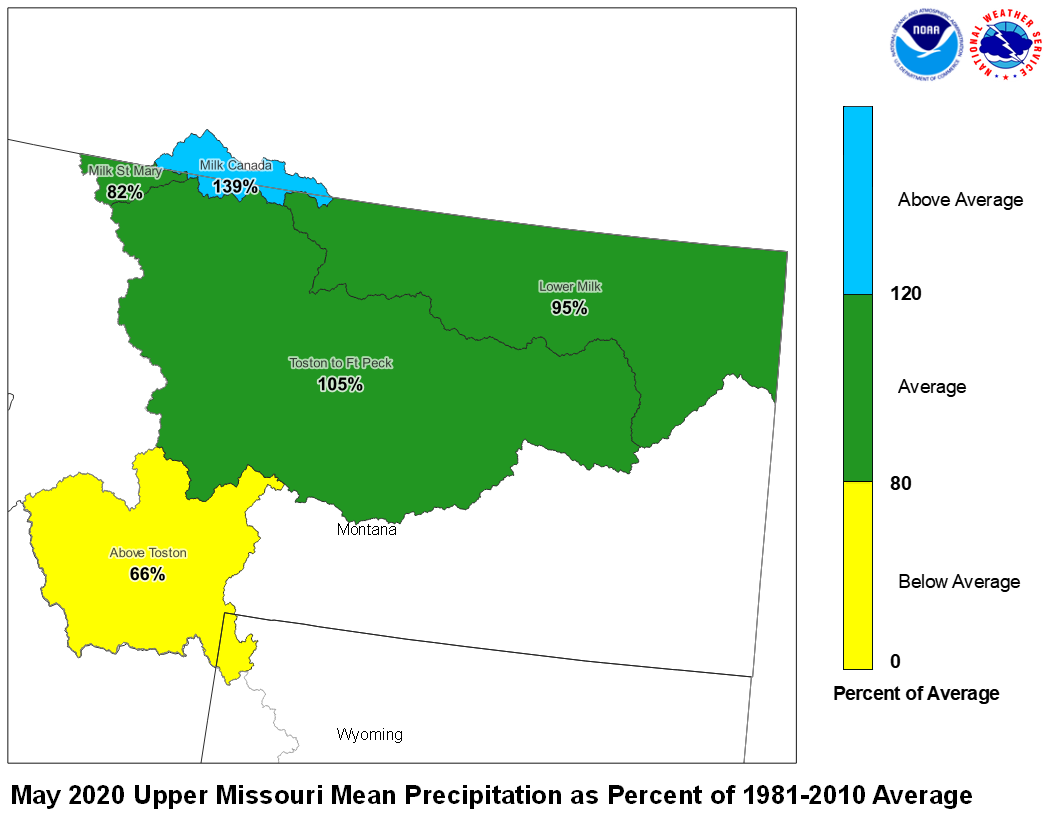
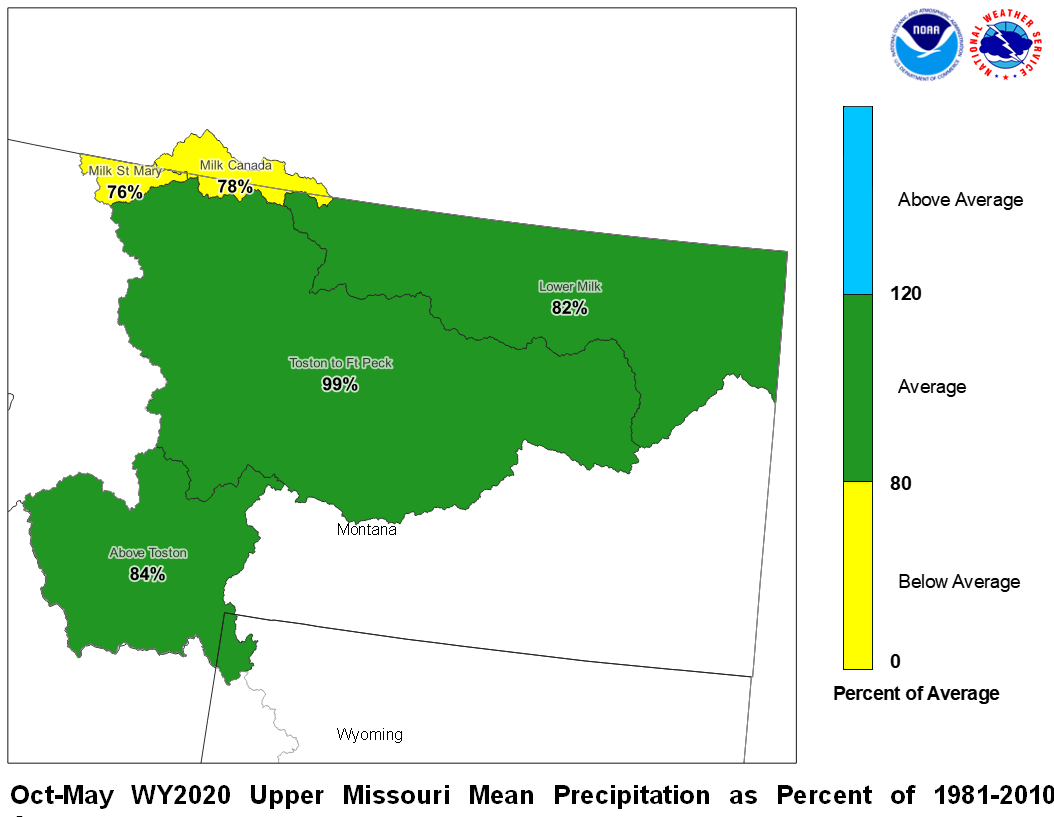
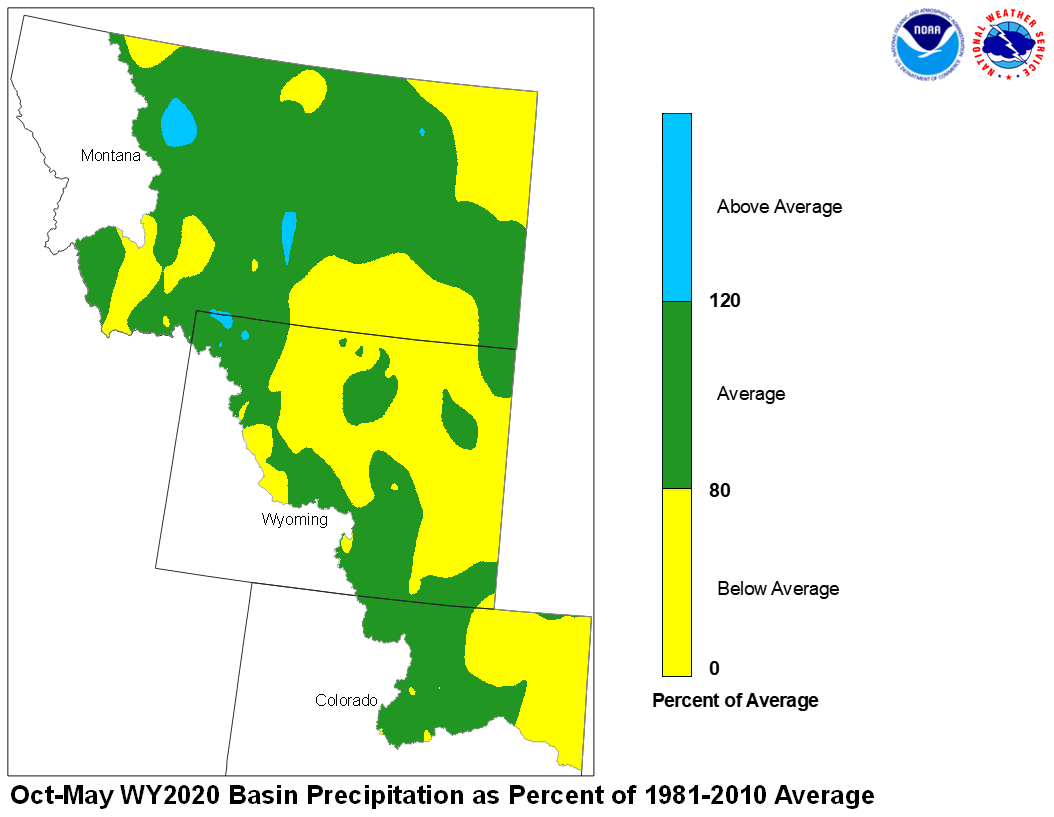
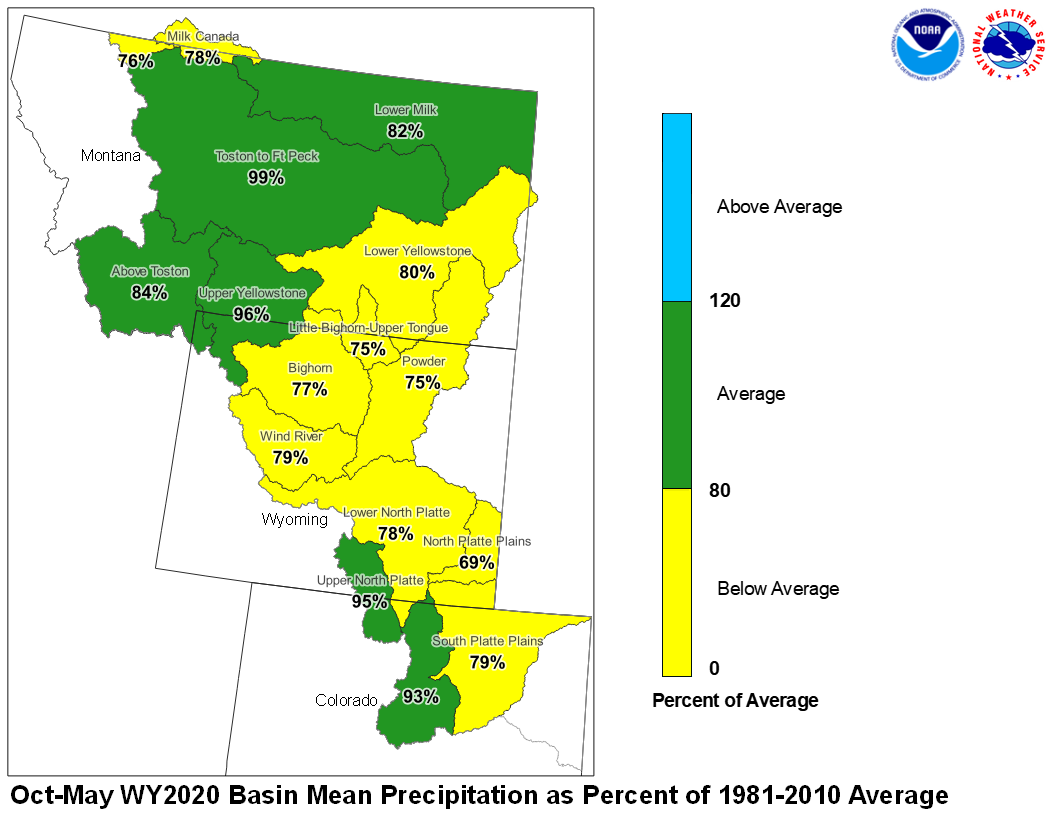
May 2020 Upper Missouri Mean Precip Oct-May WY2020 Upper Missouri Mean Precip
Stream flow in the Upper Missouri Basin is forecast to be above average during the upcoming Spring and Summer. The St. Mary River is forecast to have 128 percent of average June-September flows. Runoff is expected to range around 135 percent of average for the Missouri Basin above Fort Peck, Montana.
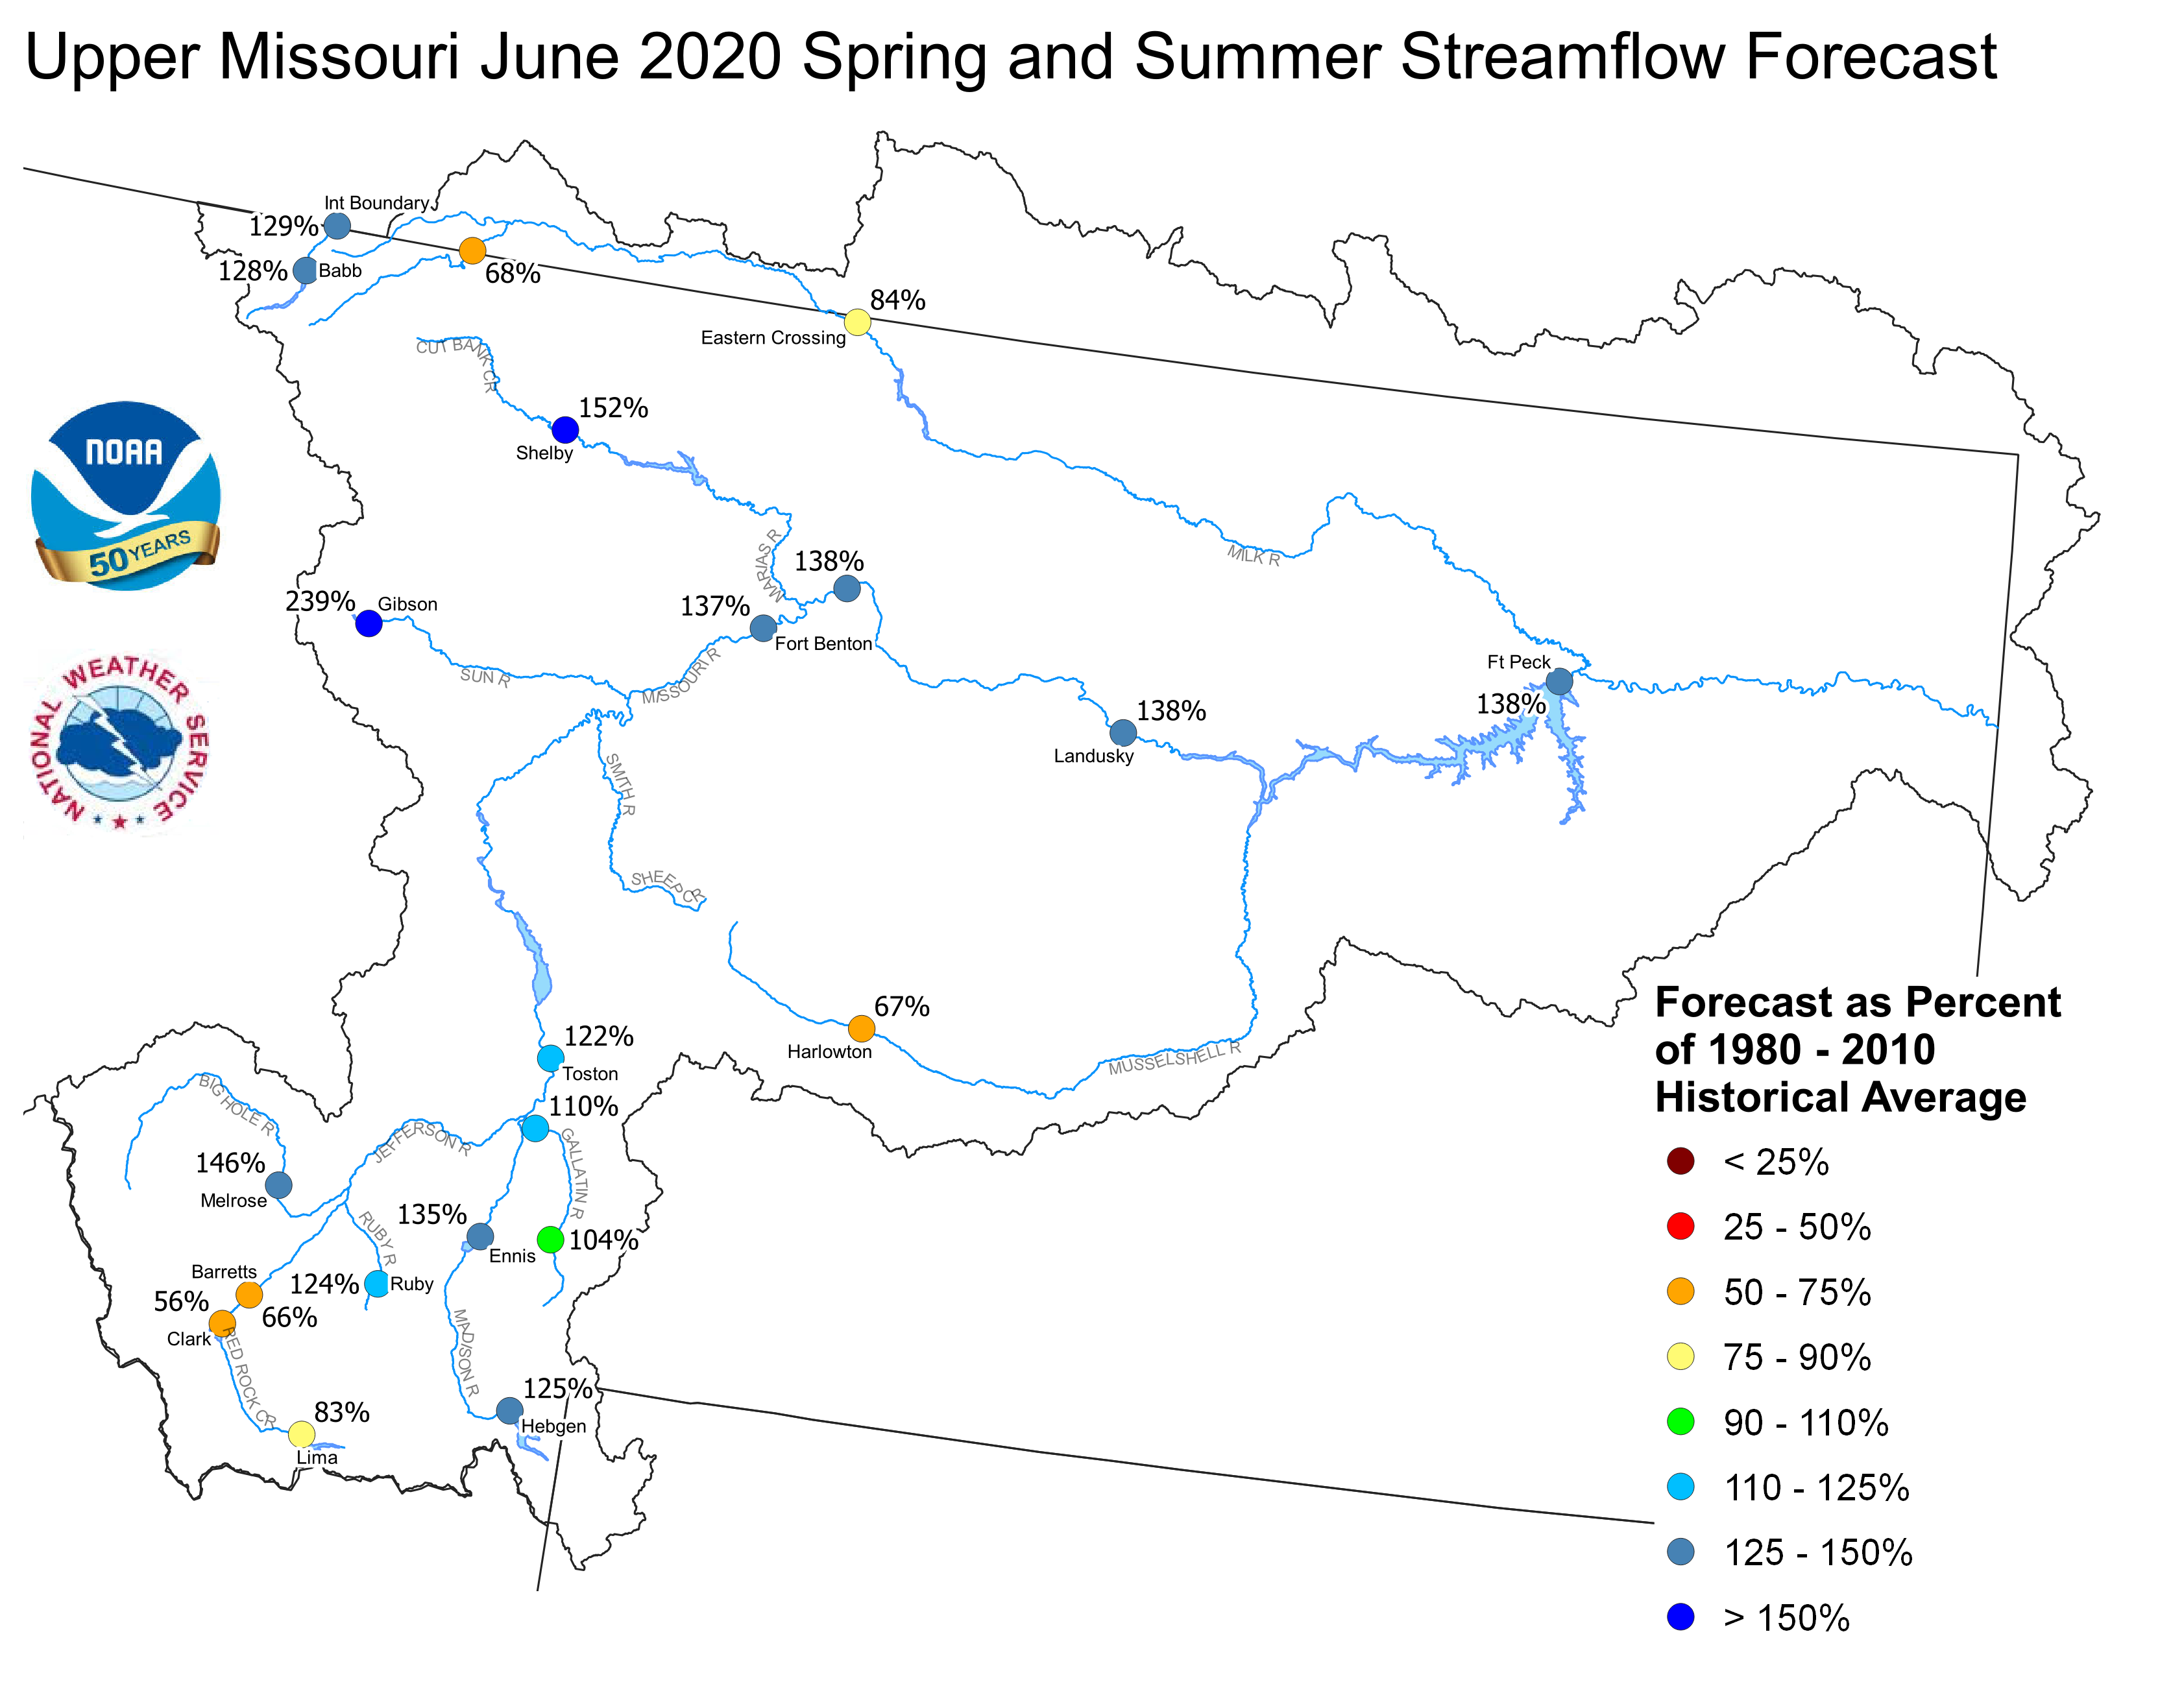
Upper Missouri June 1, 2020 Spring and Summer Streamflow Forecasts
Of the four major irrigation reservoirs in Montana; Lima Reservoir had 117 percent average storage, Clark Canyon was holding 109 percent of average water, Gibson Reservoir had 101 percent of average stored water, and Fresno Reservoir had 121 percent of average stored water.
The major hydroelectric reservoirs in Montana (Canyon Ferry and Fort Peck), had monthend storage in the average to above average range; 99 and 119 percent of average water, respectively.
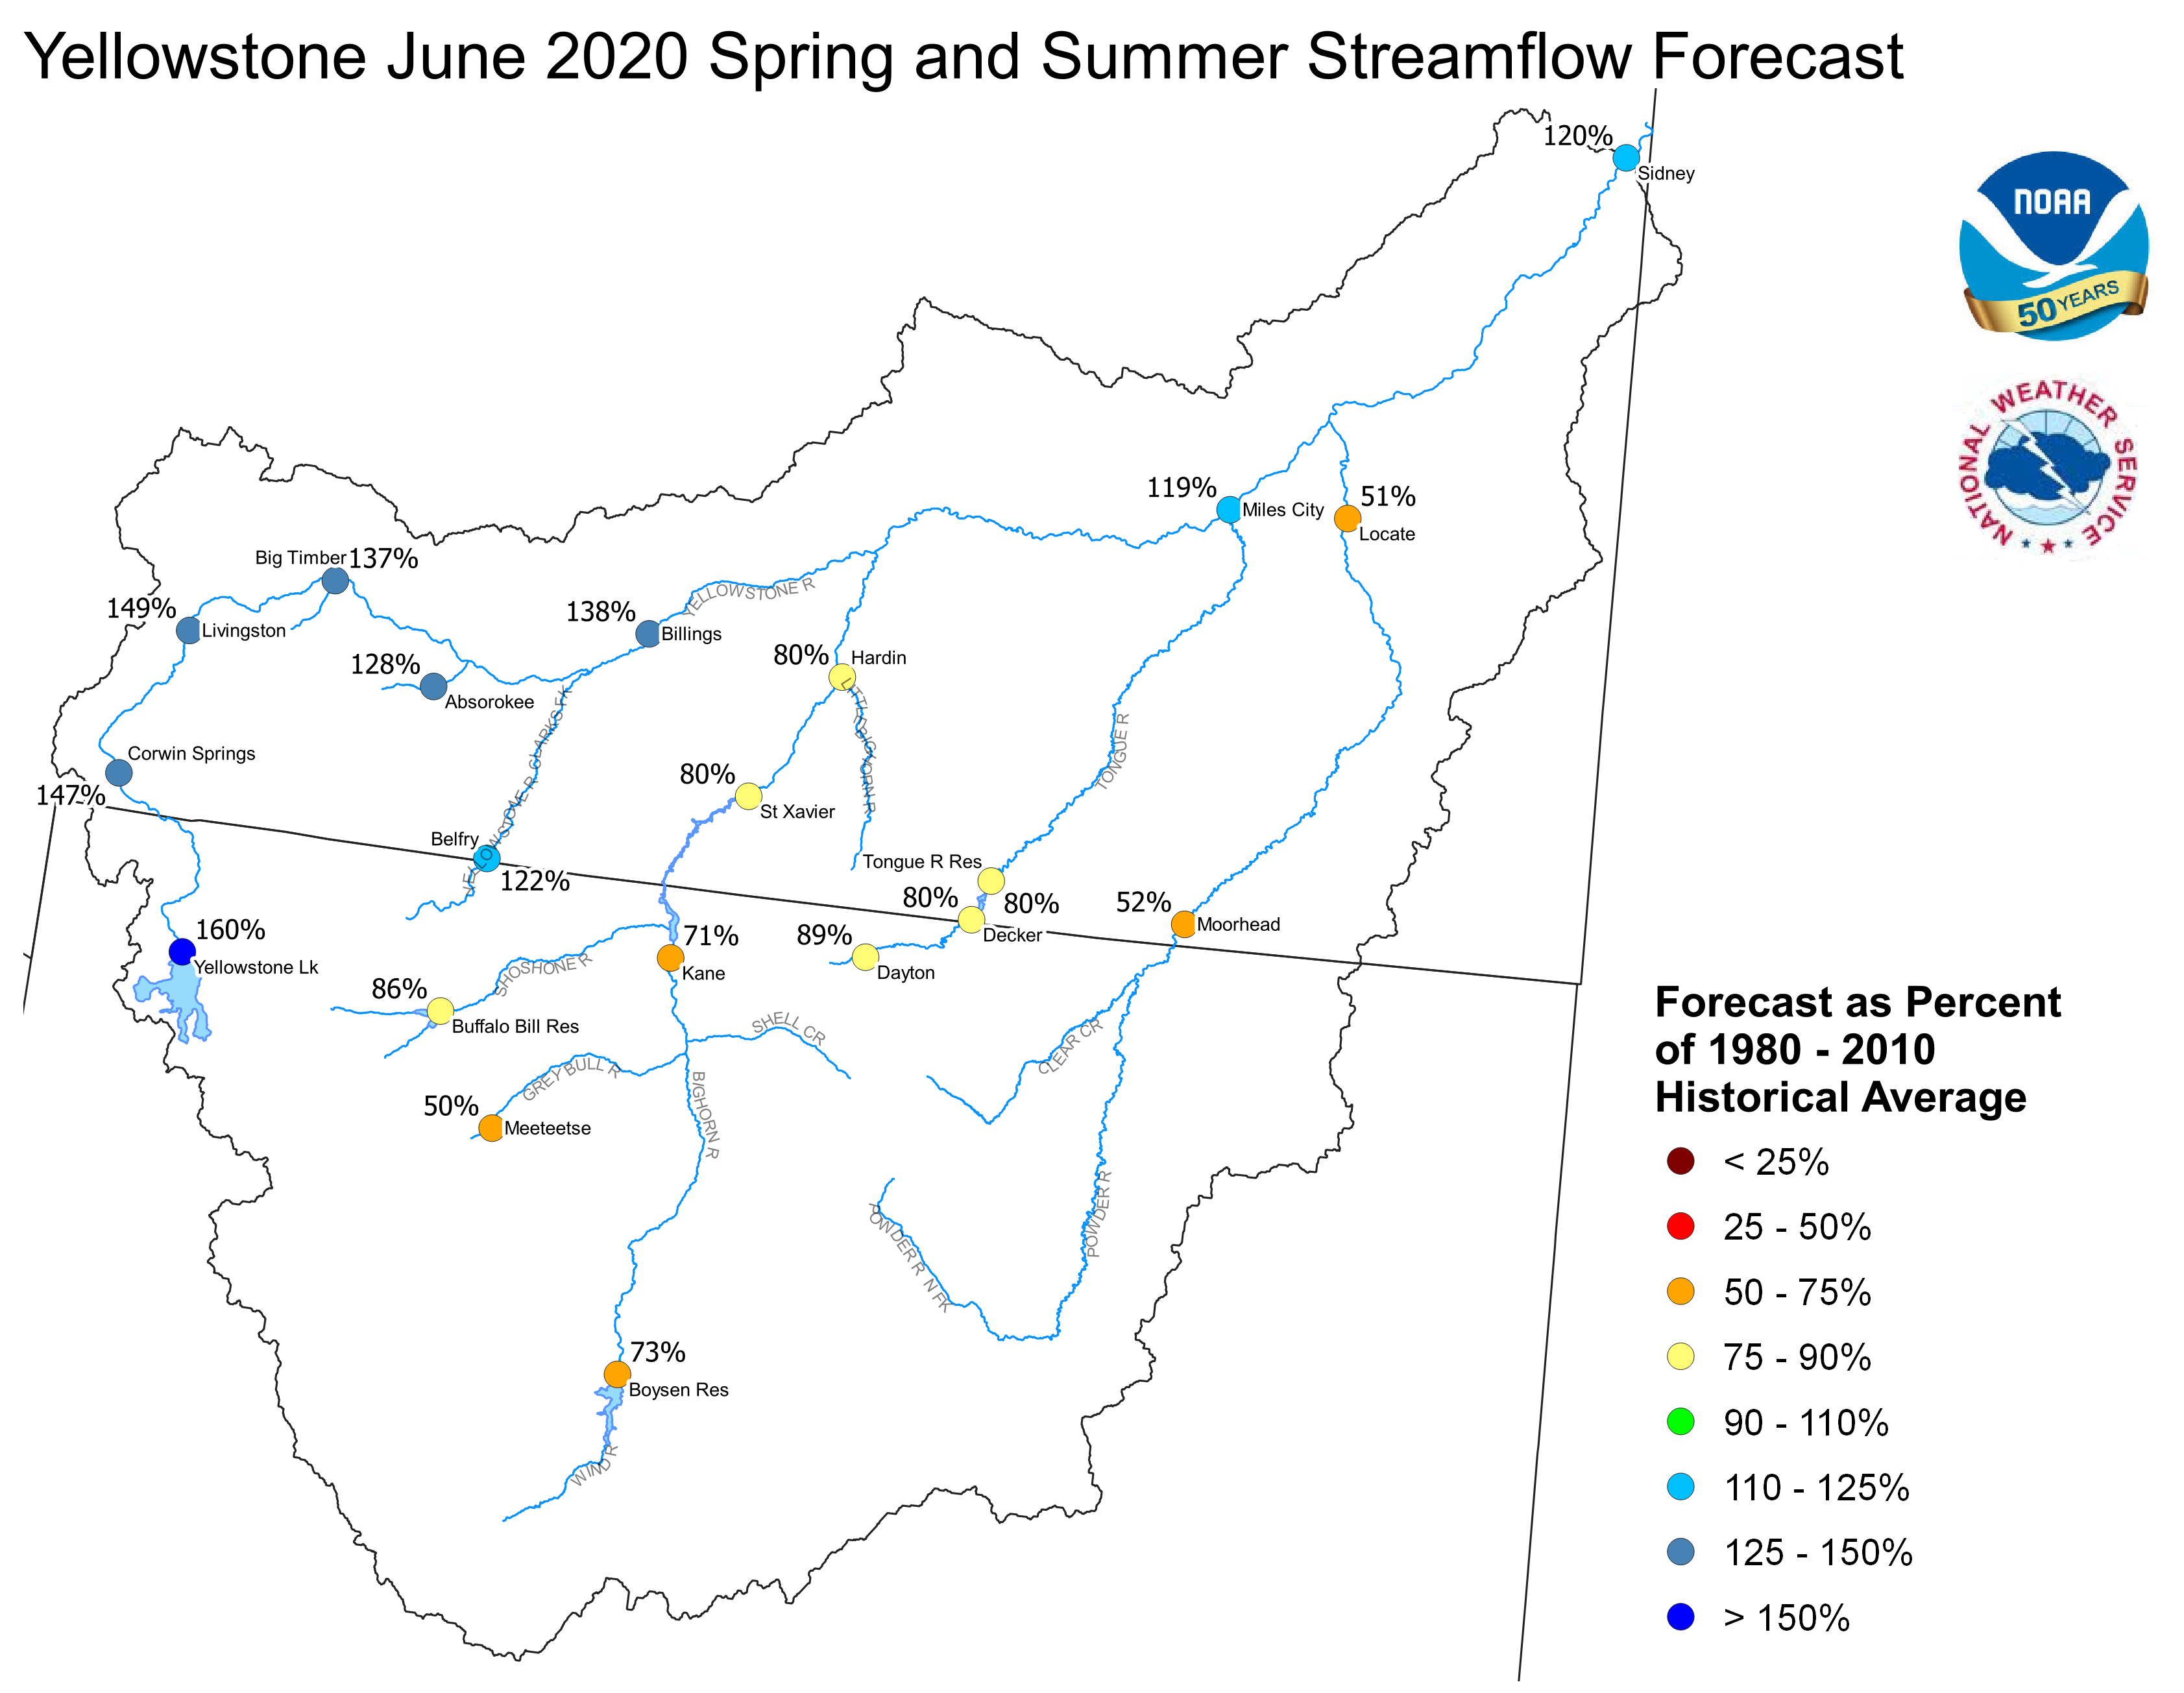
Yellowstone Basin
The high elevation snow pack in the Yellowstone Basin was near to below average on June 1. The snow pack in the Upper Yellowstone Basin was 96 percent of average. The snow packs in the Wind, Bighorn, and Shoshone Basins were 79, 78, and 88 percent of average, respectively. The snow packs in the Tongue and Powder basins were 80 and 78 percent of average, respectively.
Precipitation during May was below average. The upper Yellowstone River Basin received 88 percent of average precipitation while the Lower Yellowstone River Basin reported 81 percent of average. The Bighorn Basin received 47 percent of average precipitation while the Wind River Basin received 30 percent of average. The Little Bighorn - Upper Tongue Basin received 41 percent of average and the Powder River had 68 percent of average precipitation.


May 2020 Yellowstone Mean Precip Oct-May WY2020 Yellowstone Mean Precip
Forecast stream flow in the Yellowstone Basin is near average for the upcoming Spring and Summer. Stream flow for the Yellowstone River above Sidney, Montana is forecast to be about 120 percent of average. Flow in the Tongue Basin is expected to be 80 percent of average. Flows in the Powder River are expected to be about 72 percent of average.
Monthend storage at Boysen Reservoir was 98 percent of average. Stored water in Buffalo Bill Reservoir was 126 percent of average. Monthend storage was 96 percent of average at Bighorn Reservoir.
Yellowstone June 1, 2020 Spring and Summer Streamflow Forecasts
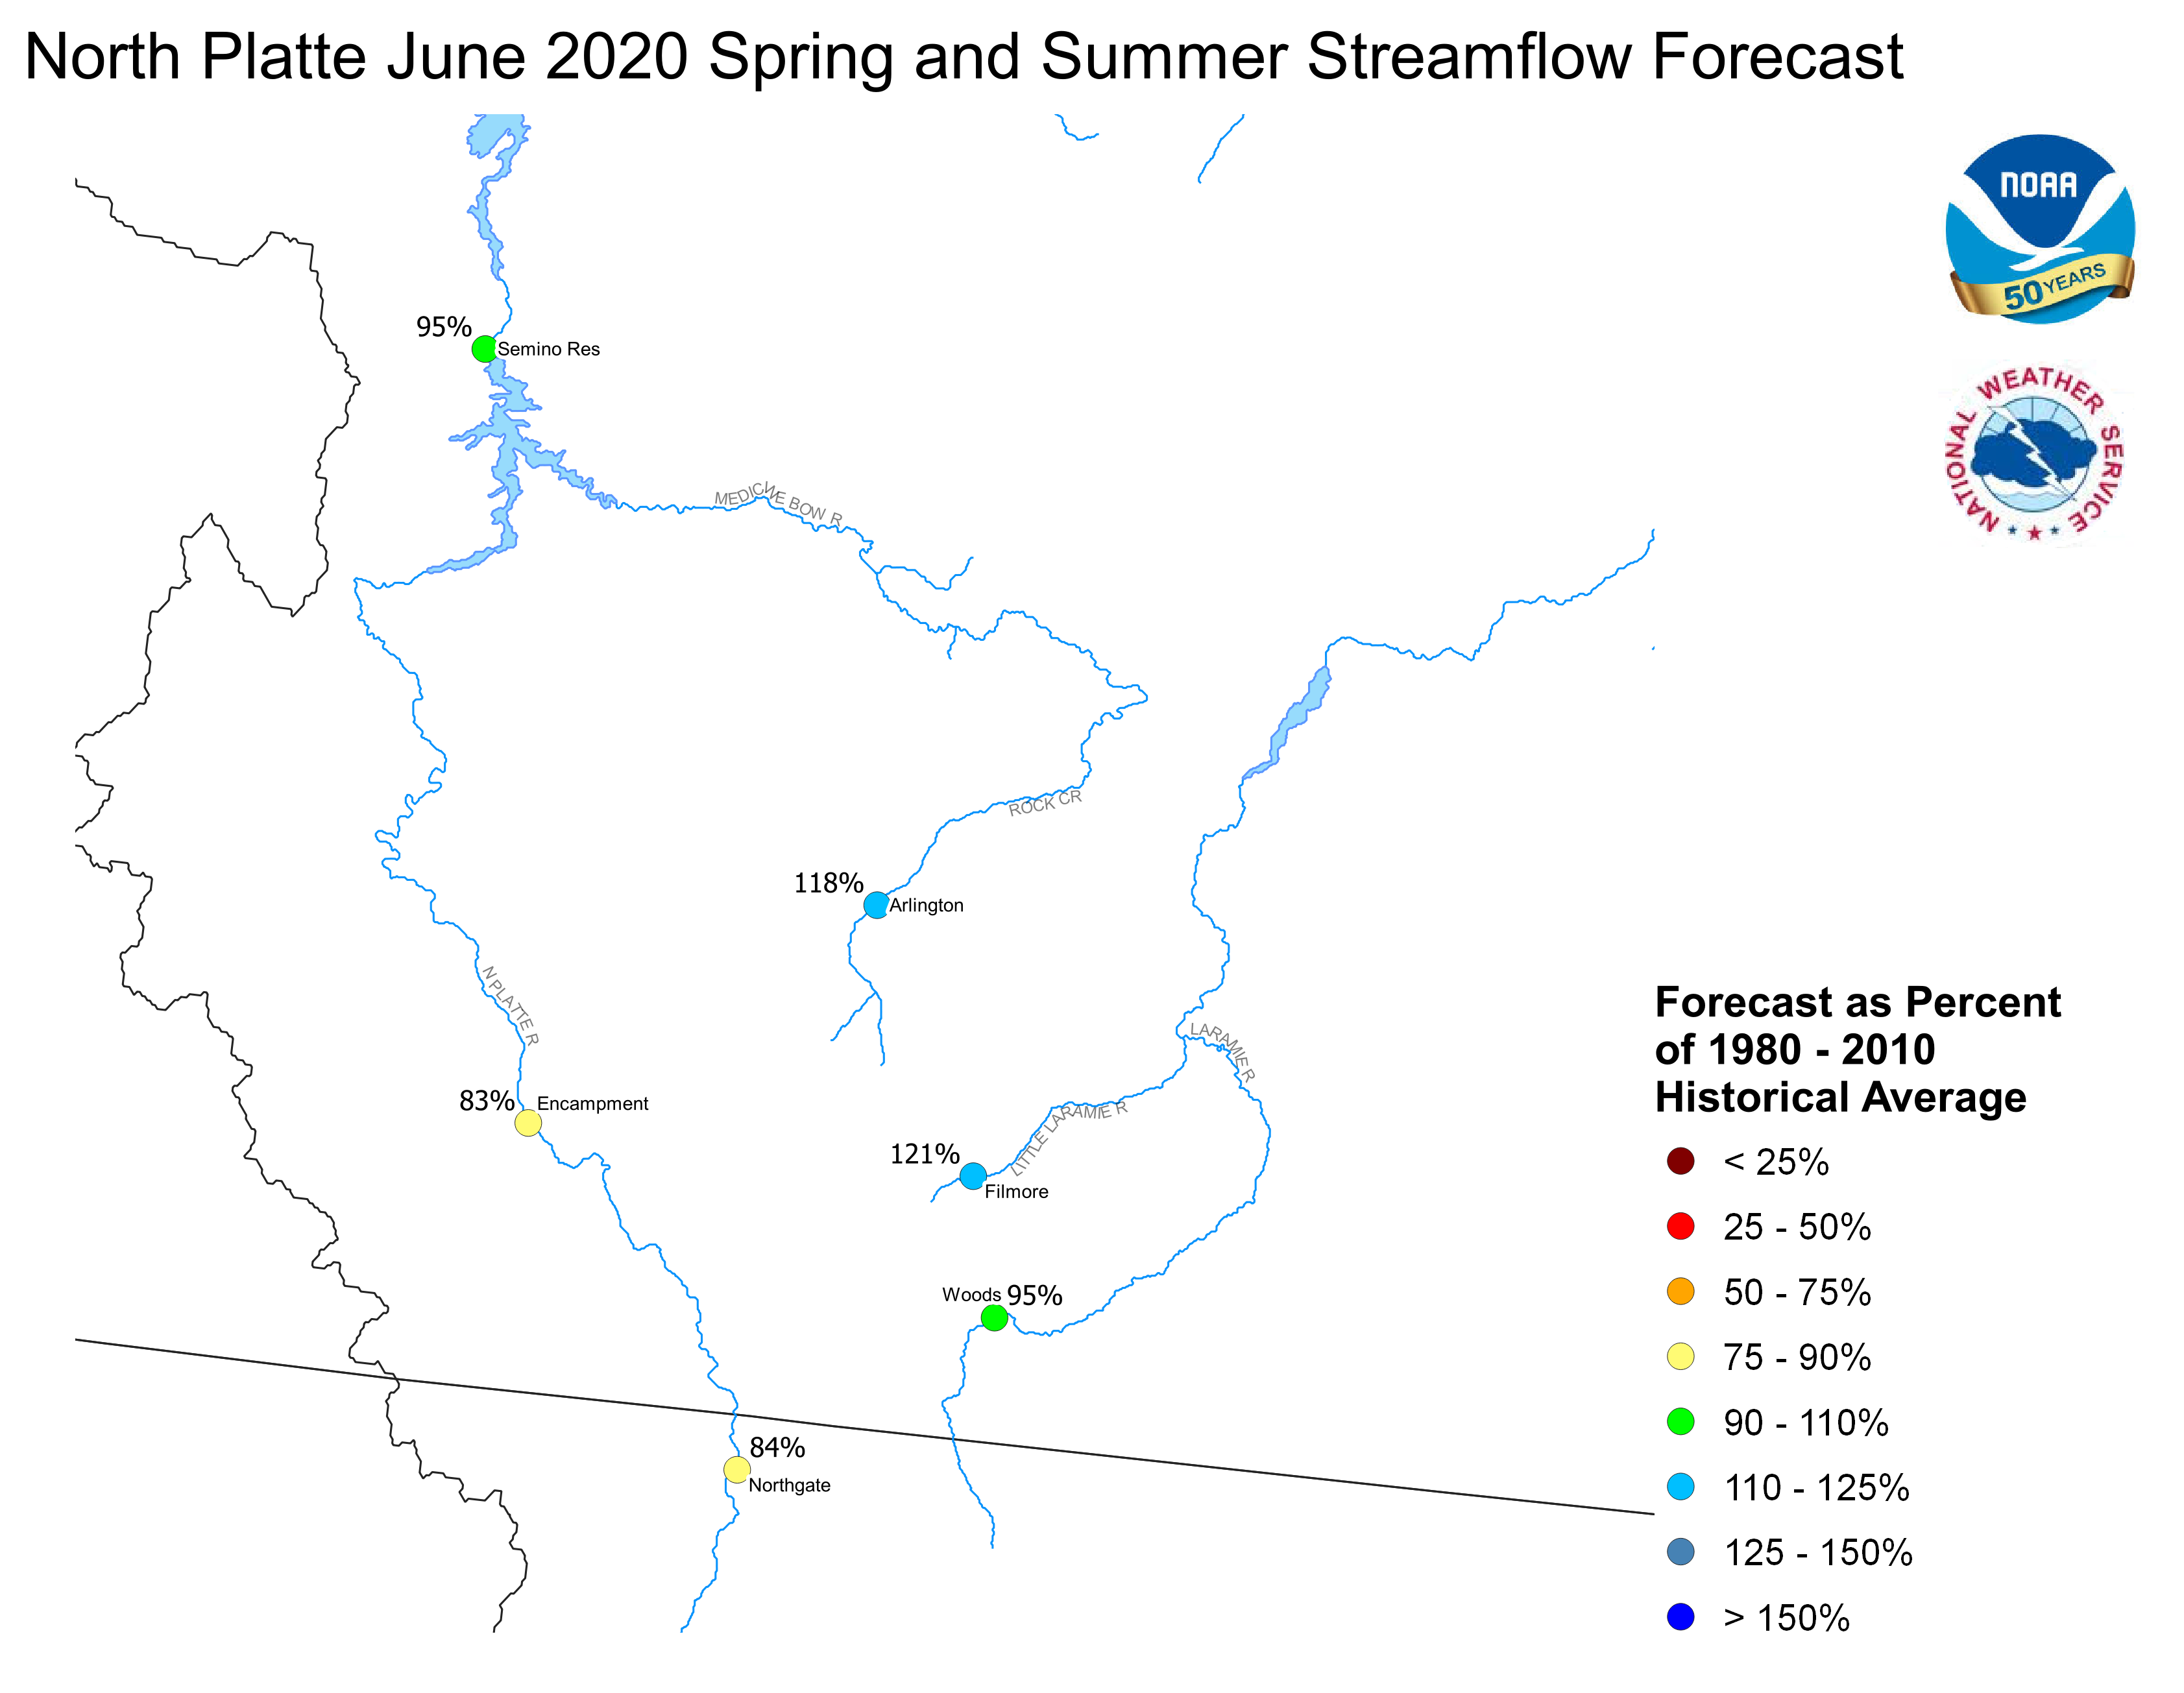
Platte Basin
The high elevation snow pack in the Upper North Platte Basin was 83 percent of average on June 1. The snow pack in the North Platte Basin below Seminoe Reservoir was 78 percent of average. The snow pack in the South Platte Basin was 60 percent of average.
Precipitation during May in the Upper North Platte Basin was 77 percent of average. In the Lower North Platte Basin, precipitation was 42 percent of average. The North Platte Plains below Guernsy Reservoir had 58 percent. The South Platte Mountains had 63 percent whereas the Plains had 75 percent of average May precipitation.
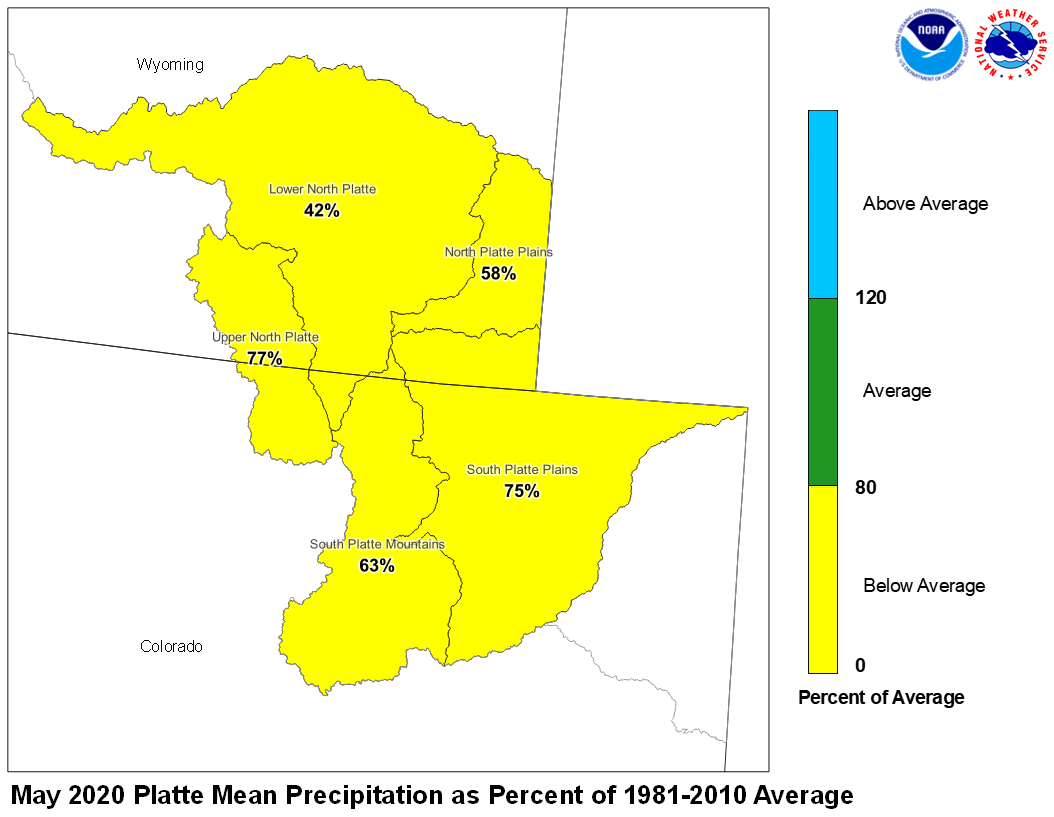
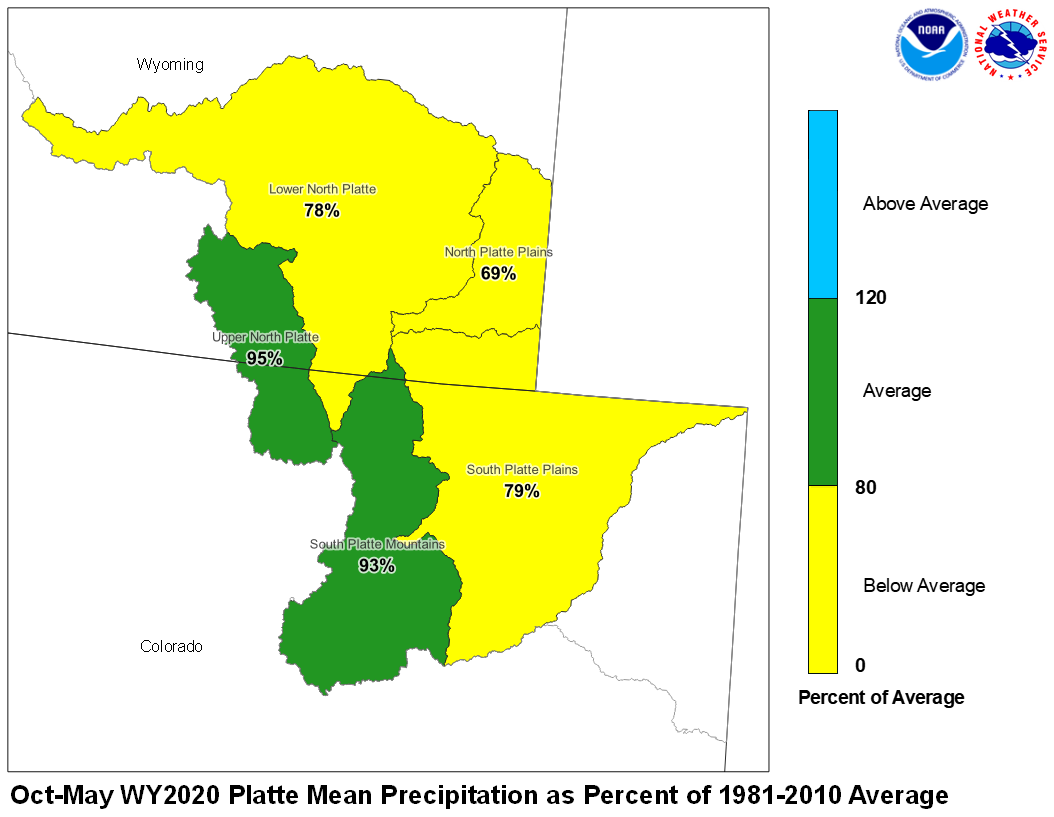
May 2020 Platte Mean Precip Oct-May WY2020 Platte Mean Precip
Stream flow in the Platte Basin is forecast to be near to below average during the upcoming Spring and Summer. Runoff for streams above Seminoe Reservoir are expected to be about 95 percent of average. Streams in the South Platte Basin above South Platte, Colorado can expect 54 percent of average flow. For the remainder of the South Platte basin, flows are expected near 48 percent.
Stored water in the South Platte Basin was 106 percent of average on June 1.
North Platte Streamflow Fcst South Platte Streamflow Fcst
000
FGUS63 KKRF 041916
ESPKRF
WATER SUPPLY FORECAST
NWS MISSOURI BASIN RIVER FORECAST CENTER
PLEASANT HILL MISSOURI

1402 CDT THURSDAY JUNE 04, 2020

DATA CURRENT AS OF: JUNE 01, 2020

MISSOURI/YELLOWSTONE/PLATTE RIVER BASIN FORECASTS


                                         50%    %   10%    90%   AVG
FORECAST POINT                  PERIOD  (KAF)  AVG (KAF)  (KAF) (KAF)
---------------------------------------------------------------------

SBDW4N                          JUN-SEP  530   73   669    480   722
BOYSEN RESERVOIR INFLOW

LVEW4N                          JUN-SEP  798   71   978    727   1119
BIGHORN R AT KANE

MEEW4N                          JUN-SEP  94    50   121    82    190
GREYBULL R NR MEETEETSE

CDYW4N                          JUN-SEP  426   86   520    379   496
BUFFALO BILL RESERVOIR INFLOW

SMYM8N                          JUN-SEP  352   128  392    305   274
ST MARY R NR BABB

SMBM8N                          JUN-SEP  403   129  456    348   313
ST MARY R NR INT BOUNDARY

PDBM8N                          JUN-SEP  13    68   38     9     19
MILK R NR WESTERN CROSSING

ERNM8N                          JUN-SEP  28    84   97     21    33
MILK R AT EASTERN CROSSING

NGTC2                           JUN-SEP  158   84   184    136   187
NORTH PLATTE R NR NORTHGATE

ECRW4                           JUN-SEP  76    81   86     71    93
ENCAMPMENT R NR ENCAMPMENT

ECRW4N                          JUN-SEP  81    83   92     77    98
ENCAMPMENT R NR ENCAMPMENT

KCRW4                           JUN-SEP  38    117  45     37    33
ROCK CR NR ARLINGTON

KCRW4N                          JUN-SEP  39    118  45     37    33
ROCK CR NR ARLINGTON

SETW4                           JUN-SEP  409   88   507    372   463
SEMINOE RESERVOIR INFLOW WY

SETW4N                          JUN-SEP  530   95   621    493   560
SEMINOE RESERVOIR INFLOW WY

WODW4                           JUN-SEP  26    93   40     22    28
LARAMIE R NR WOODS

WODW4N                          JUN-SEP  50    95   63     46    53
LARAMIE R NR WOODS

SMTW4                           JUN-SEP  36    122  46     34    30
LITTLE LARAMIE R NR FILMORE

SMTW4N                          JUN-SEP  38    121  48     36    32
LITTLE LARAMIE R NR FILMORE

ANRC2N                          JUN-SEP  6     57   9      5     10
ANTERO RESERVOIR INFLOW

SPYC2N                          JUN-SEP  18    49   29     14    37
SPINNEY MOUNTAIN RES INFLOW

EVNC2N                          JUN-SEP  20    49   35     16    41
ELEVENMILE CANYON RES INFLOW

CHEC2N                          JUN-SEP  37    51   60     30    72
CHEESMAN LAKE INFLOW

SPTC2N                          JUN-SEP  69    54   103    54    128
SOUTH PLATTE R AT SOUTH PLATTE

MRRC2N                          JUN-SEP  4     33   5      3     11
BEAR CK AT MORRISON

GLDC2N                          JUN-SEP  55    63   58     52    87
CLEAR CK AT GOLDEN

LNSC2N                          JUN-SEP  41    64   48     36    64
ST VRAIN CK AT LYONS

OROC2N                          JUN-SEP  23    76   27     21    31
BOULDER CK NR ORODELL

BELC2N                          JUN-SEP  11    49   13     10    22
S BOULDER CK NR ELDORADO SPR

FTDC2N                          JUN-SEP  118   83   134    106   142
CACHE LA POUDRE AT CANYON MOUTH

LRRM8N                          JUN-SEP  23    83   30     18    28
LIMA RESERVOIR INFO

CLKM8N                          JUN-SEP  41    56   54     33    74
CLARK CANYON RESERVOIR INFLOW

BARM8N                          JUN-SEP  61    66   76     51    93
BEAVERHEAD R AT BARRETTS

ALRM8N                          JUN-SEP  62    124  73     56    50
RUBY R RESERVOIR INFLOW

MLRM8                           JUN-SEP  383   151  471    326   253
BIG HOLE R NR MELROSE

MLRM8N                          JUN-SEP  425   146  515    369   291
BIG HOLE R NR MELROSE

HBDM8N                          JUN-SEP  272   125  291    246   218
HEBGEN RESERVOIR INFFLOW

ELMM8N                          JUN-SEP  508   135  566    452   378
ENNIS RESERVOIR INFLOW

GLGM8                           JUN-SEP  285   105  385    234   271
GALLATIN R NR GATEWAY

GLGM8N                          JUN-SEP  282   104  381    230   271
GALLATIN R NR GATEWAY

LOGM8                           JUN-SEP  284   112  425    206   253
GALLATIN R AT LOGAN

LOGM8N                          JUN-SEP  384   110  504    318   350
GALLATIN R AT LOGAN

TOSM8N                          JUN-SEP  1650  122  2039   1409  1357
MISSOURI R AT TOSTON

FBNM8N                          JUN-SEP  2758  137  3247   2467  2017
MISSOURI R AT FORT BENTON

VRGM8N                          JUN-SEP  3231  138  3733   2866  2337
MISSOURI R NR VIRGELLE

LDKM8N                          JUN-SEP  3400  138  3910   3025  2469
MISSOURI R NR LANDUSKY

FPKM8N                          JUN-SEP  3651  138  4194   3268  2650
MISSOURI R BLW FT PECK DAM

AGSM8N                          JUN-SEP  399   239  456    367   167
GIBSON RESERVOIR INFLOW

SHLM8N                          JUN-SEP  276   152  363    252   182
MARIAS R NR SHELBY

HLWM8N                          JUN-SEP  36    67   53     30    53
MUSSELSHELL R AT HARLOWTON

YLOW4                           JUN-SEP  837   170  892    803   492
YELLOWSTONE R AT YELLOWSTONE LK

YLOW4N                          JUN-SEP  531   160  612    482   332
YELLOWSTONE R AT YELLOWSTONE LK

CORM8                           JUN-SEP  1498  164  1640   1408  915
YELLOWSTONE R AT CORWIN SPRINGS

CORM8N                          JUN-SEP  1288  147  1454   1185  878
YELLOWSTONE R AT CORWIN SPRINGS

LIVM8                           JUN-SEP  1751  166  1924   1639  1057
YELLOWSTONE R AT LIVINGSTON

LIVM8N                          JUN-SEP  1605  149  1805   1484  1081
YELLOWSTONE R AT LIVINGSTON

BILM8                           JUN-SEP  3414  176  3776   3142  1944
YELLOWSTONE R AT BILLINGS

BILM8N                          JUN-SEP  3401  138  3782   3138  2461
YELLOWSTONE R AT BILLINGS

MILM8N                          JUN-SEP  5311  119  5947   4904  4463
YELLOWSTONE R AT MILES CITY

SIDM8N                          JUN-SEP  5601  120  6287   5195  4666
YELLOWSTONE R AT SIDNEY

BTMM8                           JUN-SEP  268   146  305    242   184
BOULDER R AT BIG TIMBER

BTMM8N                          JUN-SEP  304   137  341    279   222
BOULDER R AT BIG TIMBER

SRAM8                           JUN-SEP  519   147  581    460   354
STILLWATER R NR ABSAROKEE

SRAM8N                          JUN-SEP  521   128  584    464   406
STILLWATER R NR ABSAROKEE

BFYM8                           JUN-SEP  409   127  467    369   323
CLARKS FK YELWSTONE R NR BELFRY

BFYM8N                          JUN-SEP  473   122  530    436   388
CLARKS FK YELWSTONE R NR BELFRY

STXM8N                          JUN-SEP  1357  80   1612   1235  1707
BIGHORN R NR ST XAVIER

HRDM8N                          JUN-SEP  44    80   51     40    56
LITTLE BIGHORN R NR HARDIN

DAYW4N                          JUN-SEP  42    89   48     38    47
TONGUE R NR DAYTON

DSLM8N                          JUN-SEP  94    80   105    87    117
TONGUE R NR DECKER

DKRM8N                          JUN-SEP  94    80   106    87    118
TONGUE R RESERVOIR INFLOW

MHDM8N                          JUN-SEP  55    52   61     50    104
POWDER R NR MOORHEAD

LOCM8N                          JUN-SEP  64    51   74     59    126
POWDER R NR LOCATE


LOCATIONS WITH AN `N` SUFFIX INDICATE NATURAL FLOWS EXCLUDING
STREAM AUGMENTATIONS

KAF: THOUSANDS OF ACRE-FEET

%AVG: CURRENT 50%/AVG

AVG: AVERAGE (50%) SEASONAL RUNOFF VOLUME AS SIMULATED BY THE RIVER
FORECAST MODEL CONSIDERING A CONTINUOUS SIMULATION OF THE BASIN
RESPONSE TO HISTORIC CLIMATE DATA (OBSERVED PRECIPITATION AND
TEMPERATURES) OVER THE PERIOD OF 1981-2010

THE 50%, 10% AND 90% COLUMNS INDICATE THE PROBABILITY THAT THE
ACTUAL VOLUME WILL EXCEED THE FORECAST FOR THE VALID TIME PERIOD

FOR MORE INFORMATION, PLEASE VISIT: WWW.WEATHER.GOV/MBRFC/WATER


$$

