May 1, 2021 Spring and Summer Streamflow Forecasts
Upper Missouri Basin
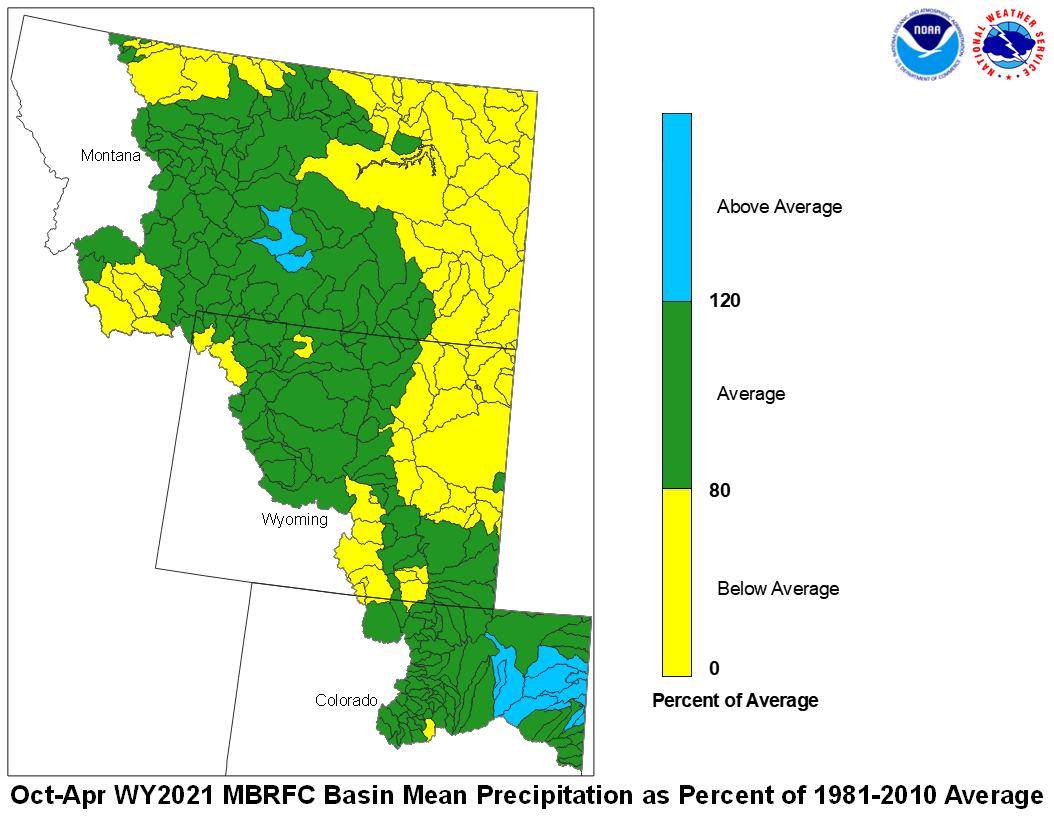
The high elevation snow pack in the Upper Missouri Basin as of May 1
was near average. The snow pack in the St. Mary Basin was 99 percent.
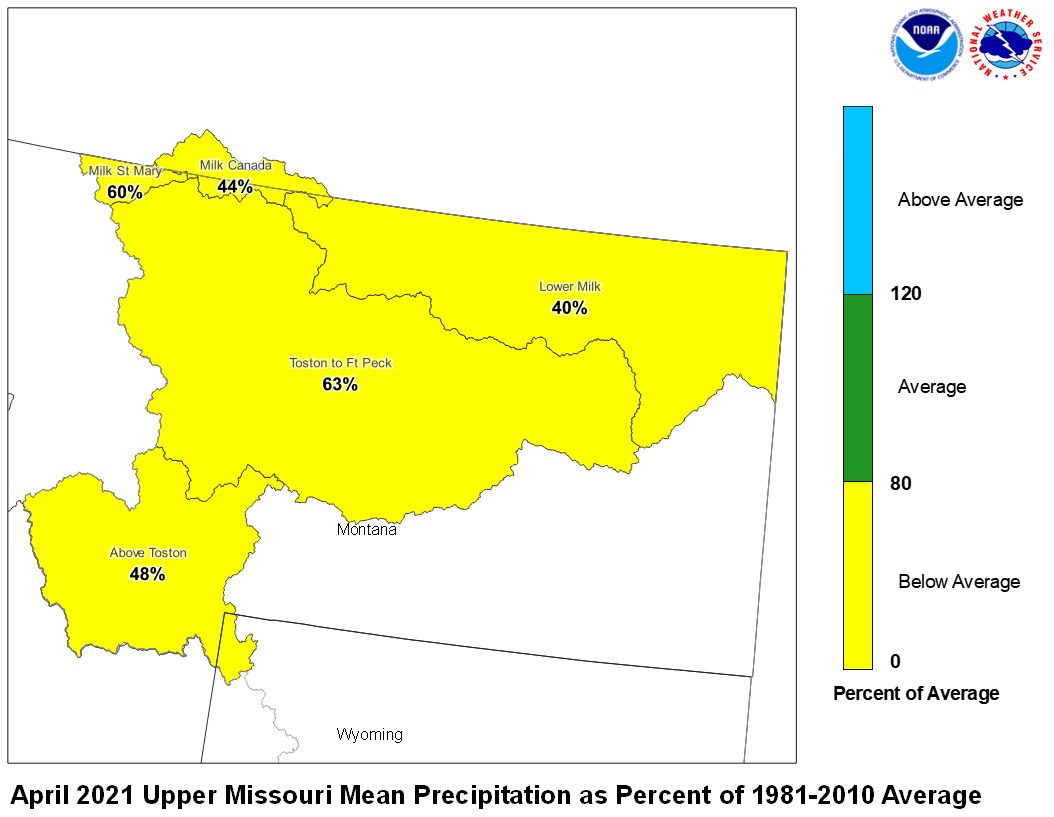
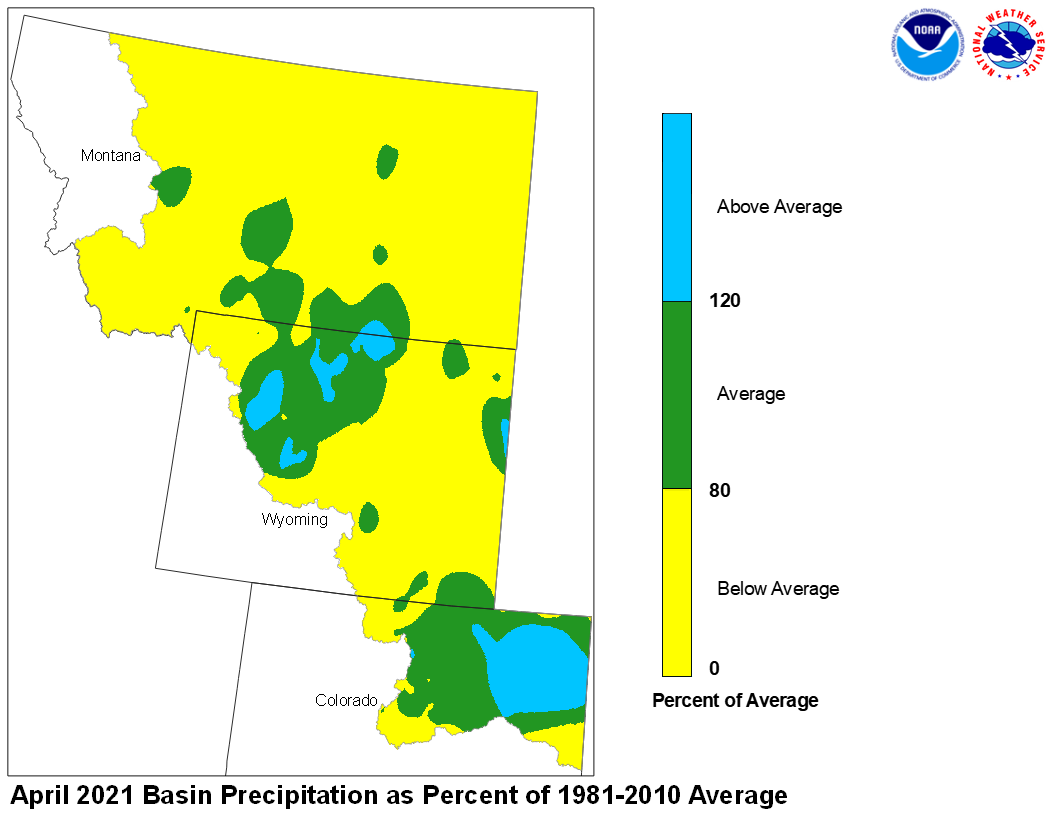
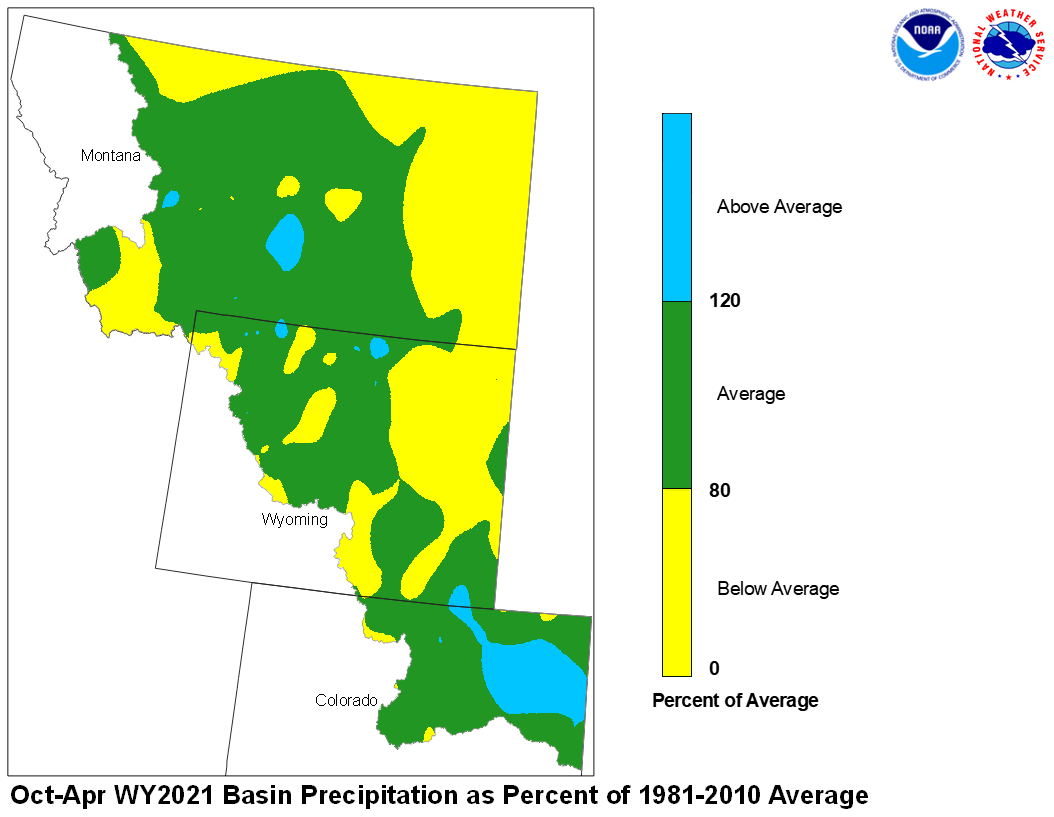
April precipitation across the Upper Missouri Basin was below average.
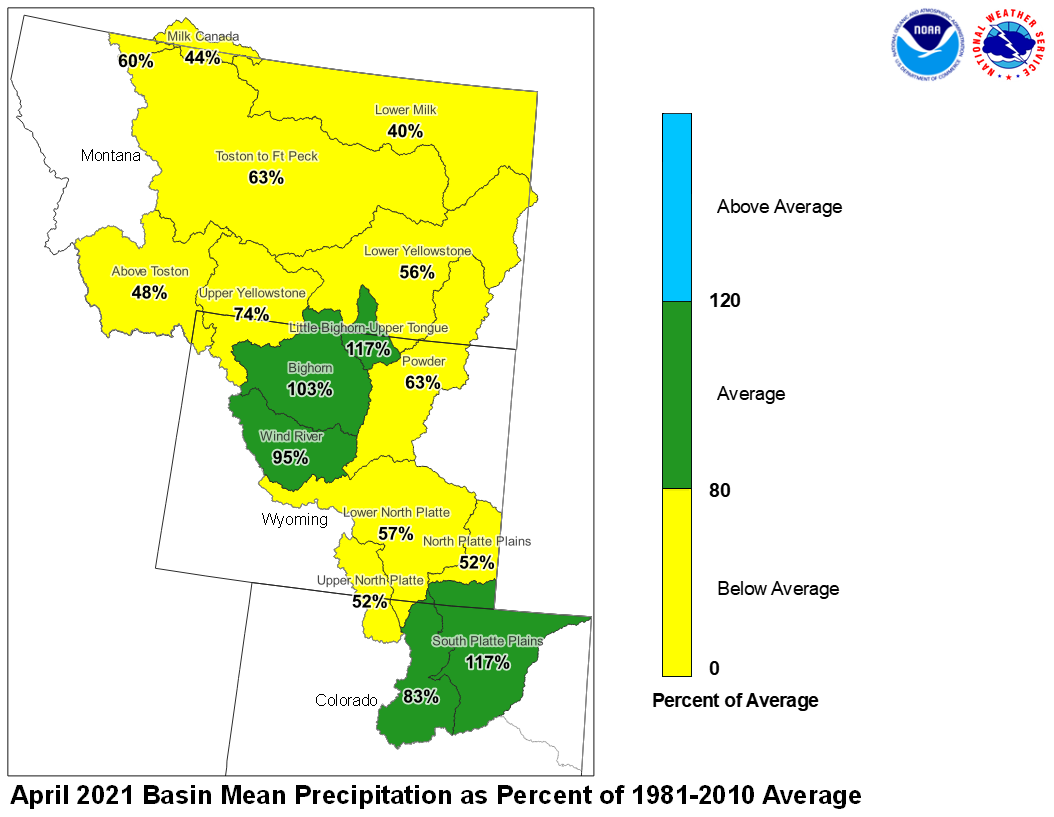
Basin precipitation sumapries for the Missouri Basin include: Milk St. Mary,
60 percent; Milk Canada, 44 percent; Lower Milk, 40 percent; above Toston,
48 percent; Toston to Ft. Peck, 63 percent.
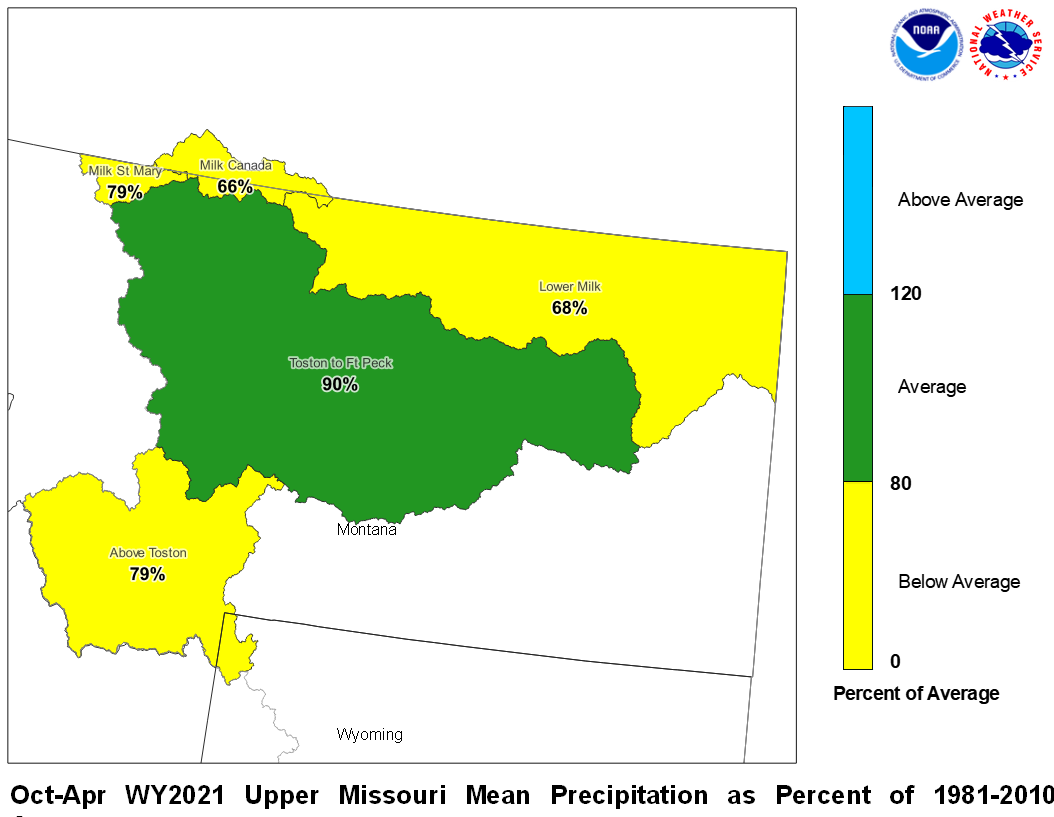
April 2021 Upper Missouri Mean Precip Oct-Apr WY2021 Upper Missouri Mean Precip
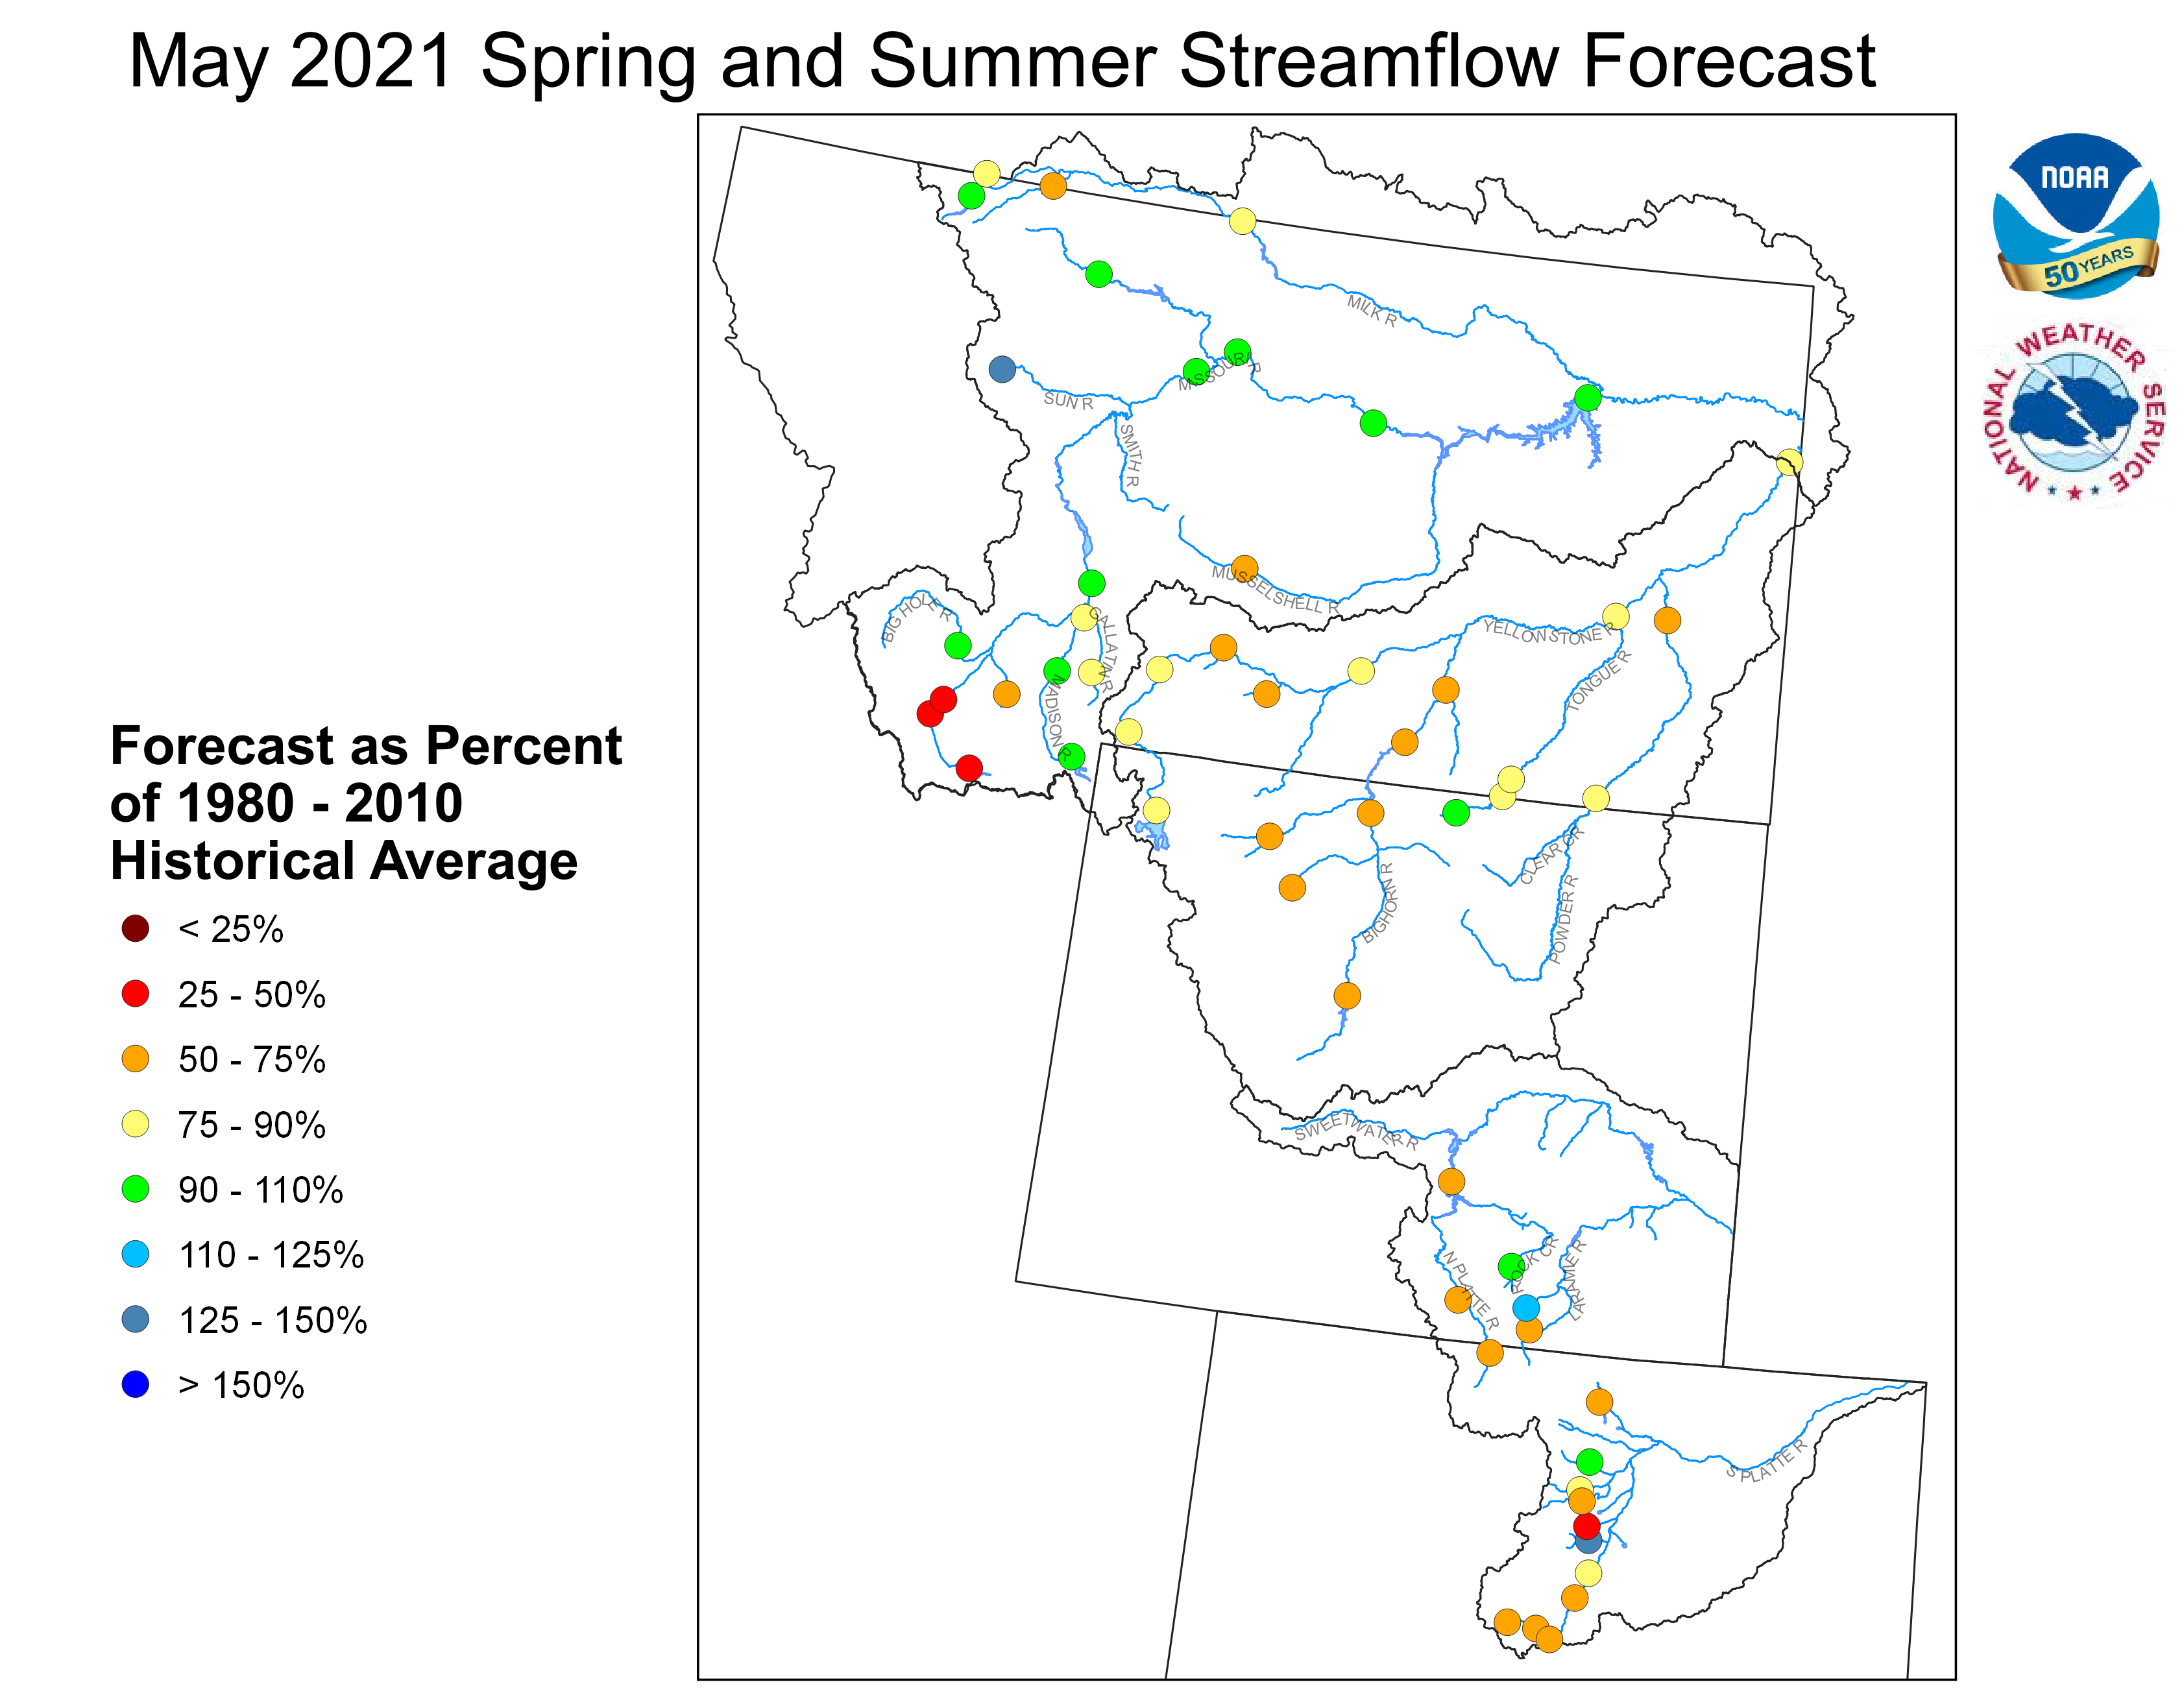
Stream flow in the Upper Missouri Basin is forecast to be
below average during the upcoming Spring and Summer.
The St. Mary River is forecast to have 92 percent of average
May-September flows. Runoff is expected to range around
93 percent of average for the Missouri Basin above Fort Peck,
Montana.
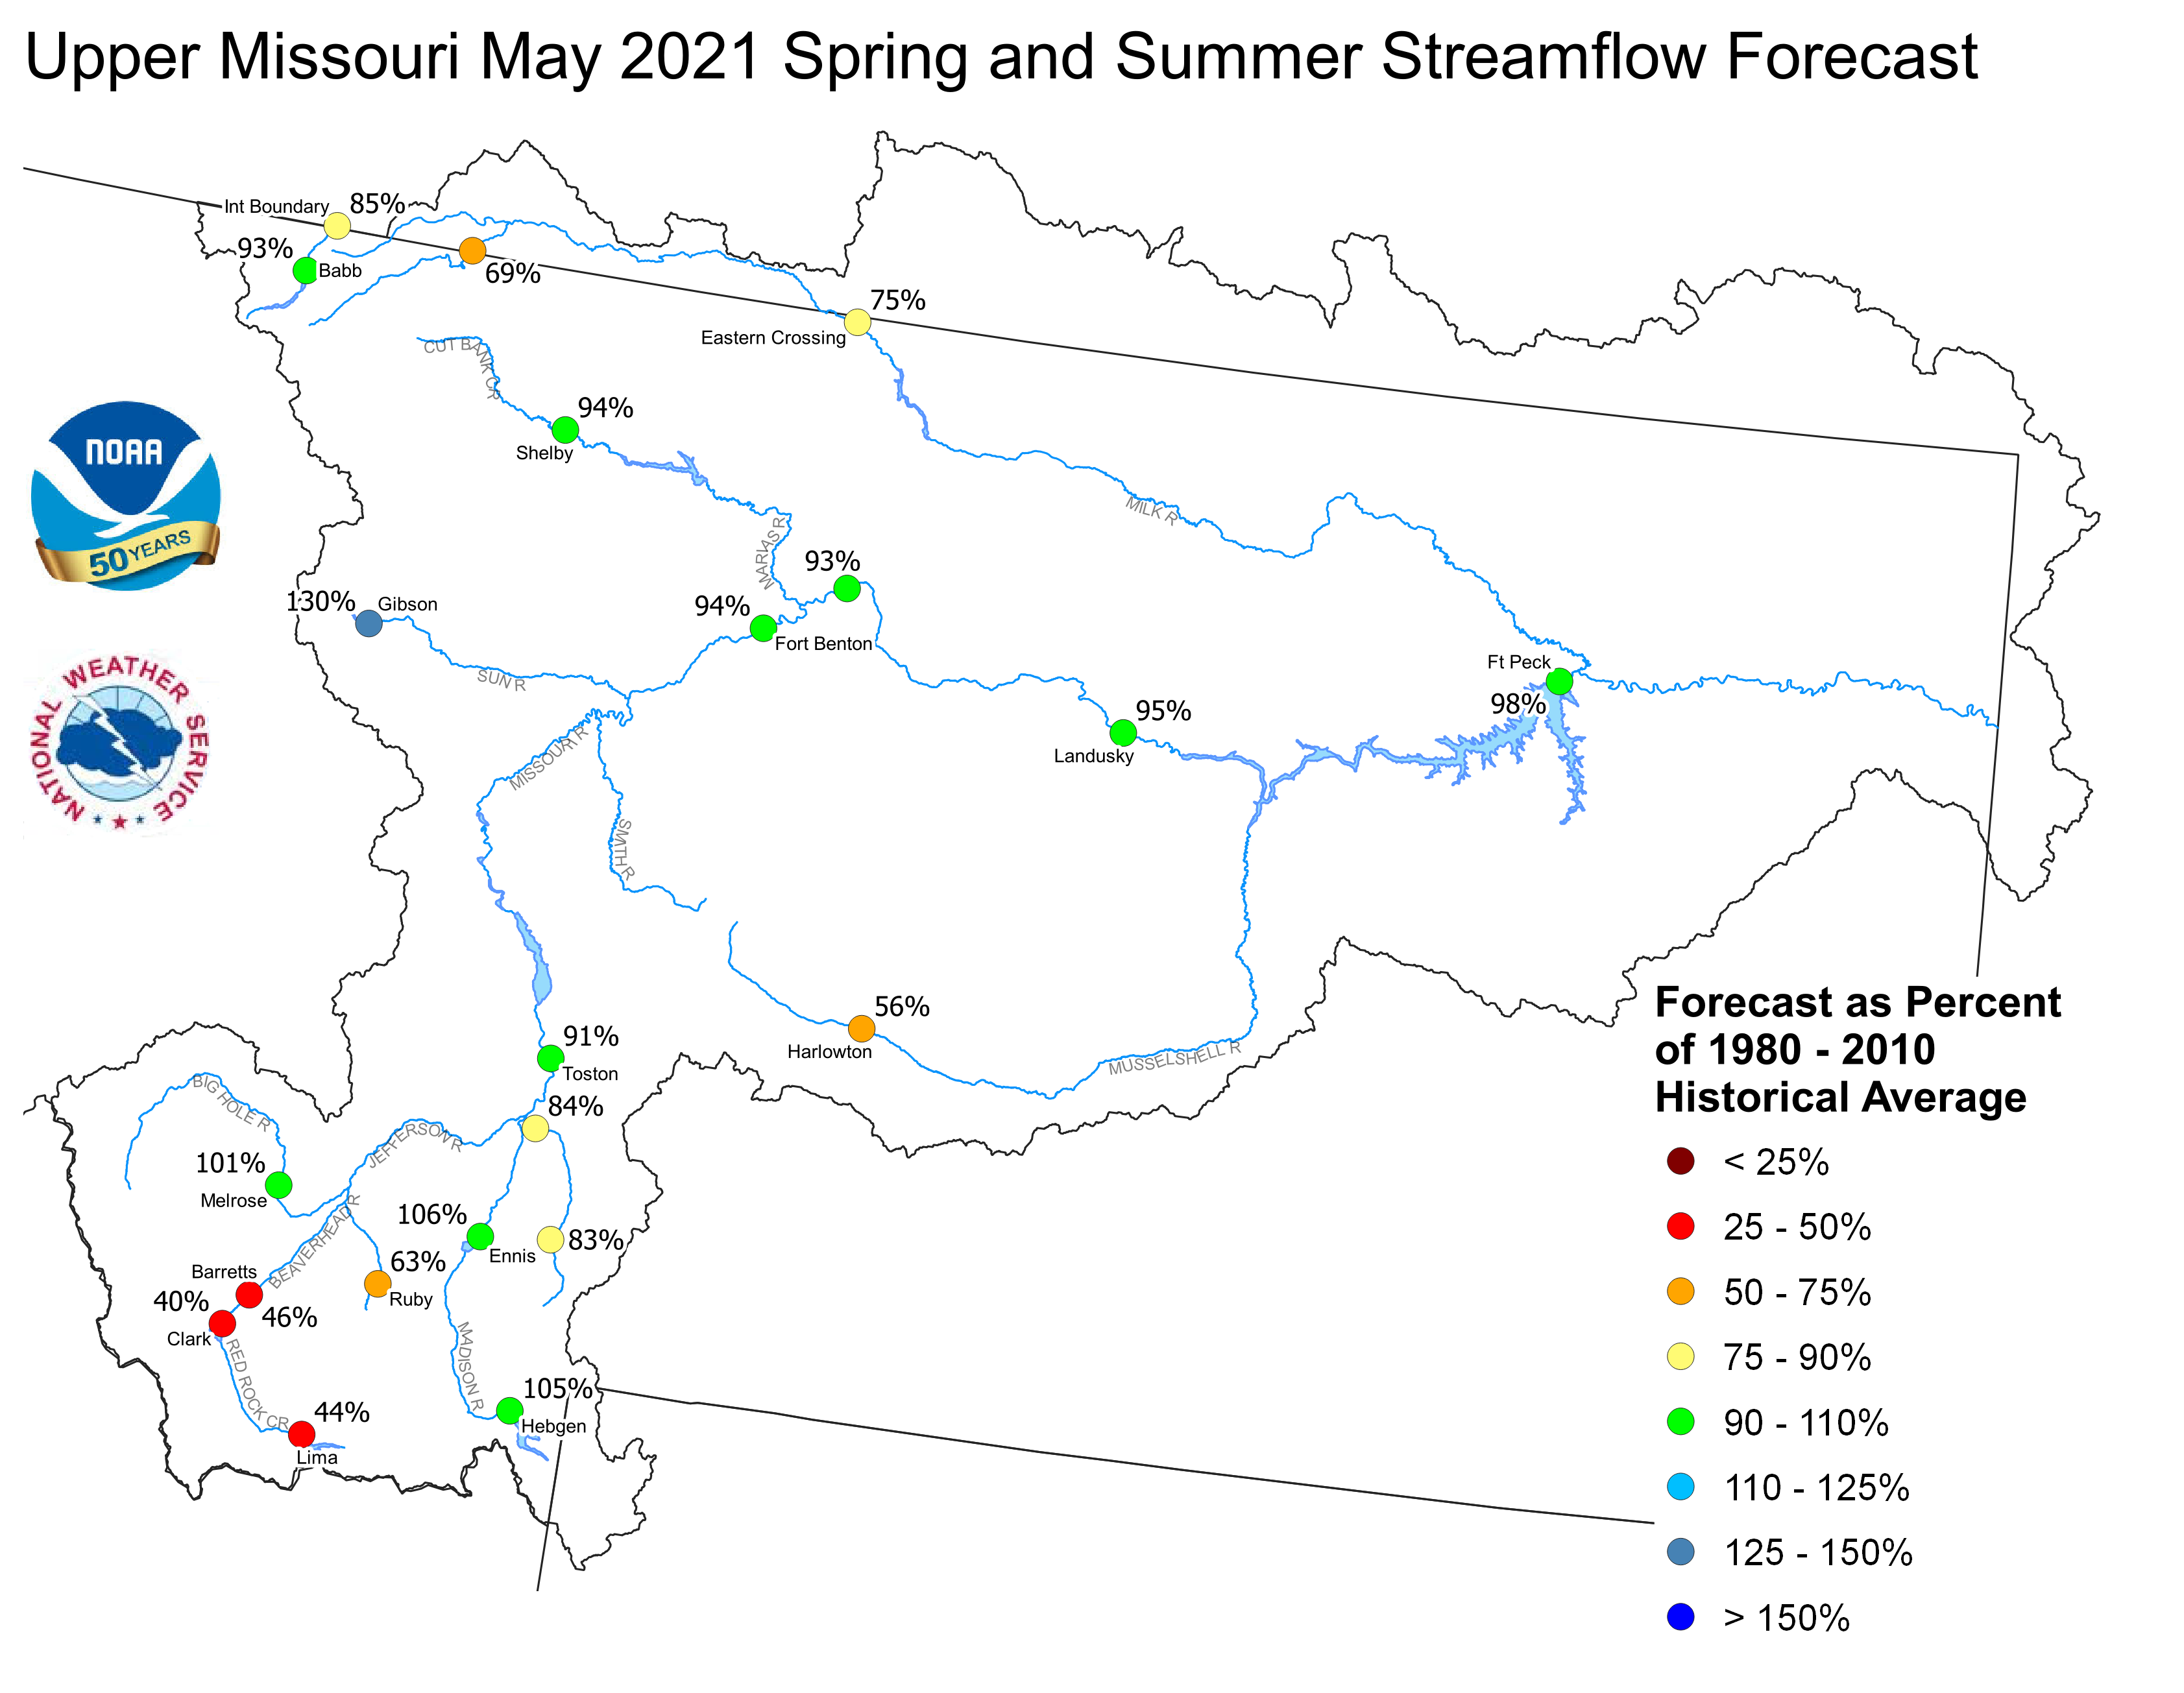
Upper Missouri May 1, 2021 Spring and Summer Streamflow Forecasts
Of the four major irrigation reservoirs in Montana; Lima
Reservoir had 96 percent average storage, Clark Canyon was
holding 102 percent of average water, Gibson Reservoir had 94
percent of average stored water, and Fresno Reservoir had
92 percent of average stored water.
Yellowstone Basin
The high elevation snow pack in the Yellowstone Basin was near average
on May 1. The snow pack in the Upper Yellowstone Basin was 88 percent
of average. The snow packs in the Wind, Bighorn, and Shoshone Basins were 104,
102, and 69 percent of average, respectively. The snow packs in the Tongue
and Powder basins were 118 and 137 percent of average, respectively.
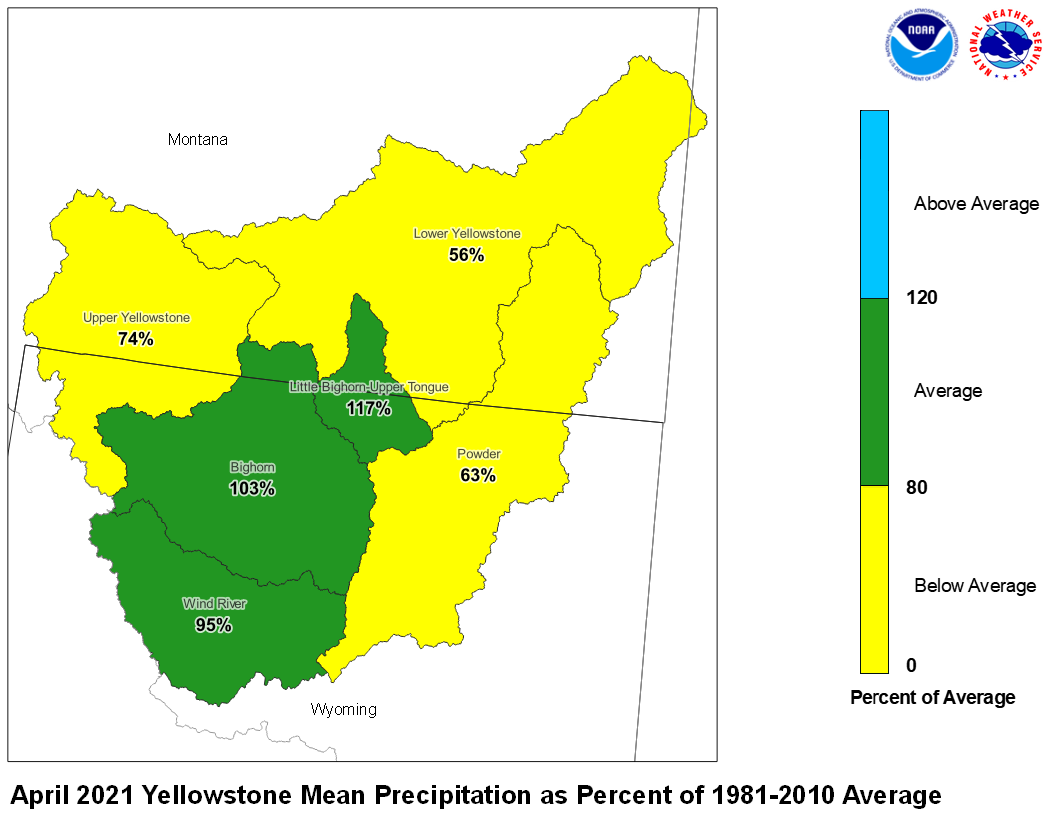
Precipitation during April was below to near average. The upper Yellowstone
River Basin received 74 percent of average precipitation while the
Lower Yellowstone River Basin reported 56 percent of average. The
Bighorn Basin received 103 percent of average precipitation while the
Wind River Basin received 95 percent of average. The Little Bighorn -
Upper Tongue Basin received 117 percent of average and the Powder River
had 63 percent of average precipitation.
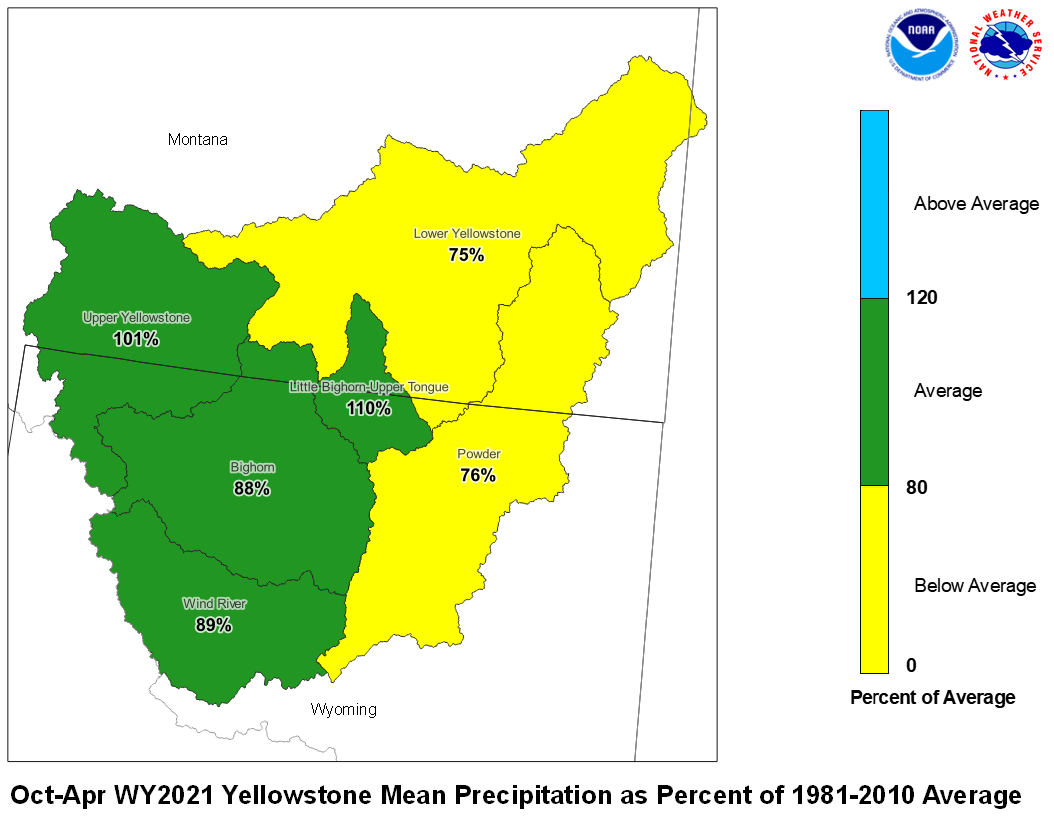
April 2021 Yellowstone Mean Precip Oct-Apr WY2021 Yellowstone Mean Precip
Forecast stream flow in the Yellowstone Basin is below average
for the upcoming Spring and Summer. Stream flow for the
Yellowstone River above Sidney, Montana is forecast to be about
82 percent of average. Flow in the Tongue Basin is expected to be
92 percent of average. Flows in the Powder River are expected
to be about 73 percent of average.
Monthend storage at Boysen Reservoir was 111 percent of average.
Stored water in Buffalo Bill Reservoir was 124 percent of average.
Monthend storage was 102 percent of average at Bighorn Reservoir.
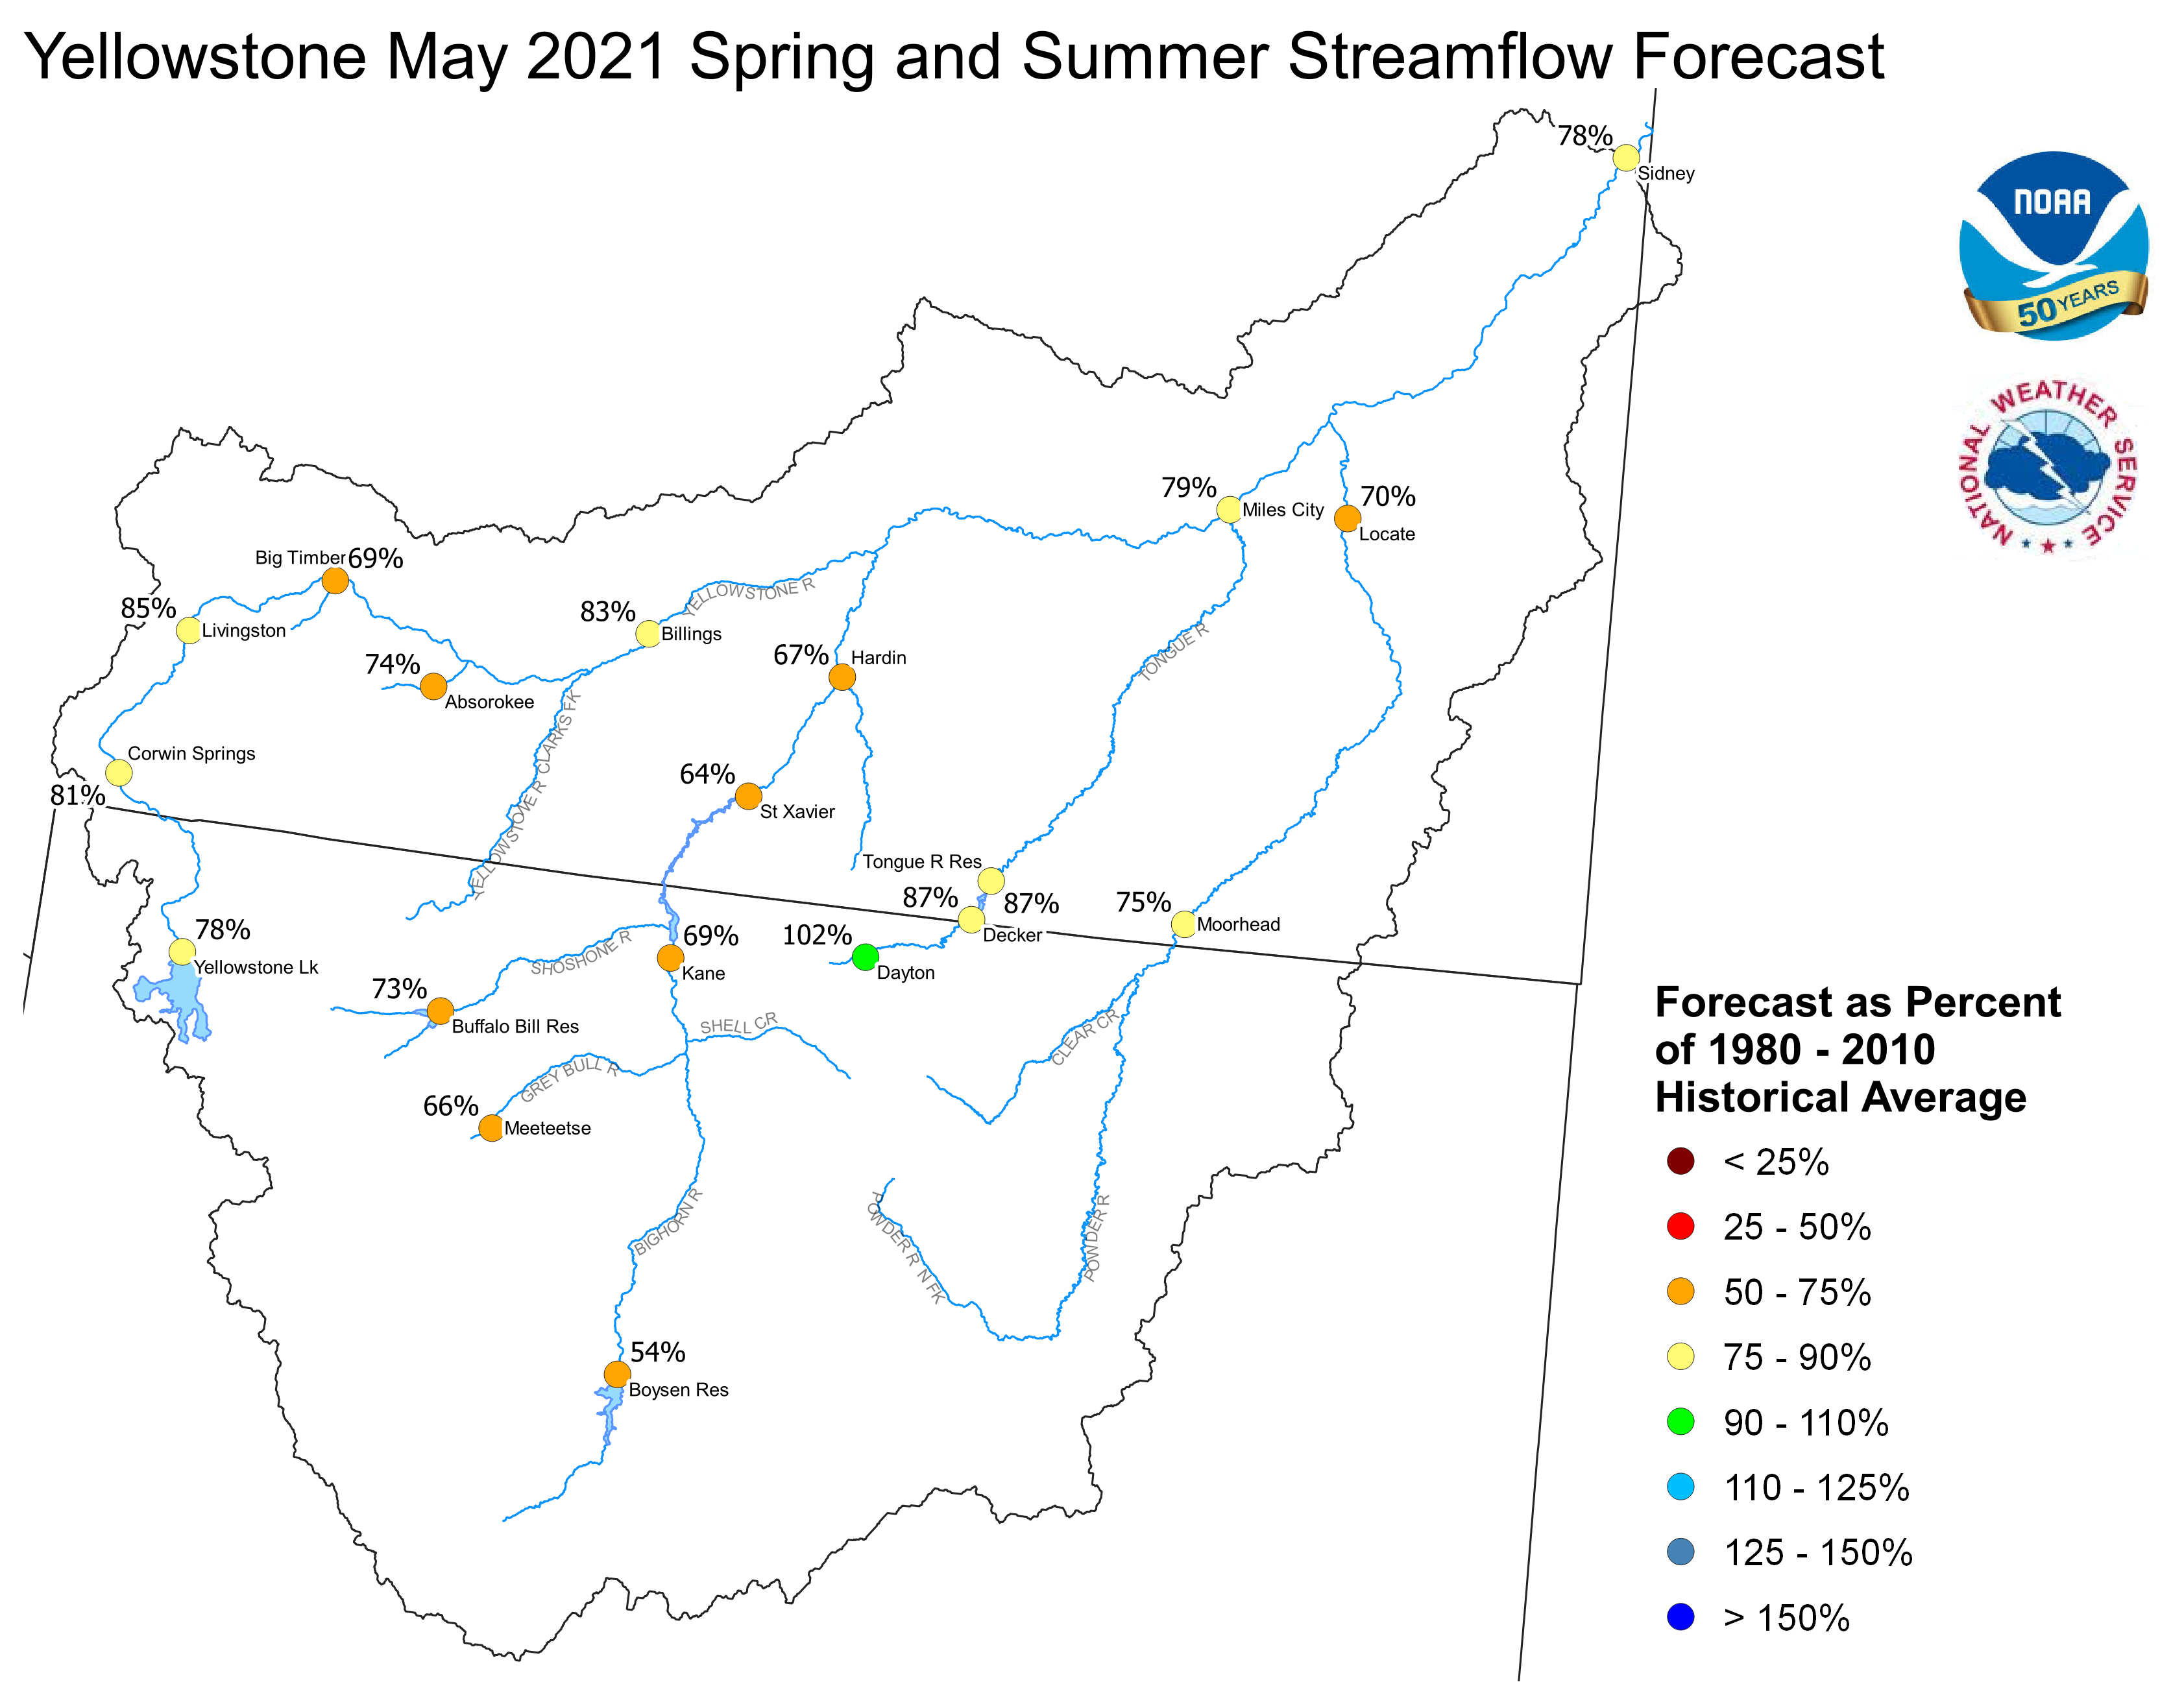
Yellowstone May 1, 2021 Spring and Summer Streamflow Forecasts
Platte Basin
The high elevation snow pack in the Upper North Platte Basin was
83 percent of average on May 1. The snow pack in the North Platte
Basin below Seminoe Reservoir was 130 percent of average. The snow
pack in the South Platte Basin was 102 percent of average.
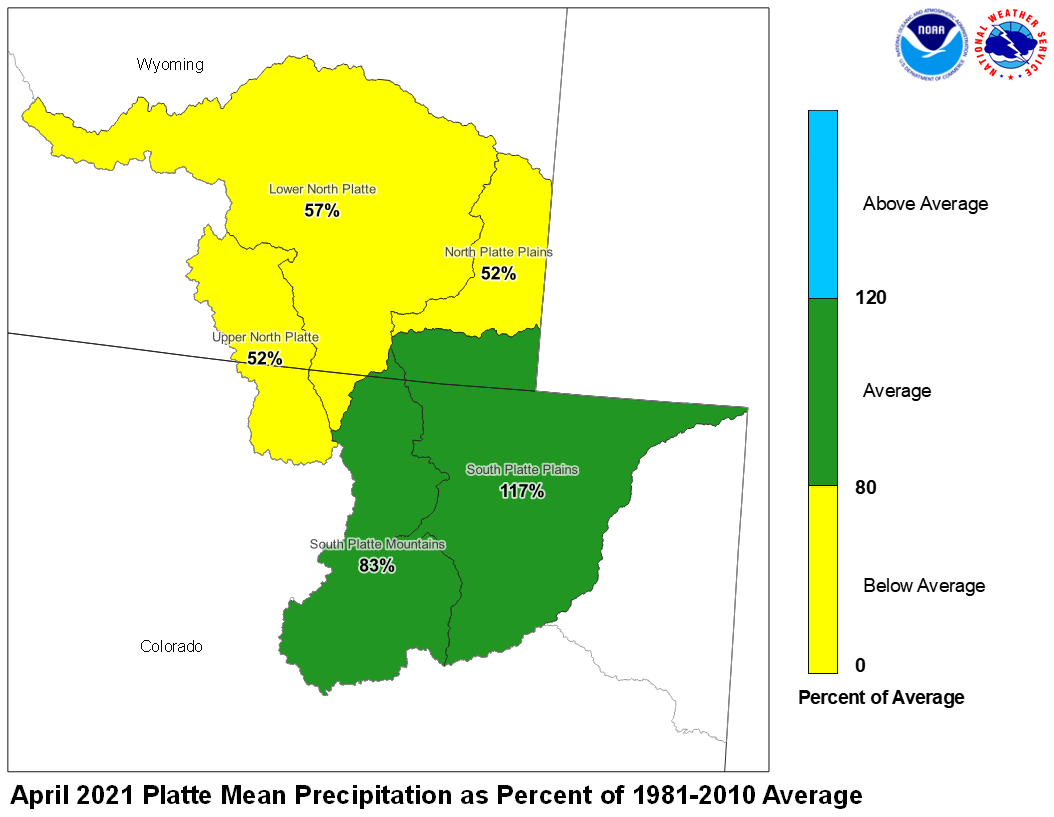
Precipitation during April in the Upper North Platte Basin was 52
percent of average. In the Lower North Platte Basin, precipitation
was 57 percent of average. The North Platte Plains below Guernsy
Reservoir had 52 percent. The South Platte Mountains had 83
percent whereas the Plains had 117 percent of average April
precipitation.

April 2021 Platte Mean Precip Oct-Apr WY2021 Platte Mean Precip
Stream flow in the Platte Basin is forecast to be below
average during the upcoming Spring and Summer. Runoff
for streams above Seminoe Reservoir are expected to be
about 75 percent of average. Streams in the South Platte
Basin above South Platte, Colorado can expect 67 percent
of average flow. For the remainder of the South Platte
basin, flows are expected near 83 percent.
Stored water in the South Platte Basin was 101 percent of average
on May 1.
North Platte Streamflow Fcst South Platte Streamflow Fcst
WATER SUPPLY FORECAST
NWS MISSOURI BASIN RIVER FORECAST CENTER
PLEASANT HILL MISSOURI

0811 AM CDT WEDNESDAY MAY 05, 2021


MISSOURI/YELLOWSTONE/PLATTE RIVER BASIN FORECASTS


                                          50%   %   10%   90%   AVG
FORECAST POINT                   PERIOD  (KAF) AVG (KAF) (KAF) (KAF)
--------------------------------------------------------------------

Boysen Resvr Inflow              May-Sep  577   54   943  411   1079
 SBDW4N

Bighorn R at Kane                May-Sep 1098   69  1609  791   1587
 LVEW4N

Greybull R at Meeteetse          May-Sep  113   66   175   64    170
 MEEW4N

Buffalo Bill Resvr Inflow        May-Sep  540   73   731  437    738
 CDYW4N

St. Mary R nr Babb               May-Sep  374   93   437  310    403
 SMYM8N

St. Mary R at Intl Boundary      May-Sep  429   85   520  351    506
 SMBM8N

Milk R nr Western Crossing       May-Sep   17   69    48    8     24
 PDBM8N

Milk R nr Eastern Crossing       May-Sep   35   75   117   17     47
 ERNM8N

North Platte R nr Northgate      May-Sep  144   70   229   88    207
 NGTC2

Encampment R nr Encampment       May-Sep   83   60   105   62    139
 ECRW4

Encampment R nr Encampment       May-Sep   90   61   112   69    146
 ECRW4N

Rock Cr nr Arlington             May-Sep   52  103    60   45     51
 KCRW4

Rock Cr nr Arlington             May-Sep   53  103    60   45     51
 KCRW4N

Seminoe Resvr Inflow             May-Sep  491   68   697  330    725
 SETW4

Seminoe Resvr Inflow             May-Sep  635   73   839  481    868
 SETW4N

Laramie R nr Woods Landing       May-Sep   53   52    93   33    101
 WODW4

Laramie R nr Woods Landing       May-Sep   86   65   126   65    133
 WODW4N

Little Laramie R nr Filmore      May-Sep   57  136    71   46     42
 SMTW4

Little Laramie R nr Filmore      May-Sep   59  110    73   49     54
 SMTW4N

Antero Resvr Inflow              May-Sep   10   63    13    7     16
 ANRC2N

Spinney Mountain Resvr Inflow    May-Sep   30   57    44   23     53
 SPYC2N

Elevenmile Canyon Resvr Inflow   May-Sep   34   61    50   25     56
 EVNC2N

Cheesman Lk Inflow               May-Sep   73   70   100   56    104
 CHEC2N

S Platte R at S Platte           May-Sep  161   85   215  132    189
 SPTC2N

Bear Cr at Morrison              May-Sep   23  127    33   18     18
 MRRC2N

Clear Cr at Golden               May-Sep   52   47    75   45    112
 GLDC2N

St. Vrain Cr at Lyons            May-Sep   89   98   114   78     91
 LNSC2N

Boulder Cr nr Orodell            May-Sep   42   86    57   39     49
 OROC2N

S Boulder Cr nr Eldorado Sprgs   May-Sep   27   71    43   22     38
 BELC2N

Cache La Poudre at Canyon Mouth  May-Sep  148   73   234  115    201
 FTDC2N

Lima Resvr Inflow                May-Sep   28   44    45   21     63
 LRRM8N

Clark Canyon Resvr Inflow        May-Sep   53   40    81   41    132
 CLKM8N

Beaverhead R at Barretts         May-Sep   74   46   106   62    161
 BARM8N

Ruby R Resvr Inflow              May-Sep   54   63    70   43     87
 ALRM8N

Big Hole R nr Melrose            May-Sep  436   90   653  346    482
 MLRM8

Big Hole R nr Melrose            May-Sep  500  101   717  410    494
 MLRM8N

Hebgen Resvr Inflow              May-Sep  388  105   450  341    369
 HBDM8N

Ennis Resvr Inflow               May-Sep  692  106   799  585    653
 ELMM8N

Gallatin R nr Gateway            May-Sep  354   83   457  288    424
 GLGM8

Gallatin R nr Gateway            May-Sep  353   83   456  287    424
 GLGM8N

Gallatin R at Logan              May-Sep  304   68   465  228    447
 LOGM8

Gallatin R at Logan              May-Sep  452   84   584  375    540
 LOGM8N

Missouri R at Toston             May-Sep 2017   91  2555 1701   2220
 TOSM8N

Missouri R at Fort Benton        May-Sep 3037   94  3766 2635   3240
 FBNM8N

Missouri R nr Virgelle           May-Sep 3452   93  4440 3013   3725
 VRGM8N

Missouri R nr Landusky           May-Sep 3697   95  4822 3214   3900
 LDKM8N

Missouri R below Fort Peck Dam   May-Sep 4032   98  5346 3501   4120
 FPKM8N

Gibson Resvr Inflow              May-Sep  454  130   625  404    349
 AGSM8N

Marias R nr Shelby               May-Sep  341   94   506  272    362
 SHLM8N

Musselshell R at Harlowton       May-Sep   51   56    88   28     92
 HLWM8N

Yellowstone R at Yellowstone Lk  May-Sep  422   55   503  344    767
 YLOW4

Yellowstone R at Yellowstone Lk  May-Sep  563   78   666  445    722
 YLOW4N

Yellowstone R at Corwin Sprgs    May-Sep 1193   67  1442 1010   1772
 CORM8

Yellowstone R at Corwin Sprgs    May-Sep 1397   81  1672 1165   1722
 CORM8N

Yellowstone R at Livingston      May-Sep 1454   73  1764 1242   1994
 LIVM8

Yellowstone R at Livingston      May-Sep 1718   85  2055 1459   2024
 LIVM8N

Yellowstone R at Billings        May-Sep 2273  102  2990 1931   2220
 BILM8

Yellowstone R at Billings        May-Sep 3175   83  3909 2788   3840
 BILM8N

Yellowstone R at Miles City      May-Sep 5268   79  6698 4440   6670
 MILM8N

Yellowstone R at Sidney          May-Sep 5420   78  6999 4588   6940
 SIDM8N

Boulder R at Big Timber          May-Sep  168   58   212  135    288
 BTMM8

Boulder R at Big Timber          May-Sep  209   69   254  179    303
 BTMM8N

Stillwater R nr Absarokee        May-Sep  323   68   411  263    472
 SRAM8

Stillwater R nr Absarokee        May-Sep  381   74   468  324    517
 SRAM8N

Clks Fk Yellowstone R nr Belfry  May-Sep  428   82   548  361    524
 BFYM8

Clks Fk Yellowstone R nr Belfry  May-Sep  499   87   620  434    572
 BFYM8N

Bighorn R nr St. Xavier          May-Sep 1727   64  2410 1316   2717
 STXM8N

Little Bighorn R nr Hardin       May-Sep   59   67    90   46     89
 HRDM8N

Tongue R nr Dayton               May-Sep   76  102   109   61     75
 DAYW4N

Tongue R nr Decker               May-Sep  169   87   254  130    193
 DSLM8N

Tongue R Resvr Inflow            May-Sep  169   87   257  131    195
 DKRM8N

Powder R at Moorhead             May-Sep  142   75   237  102    190
 MHDM8N

Powder R nr Locate               May-Sep  148   70   246  106    211
 LOCM8N


Locations with an `N` suffix indicate natural flows excluding
stream augmentations.

KAF: Thousands of Acre-feet

%AVG: Current 50%/AVG

AVG: Average(50%) seasonal runoff voulme as simulated by the river
forecast model considering acontinuous simulation of the basin
response to historic climate data (observed precipitation and
temperatures) over the period of 1981-2010.

The 50%, 10% and 90% columns indicate the probability that the
actual volume will exceed the forecast for the valid time perion
for more information, please visit: www.weather.gov/mbrfc/water


