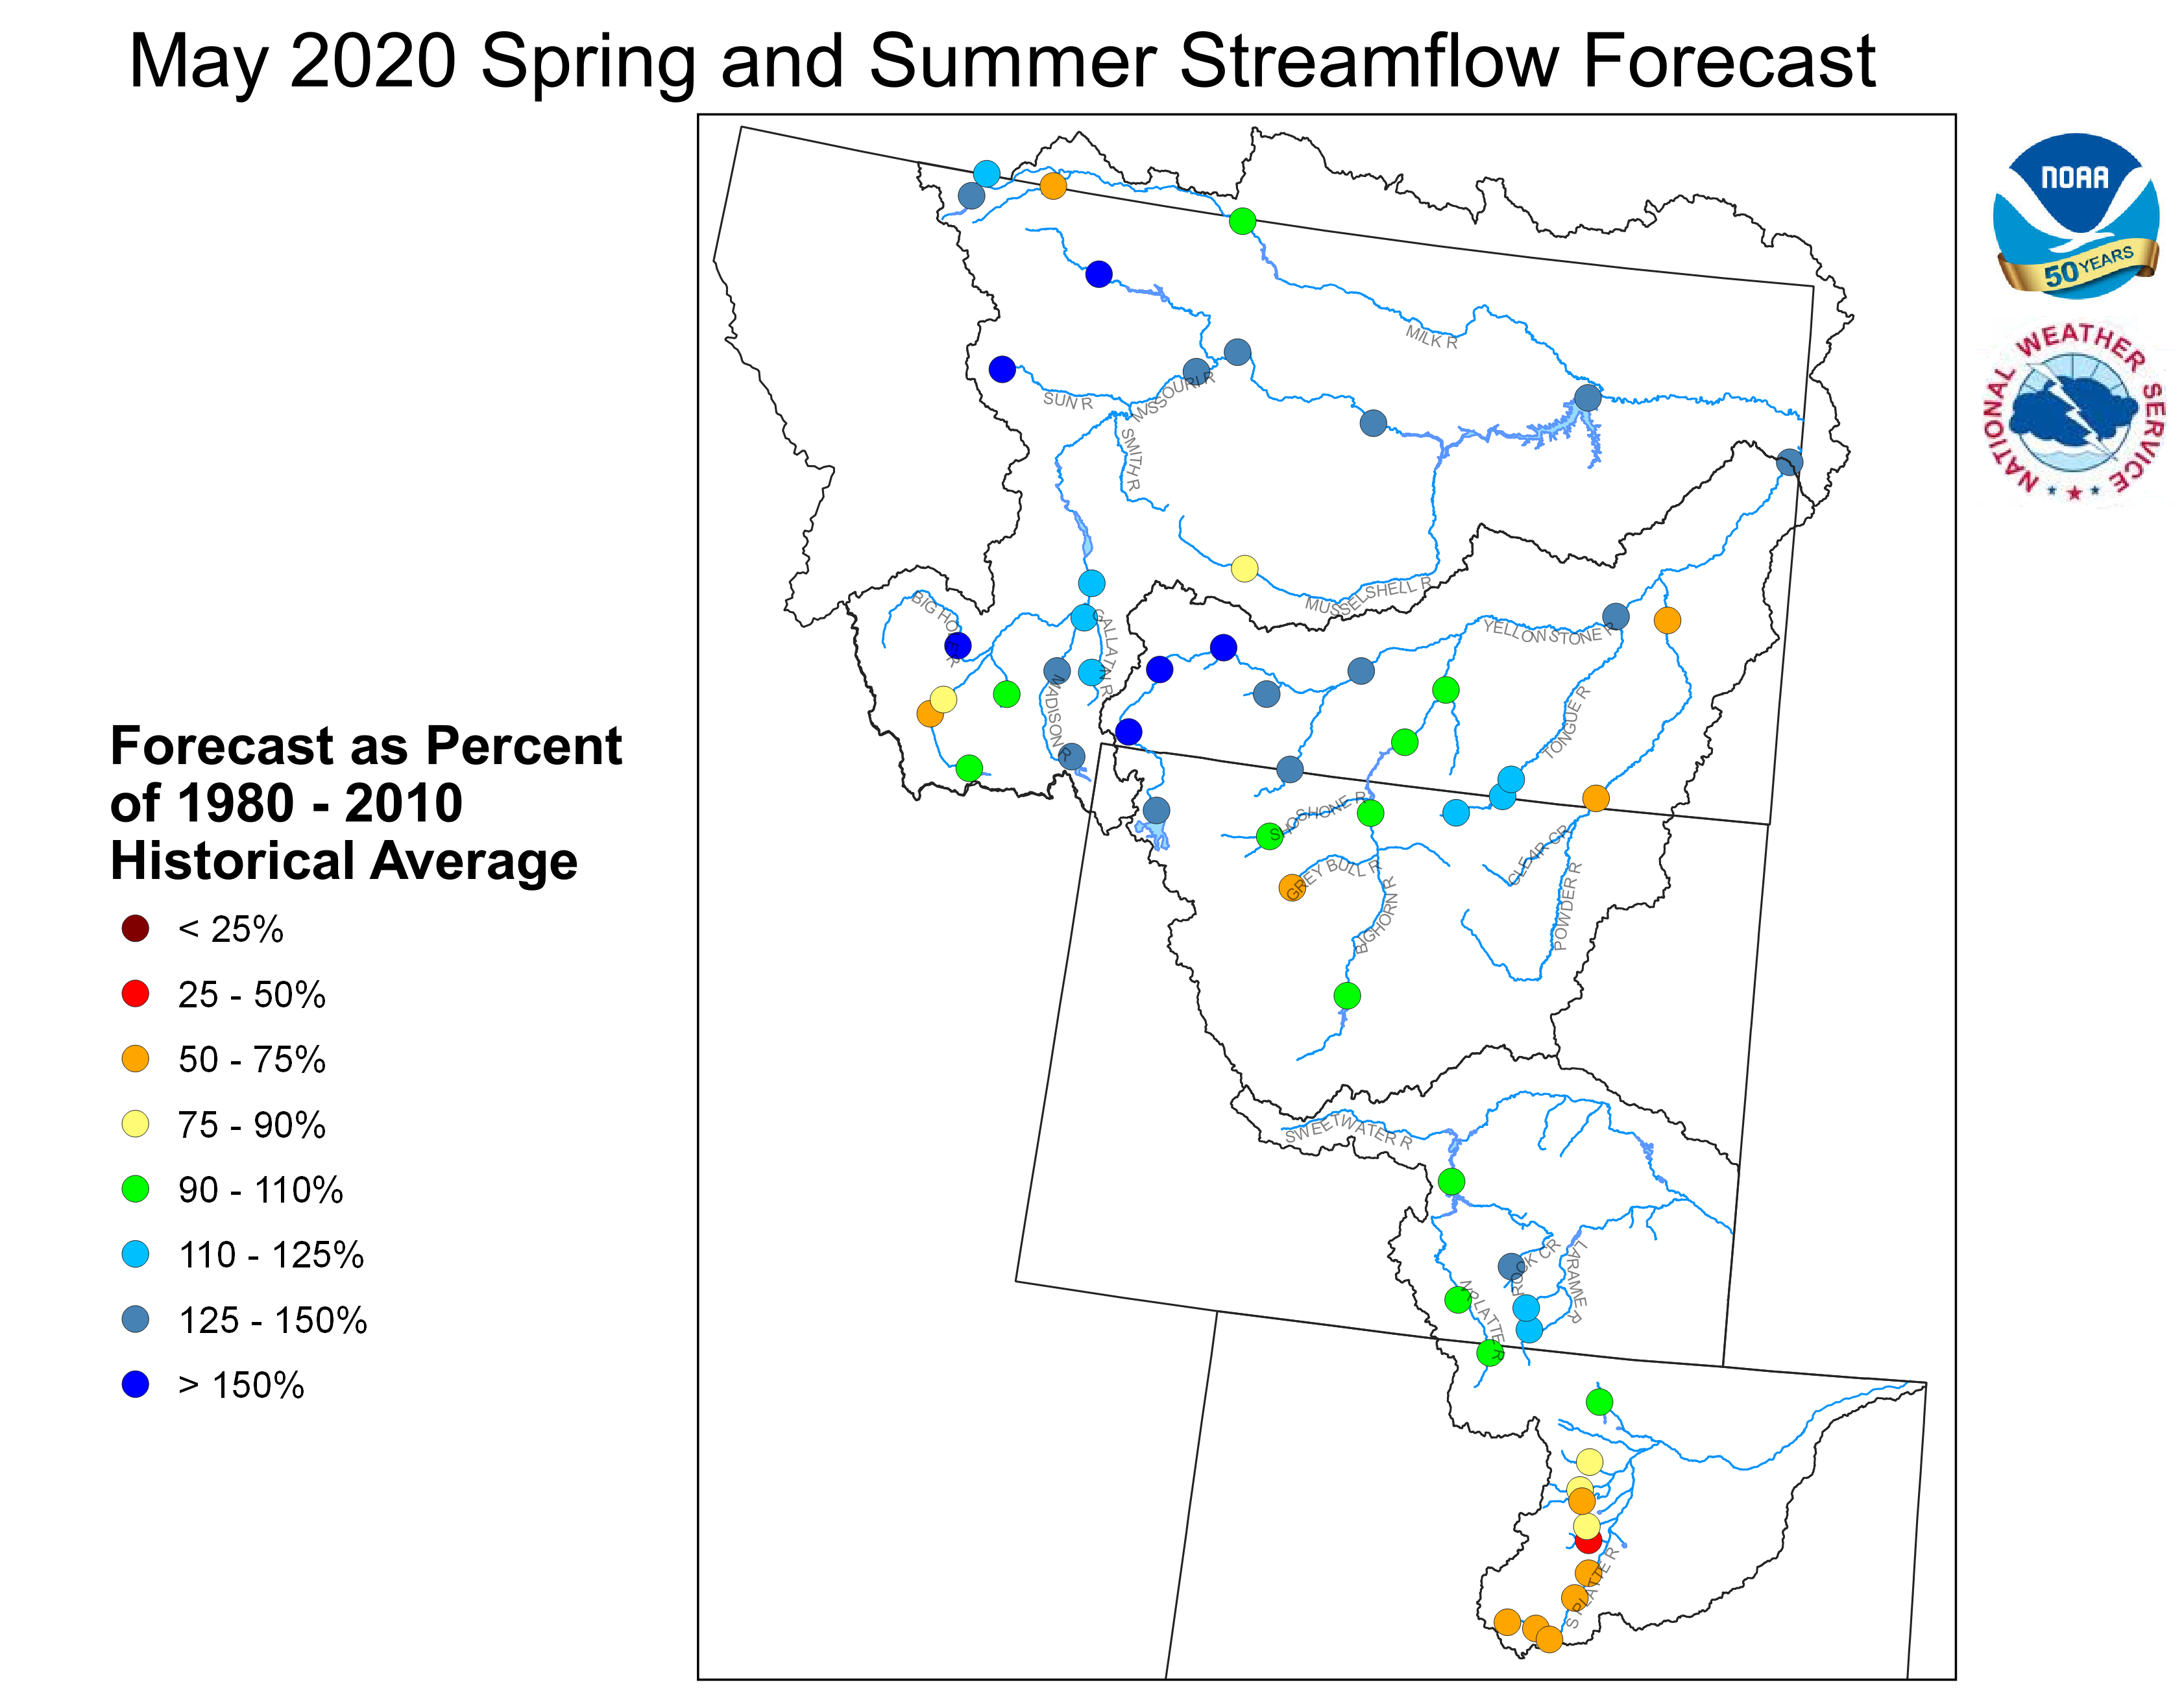
May 1, 2020 Spring and Summer Streamflow Forecasts
Upper Missouri Basin
The high elevation snow pack in the Upper Missouri Basin as of May 1 was above average. The snow pack above Fort Peck, Montana was 118 percent. The snow pack in the St. Mary Basin was 143 percent, and the Milk River Basin was 137 percent.
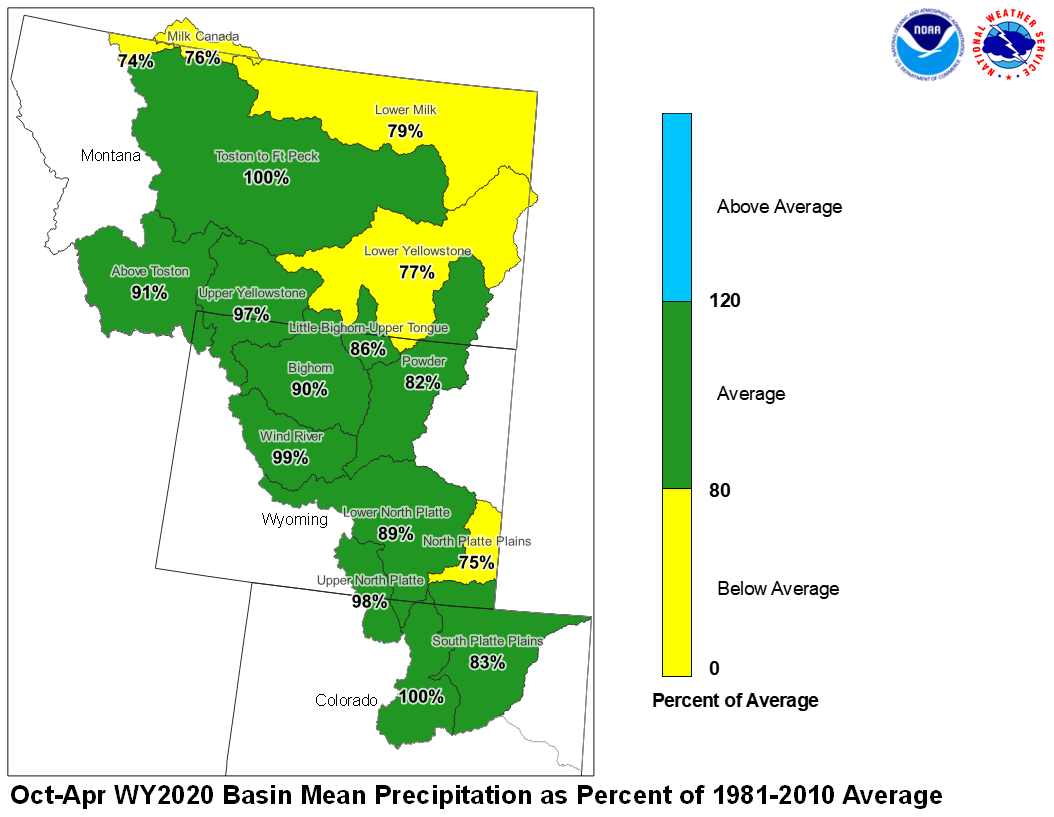
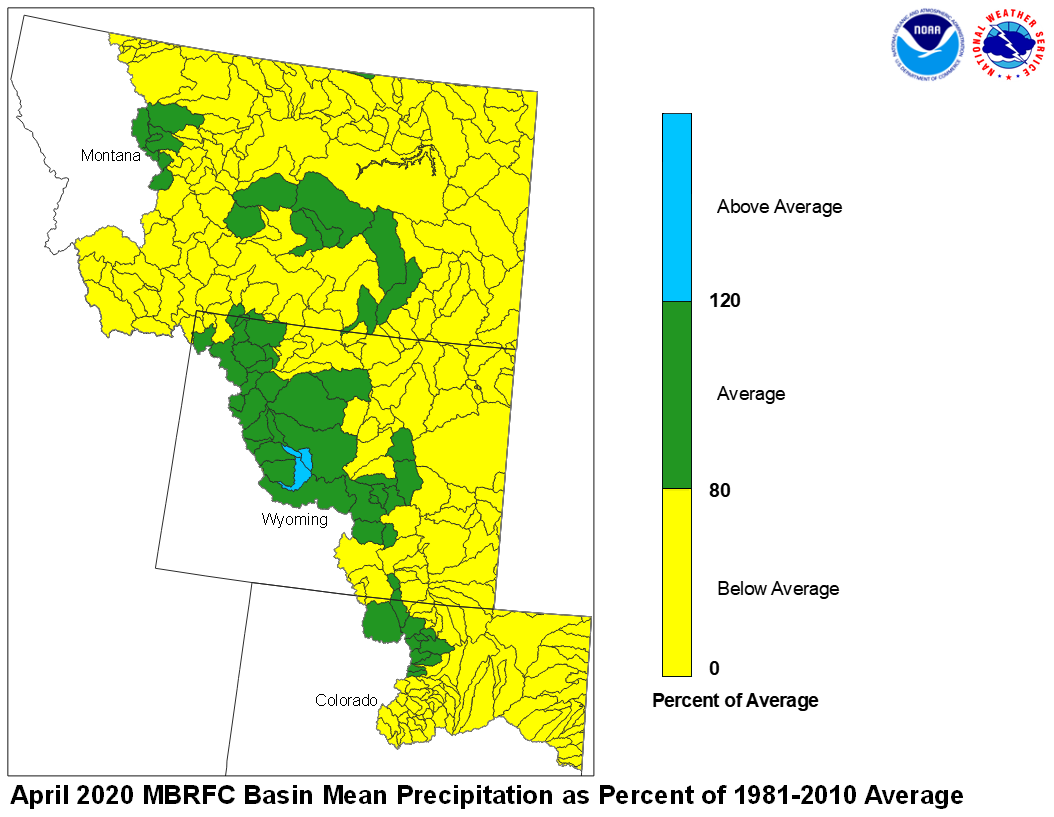
April precipitation across the Upper Missouri Basin was below average. Basin precipitation summaries for the Missouri Basin include: Milk St. Mary, 67 percent; Milk Canada, 54 percent; Lower Milk, 34 percent; above Toston, 59 percent; Toston to Ft. Peck, 74 percent.
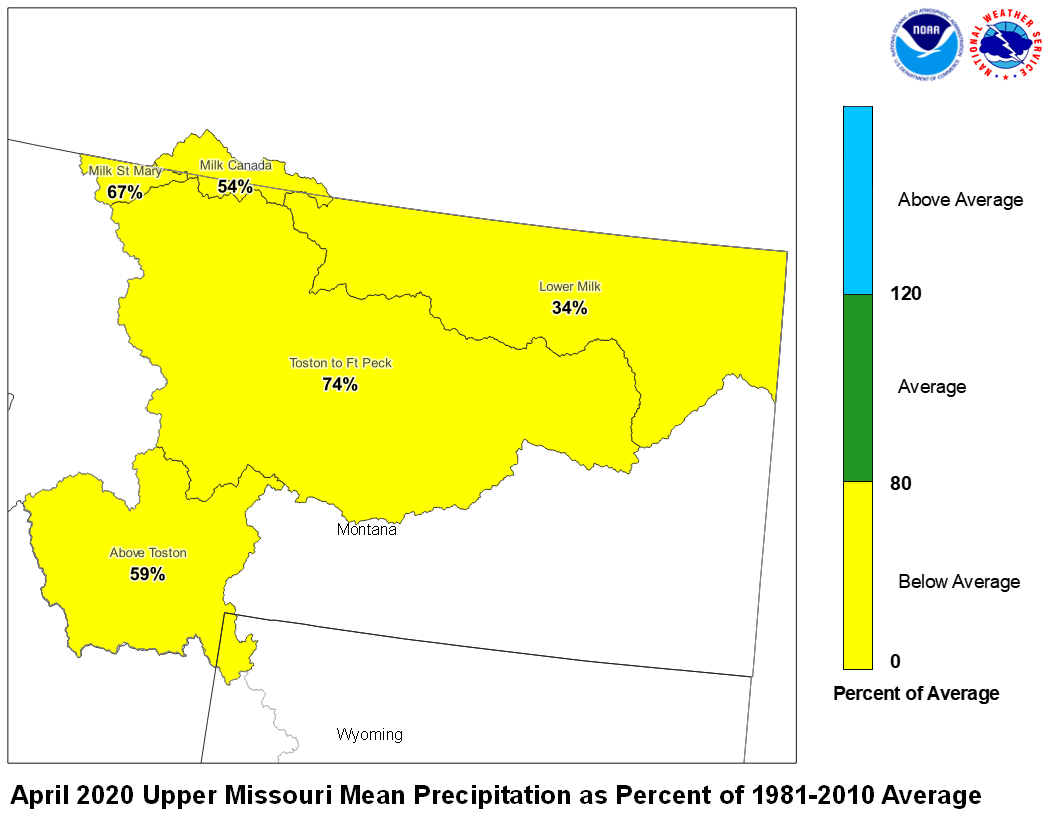
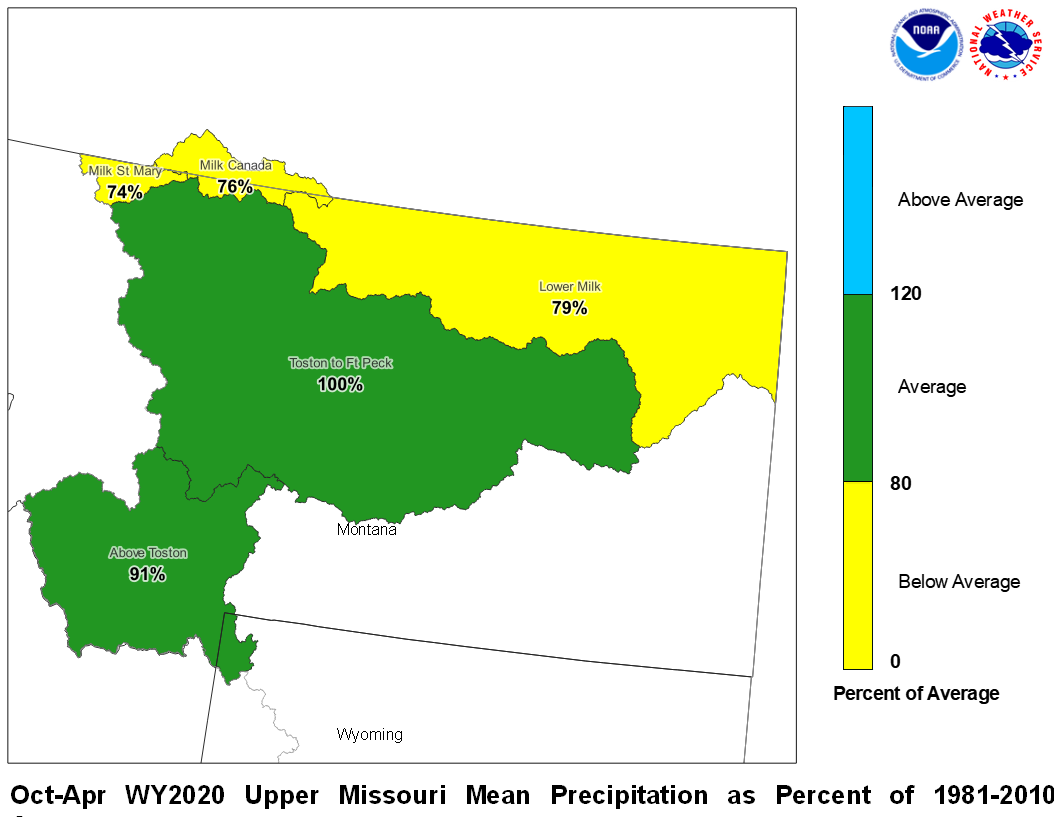
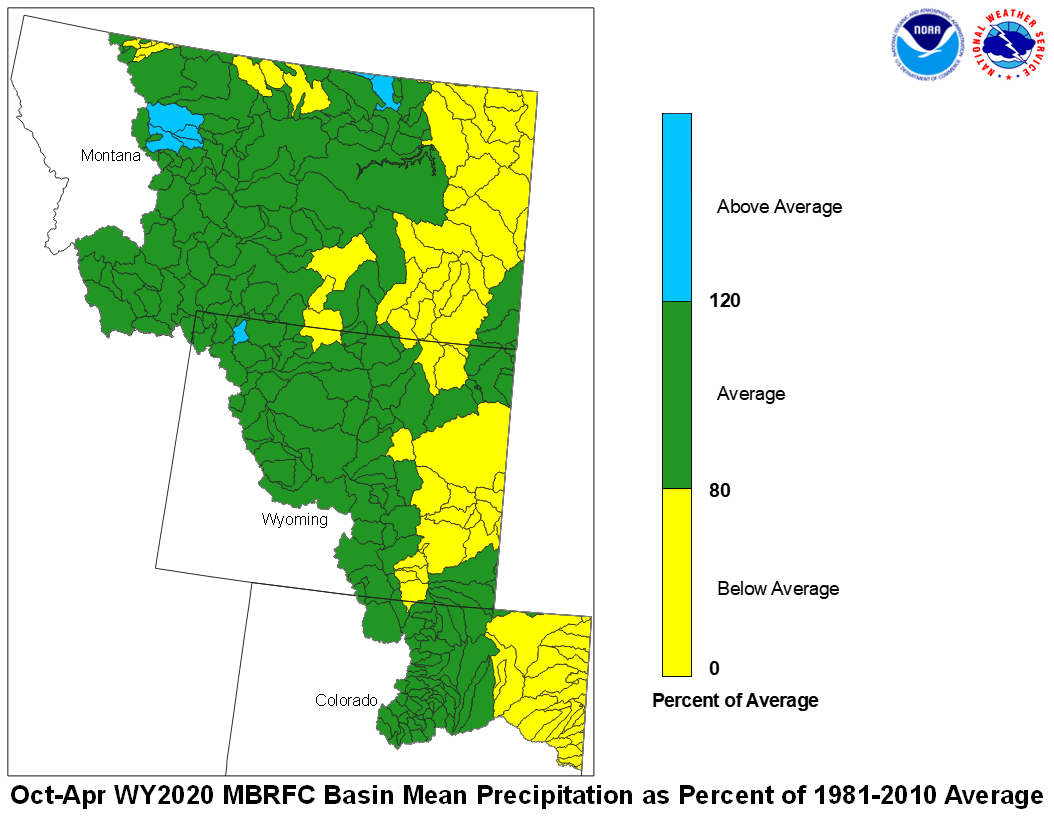
April 2020 Upper Missouri Mean Precip Oct-Apr WY2020 Upper Missouri Mean Precip
Stream flow in the Upper Missouri Basin is forecast to be above average during the upcoming Spring and Summer. The St. Mary River is forecast to have 115 percent of average May-September flows. Runoff is expected to range around 125 percent of average for the Missouri Basin above Fort Peck, Montana.
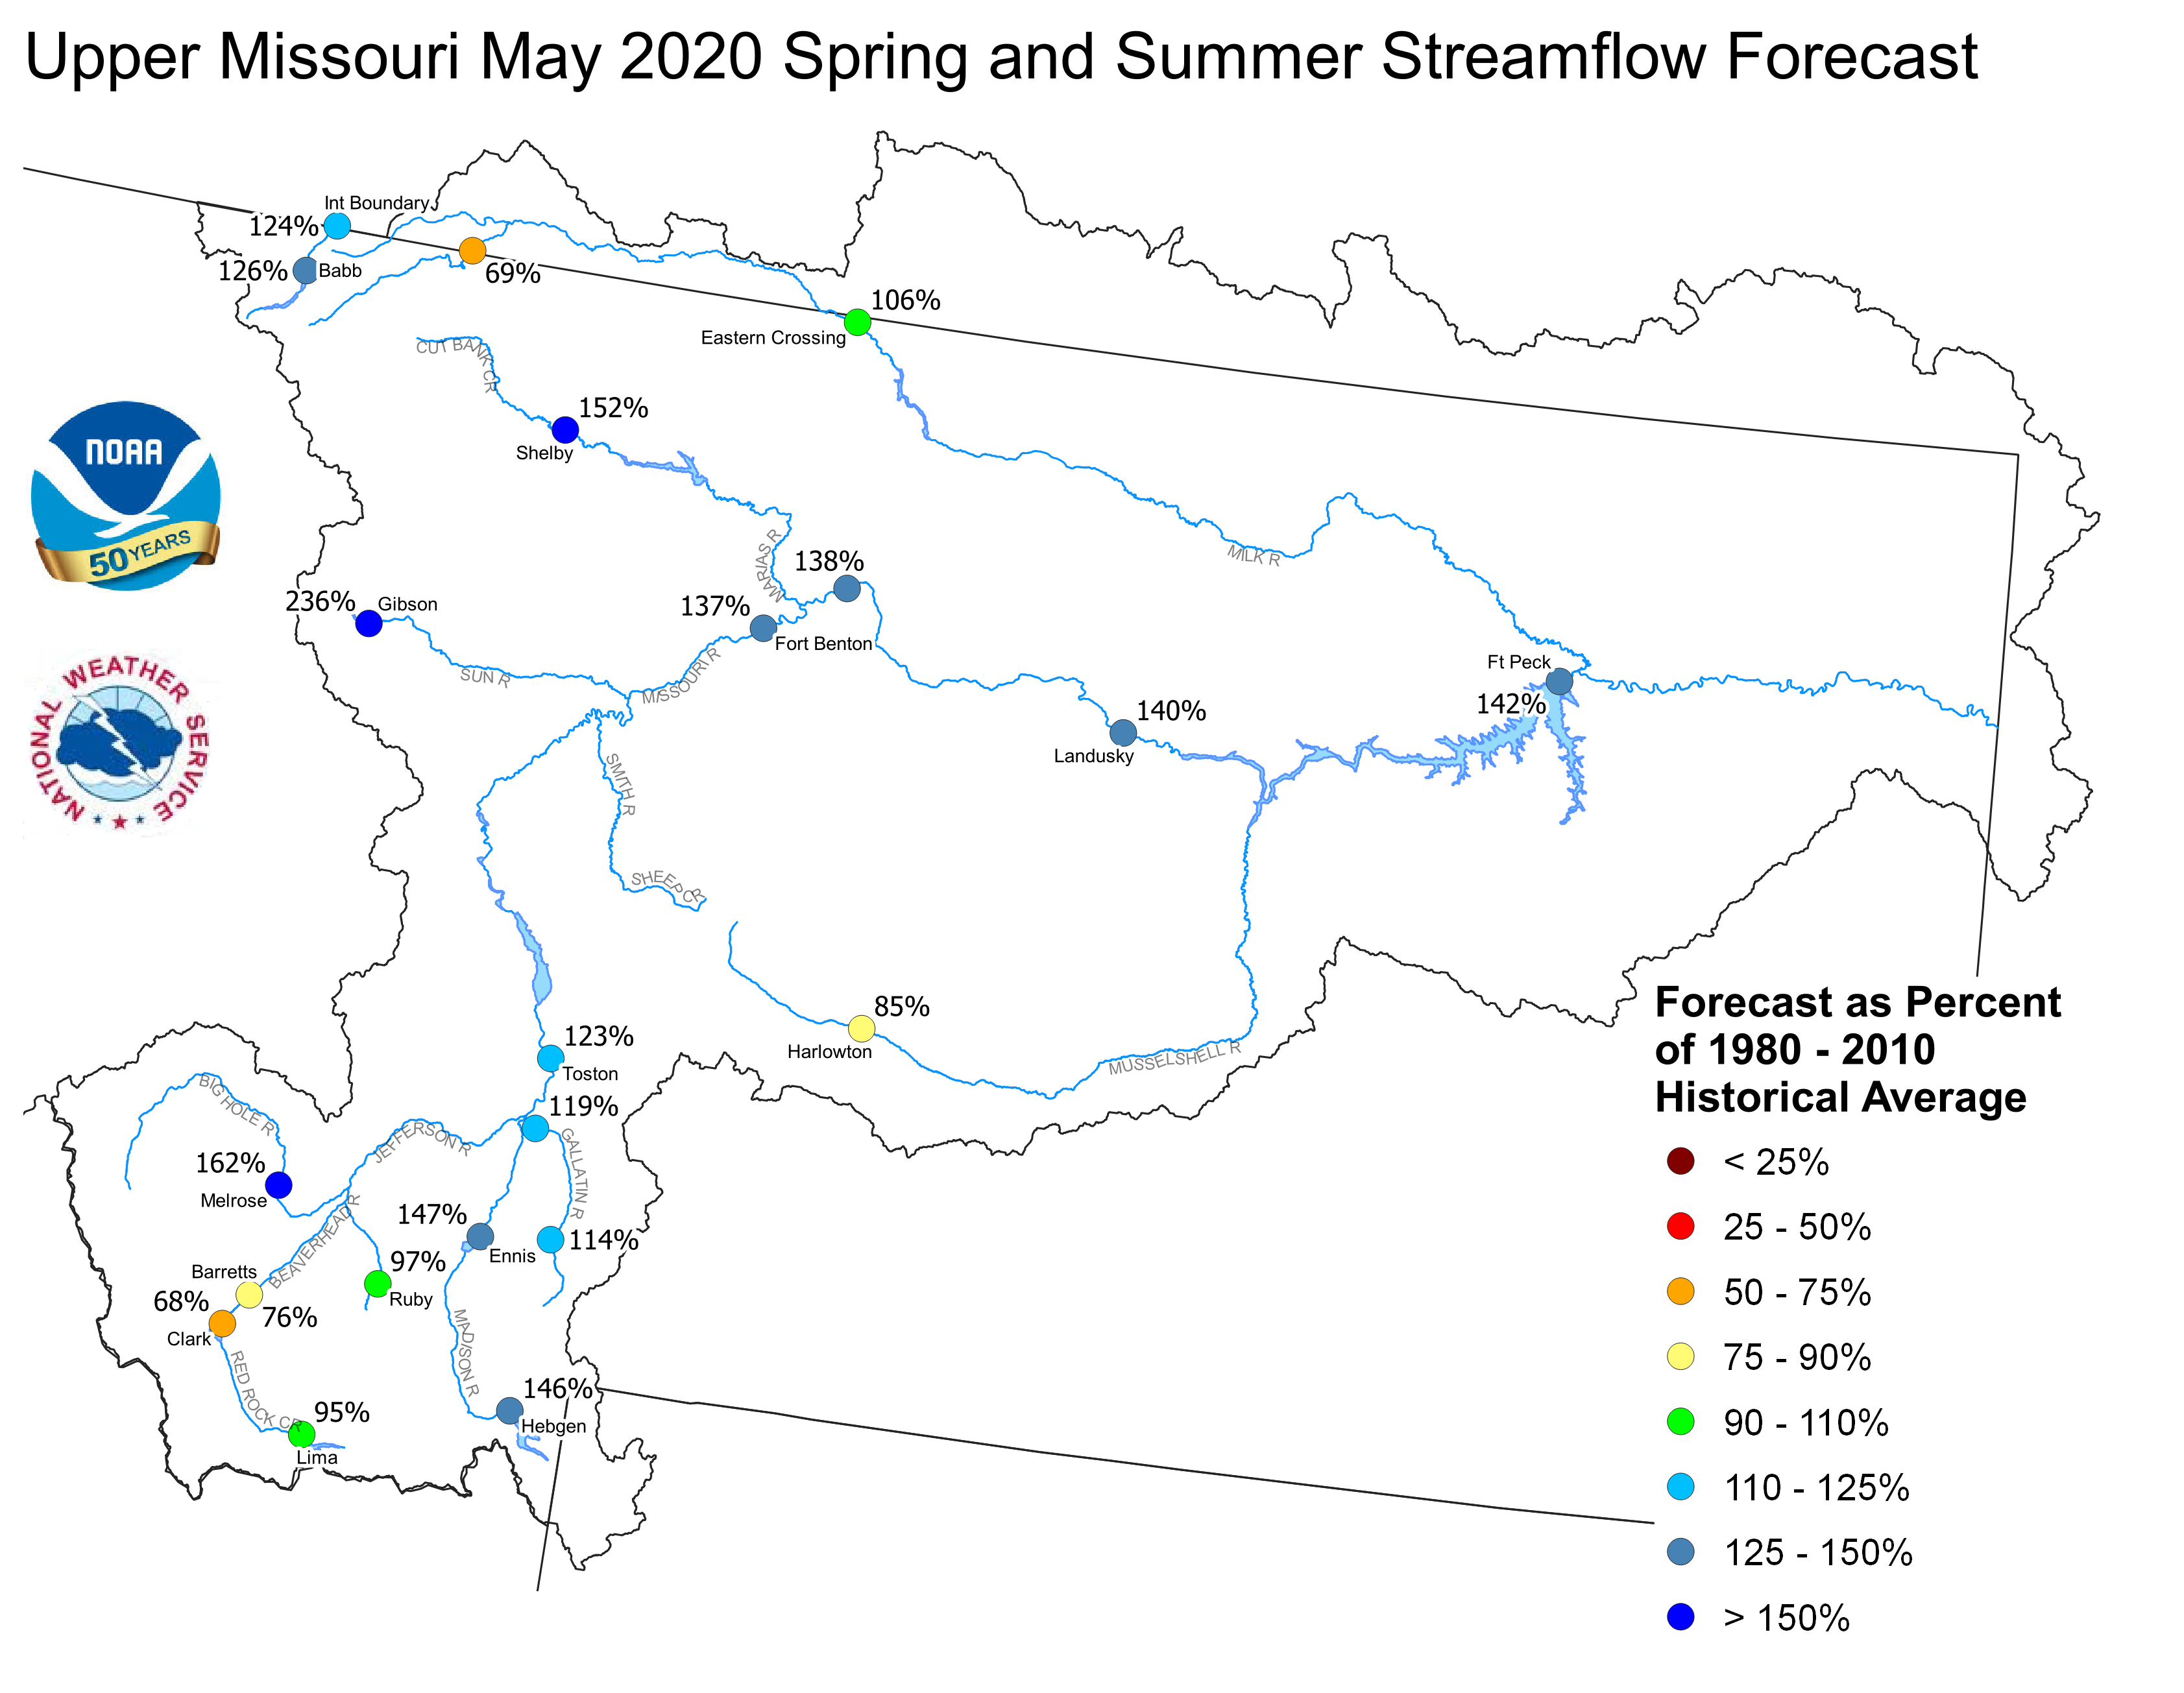
Upper Missouri May 1, 2020 Spring and Summer Streamflow Forecasts
Of the four major irrigation reservoirs in Montana; Lima Reservoir had 132 percent average storage, Clark Canyon was holding 117 percent of average water, Gibson Reservoir had 79 percent of average stored water, and Fresno Reservoir had 118 percent of average stored water.
The major hydroelectric reservoirs in Montana (Canyon Ferry and Fort Peck), had monthend storage in the average to above average range; 94 and 118 percent of average water, respectively.
Yellowstone Basin
The high elevation snow pack in the Yellowstone Basin was above average on May 1. The snow pack in the Upper Yellowstone Basin was 113 percent of average. The snow packs in the Wind, Bighorn, and Shoshone Basins were 110, 105, and 98 percent of average, respectively. The snow packs in the Tongue
and Powder basins were 104 and 103 percent of average, respectively.
Precipitation during April was below average. The upper Yellowstone River Basin received 57 percent of average precipitation while the Lower Yellowstone River Basin reported 60 percent of average. The Bighorn Basin received 74 percent of average precipitation while the Wind River Basin received 96 percent of average. The Little Bighorn - Upper Tongue Basin received 76 percent of average and the Powder River had 54 percent of average precipitation.
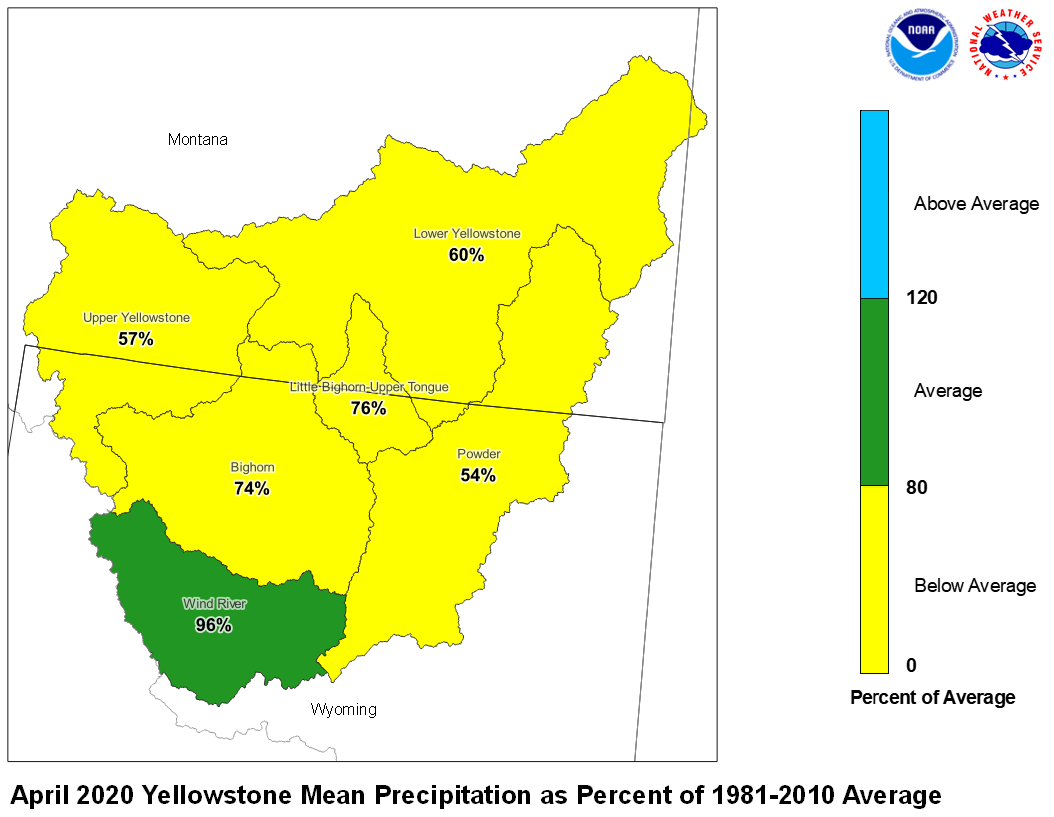
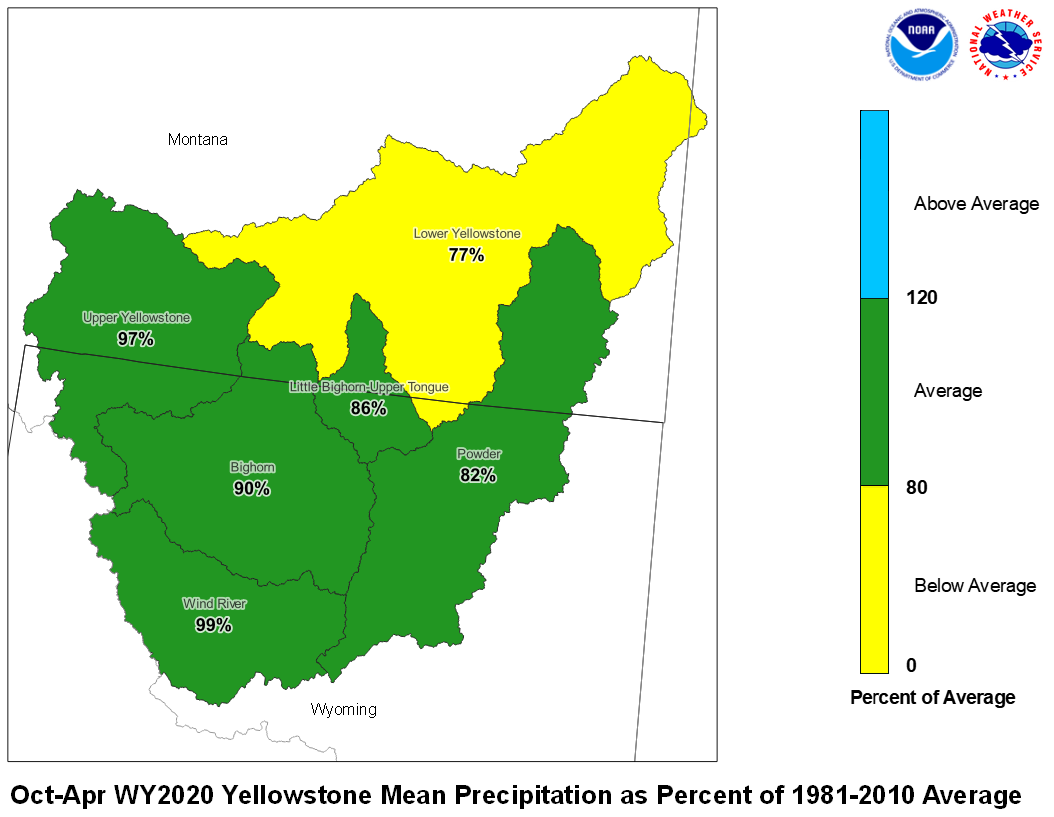
April 2020 Yellowstone Mean Precip Oct-Apr WY2020 Yellowstone Mean Precip
Forecast stream flow in the Yellowstone Basin is near average for the upcoming Spring and Summer. Stream flow for the Yellowstone River above Sidney, Montana is forecast to be about 108 percent of average. Flow in the Tongue Basin is expected to be 85 percent of average. Flows in the Powder River are expected to be about 91 percent of average.
Monthend storage at Boysen Reservoir was 100 percent of average. Stored water in Buffalo Bill Reservoir was 117 percent of average. Monthend storage was 97 percent of average at Bighorn Reservoir.
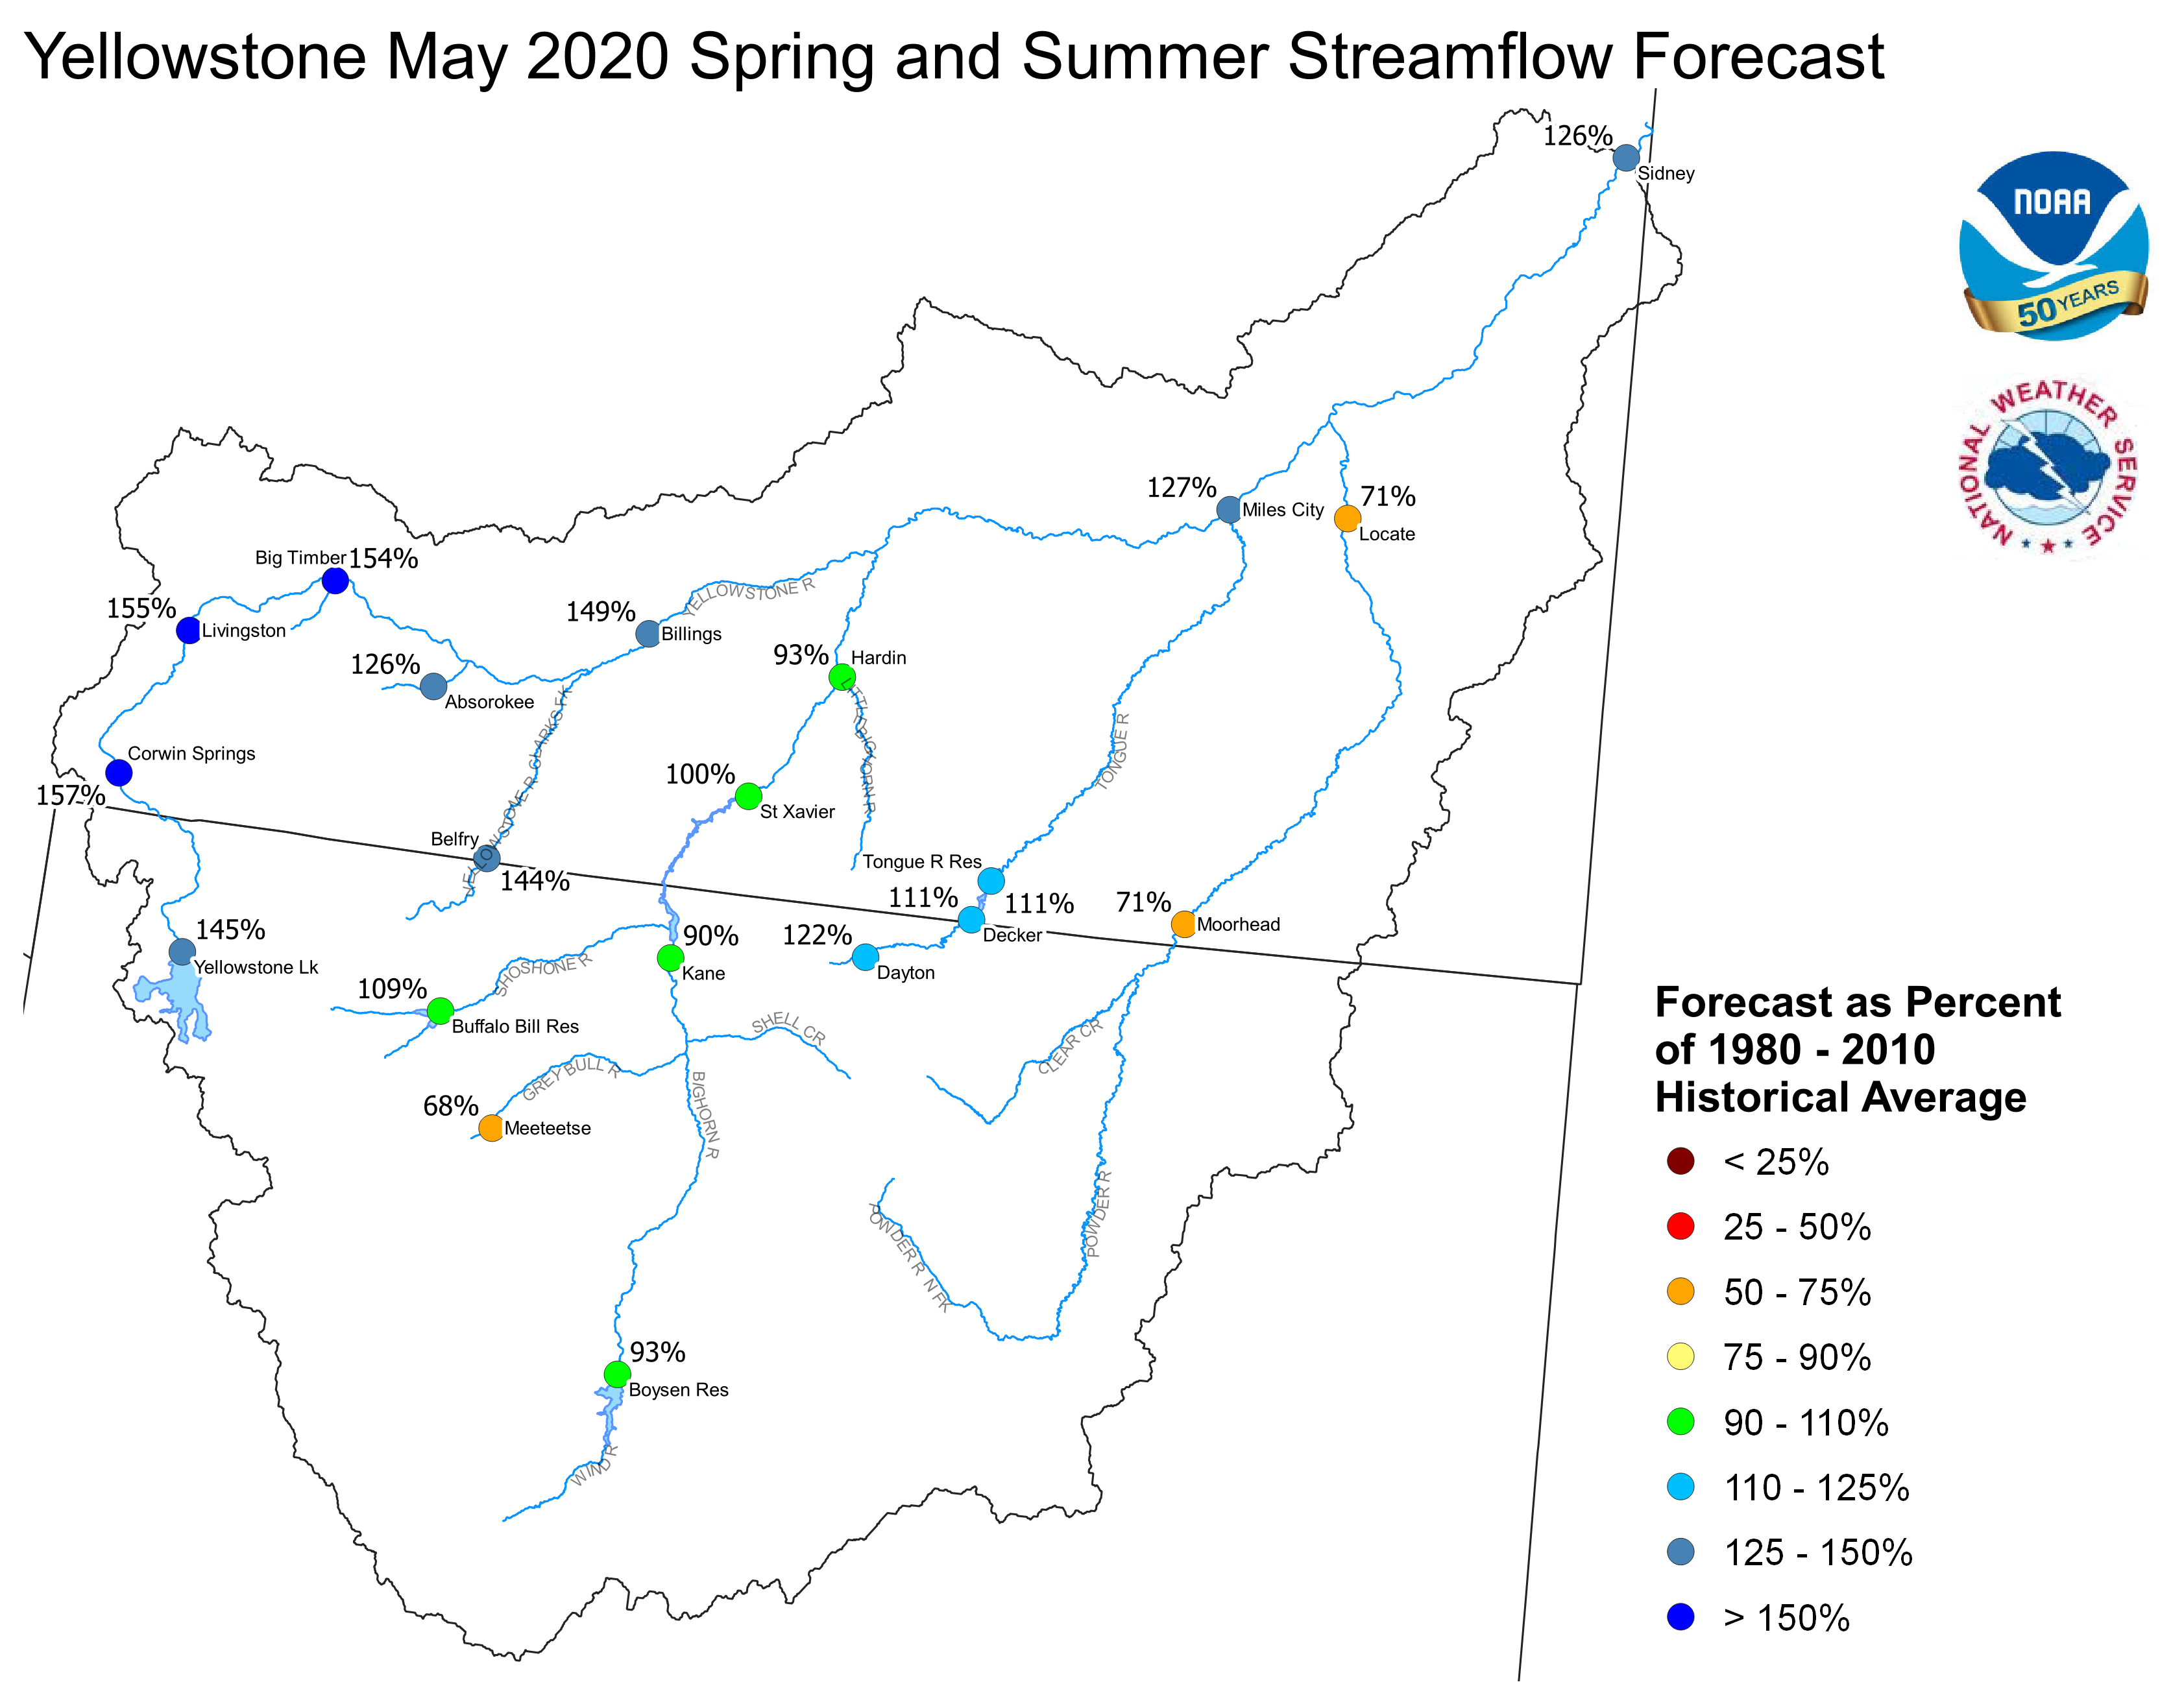
Yellowstone May 1, 2020 Spring and Summer Streamflow Forecasts
Platte Basin
The high elevation snow pack in the Upper North Platte Basin was 106 percent of average on May 1. The snow pack in the North Platte Basin below Seminoe Reservoir was 110 percent of average. The snow pack in the South Platte Basin was 118 percent of average.
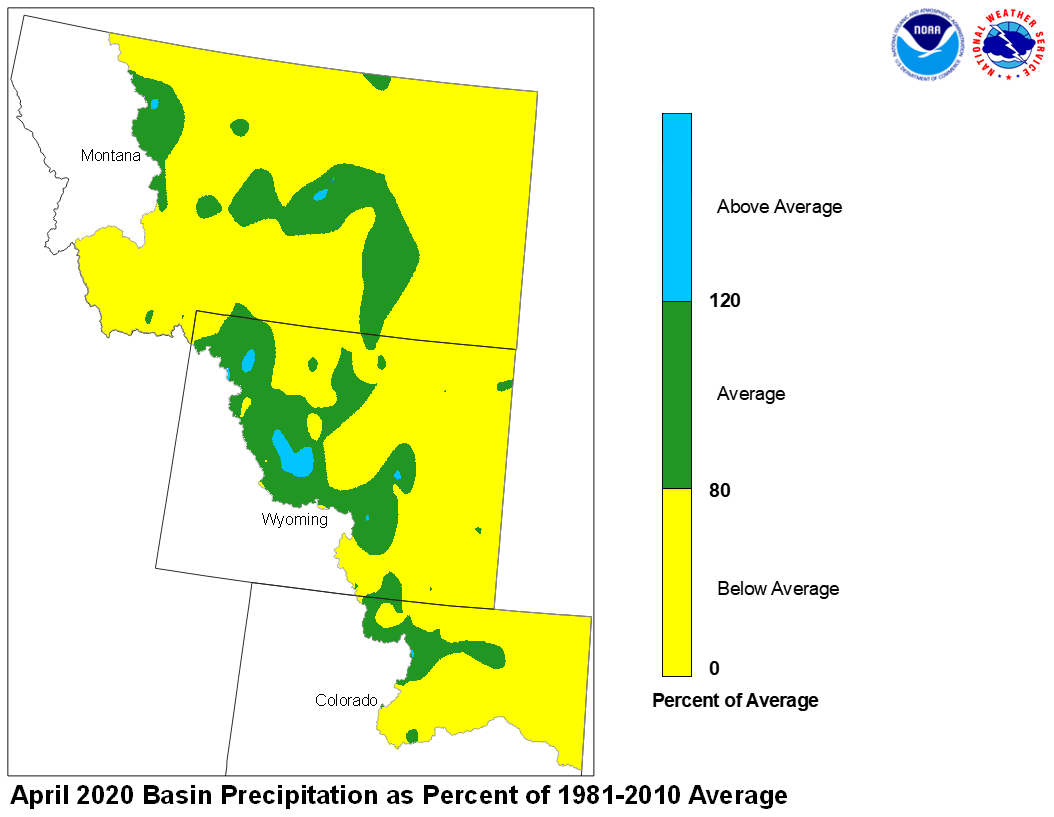
Precipitation during April in the Upper North Platte Basin was 78 percent of average. In the Lower North Platte Basin, precipitation was 72 percent of average. The North Platte Plains below Guernsy Reservoir had 51 percent. The South Platte Mountains had 64 percent whereas the Plains had 55 percent of average April precipitation.
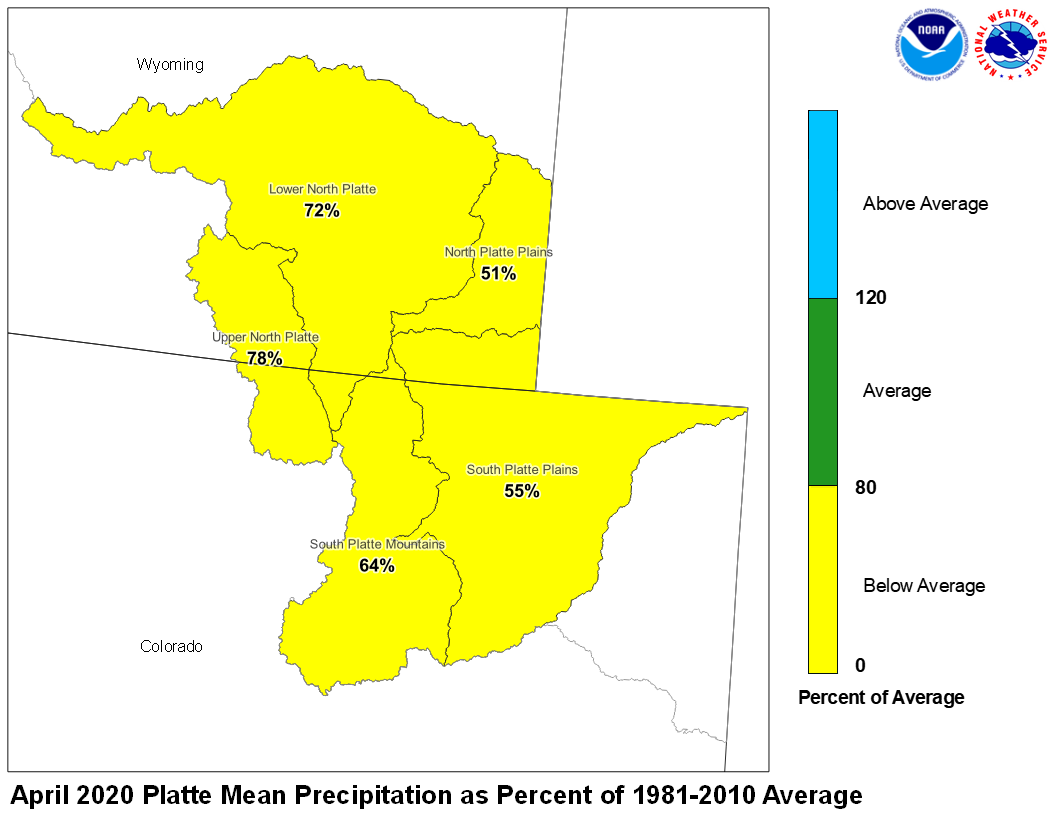
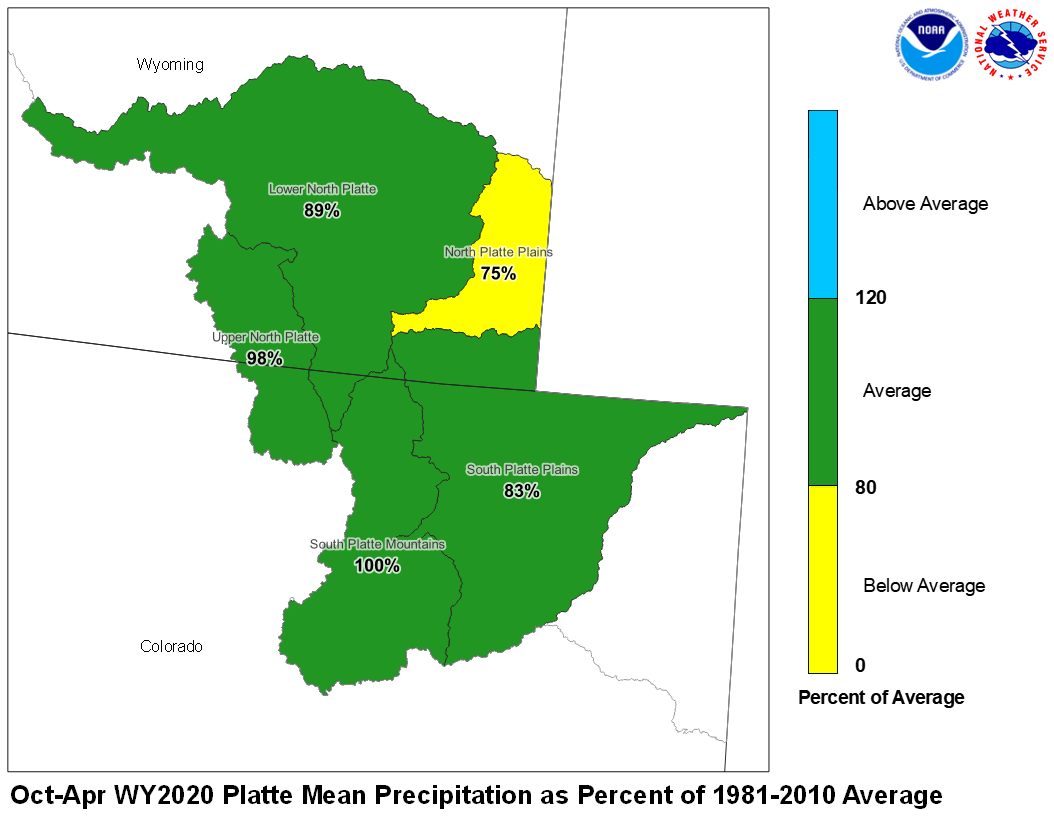
April 2020 Platte Mean Precip Oct-Apr WY2020 Platte Mean Precip
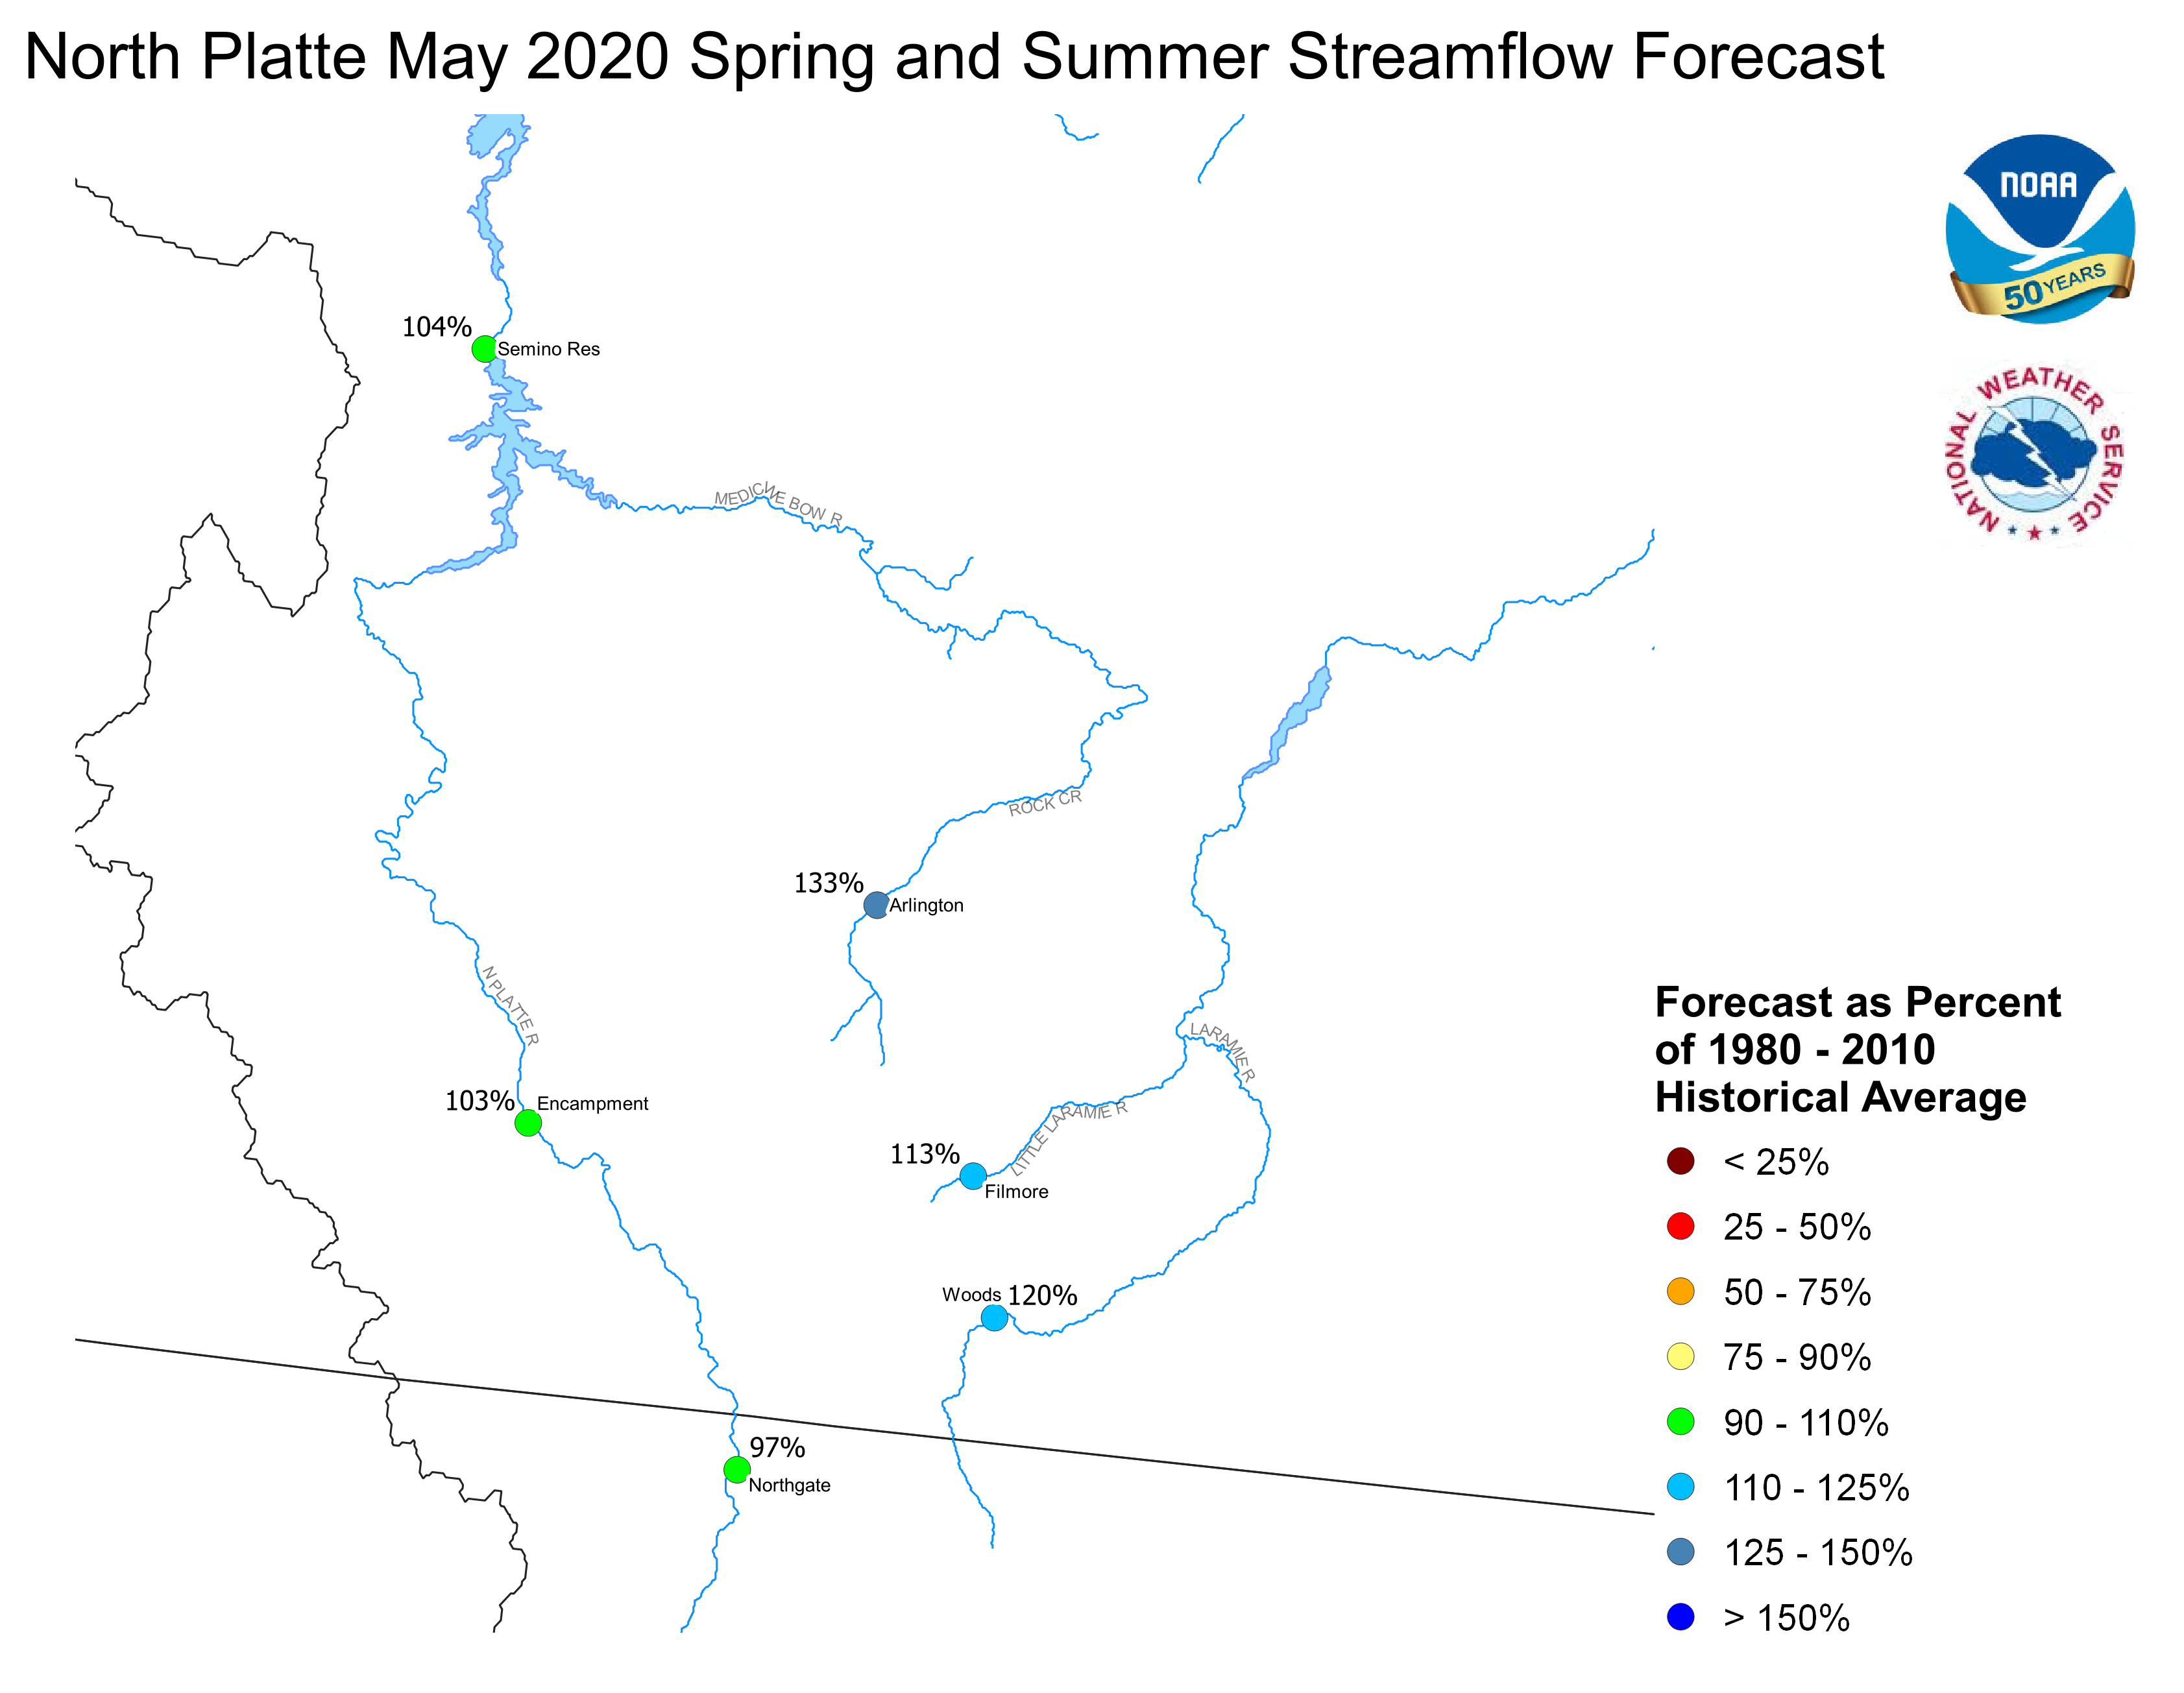
Stream flow in the Platte Basin is forecast to be near to below average during the upcoming Spring and Summer. Runoff for streams above Seminoe Reservoir are expected to be about 118 percent of average. Streams in the South Platte Basin above South Platte, Colorado can expect 70 percent of average flow. For the remainder of the South Platte basin, flows are expected near 69 percent.
Stored water in the South Platte Basin was 108 percent of average on May 1.
North Platte Streamflow Fcst South Platte Streamflow Fcst
000
FGUS63 KKRF 081509
ESPKRF

WATER SUPPLY FORECAST
NWS MISSOURI BASIN RIVER FORECAST CENTER
PLEASANT HILL MISSOURI

1509 CDT FRIDAY MAY 08, 2020

DATA CURRENT AS OF: MAY 06, 2020

MISSOURI/YELLOWSTONE/PLATTE RIVER BASIN FORECASTS

                                         50%    %   10%    90%   AVG
FORECAST POINT                  PERIOD  (KAF)  AVG (KAF)  (KAF) (KAF)
---------------------------------------------------------------------

SBDW4N                          MAY-SEP  882   90   1226   667   981
BOYSEN RESERVOIR INFLOW

LVEW4N                          MAY-SEP  1331  86   1763   1039 1552
BIGHORN R AT KANE

MEEW4N                          MAY-SEP  170   75   235    124   226
GREYBULL R NR MEETEETSE

CDYW4N                          MAY-SEP  649   99   793    518   655
BUFFALO BILL RESERVOIR INFLOW

SMYM8N                          MAY-SEP  443   115  497    369   385
ST MARY R NR BABB

SMBM8N                          MAY-SEP  521   116  603    427   450
ST MARY R NR INT BOUNDARY

PDBM8N                          MAY-SEP  27    104  77     15    26
MILK R NR WESTERN CROSSING

ERNM8N                          MAY-SEP  47    100  133    25    47
MILK R AT EASTERN CROSSING

NGTC2                           MAY-SEP  337   121  433    283   278
NORTH PLATTE R NR NORTHGATE

ECRW4                           MAY-SEP  157   116  181    136   135
ENCAMPMENT R NR ENCAMPMENT

ECRW4N                          MAY-SEP  165   116  189    145   142
ENCAMPMENT R NR ENCAMPMENT

KCRW4                           MAY-SEP  66    137  74     60    49
ROCK CR NR ARLINGTON

KCRW4N                          MAY-SEP  67    137  74     60    49
ROCK CR NR ARLINGTON

SETW4                           MAY-SEP  940   125  1131   789   751
SEMINOE RESERVOIR INFLOW WY

SETW4N                          MAY-SEP  1083  120  1272   939   901
SEMINOE RESERVOIR INFLOW WY

WODW4                           MAY-SEP  80    135  127    65    59
LARAMIE R NR WOODS

WODW4N                          MAY-SEP  114   124  161    99    92
LARAMIE R NR WOODS

SMTW4                           MAY-SEP  71    145  85     61    49
LITTLE LARAMIE R NR FILMORE

SMTW4N                          MAY-SEP  73    143  87     63    51
LITTLE LARAMIE R NR FILMORE

ANRC2N                          MAY-SEP  10    68   13     8     14
ANTERO RESERVOIR INFLOW

SPYC2N                          MAY-SEP  27    60   41     21    46
SPINNEY MOUNTAIN RES INFLOW

EVNC2N                          MAY-SEP  31    62   46     23    50
ELEVENMILE CANYON RES INFLOW

CHEC2N                          MAY-SEP  54    58   79     42    94
CHEESMAN LAKE INFLOW

SPTC2N                          MAY-SEP  105   63   150    84    166
SOUTH PLATTE R AT SOUTH PLATTE

MRRC2N                          MAY-SEP  7     44   12     4     16
BEAR CK AT MORRISON

GLDC2N                          MAY-SEP  67    59   88     57    114
CLEAR CK AT GOLDEN

LNSC2N                          MAY-SEP  67    78   93     57    86
ST VRAIN CK AT LYONS

OROC2N                          MAY-SEP  37    80   51     33    45
BOULDER CK NR ORODELL

BELC2N                          MAY-SEP  25    73   40     21    35
S BOULDER CK NR ELDORADO SPR

FTDC2N                          MAY-SEP  204   110  278    171   186
CACHE LA POUDRE AT CANYON MOUTH

LRRM8N                          MAY-SEP  61    128  84     43    47
LIMA RESERVOIR INFO

CLKM8N                          MAY-SEP  112   101  175    82    111
CLARK CANYON RESERVOIR INFLOW

BARM8N                          MAY-SEP  138   101  206    107   137
BEAVERHEAD R AT BARRETTS

ALRM8N                          MAY-SEP  71    93   90     59    76
RUBY R RESERVOIR INFLOW

MLRM8                           MAY-SEP  475   119  658    396   399
BIG HOLE R NR MELROSE

MLRM8N                          MAY-SEP  532   118  714    453   451
BIG HOLE R NR MELROSE

HBDM8N                          MAY-SEP  469   145  540    405   323
HEBGEN RESERVOIR INFFLOW

ELMM8N                          MAY-SEP  778   137  906    671   568
ENNIS RESERVOIR INFLOW

GLGM8                           MAY-SEP  355   87   466    300   410
GALLATIN R NR GATEWAY

GLGM8N                          MAY-SEP  355   86   466    299   410
GALLATIN R NR GATEWAY

LOGM8                           MAY-SEP  408   112  557    331   364
GALLATIN R AT LOGAN

LOGM8N                          MAY-SEP  537   109  666    471   495
GALLATIN R AT LOGAN

TOSM8N                          MAY-SEP  2364  115  2903   1992 2062
MISSOURI R AT TOSTON

FBNM8N                          MAY-SEP  3884  123  4653   3348 3171
MISSOURI R AT FORT BENTON

VRGM8N                          MAY-SEP  4426  126  5471   3818 3523
MISSOURI R NR VIRGELLE

LDKM8N                          MAY-SEP  4677  125  5950   4043 3739
MISSOURI R NR LANDUSKY

FPKM8N                          MAY-SEP  5036  128  6527   4341 3943
MISSOURI R BLW FT PECK DAM

AGSM8N                          MAY-SEP  583   196  738    529   298
GIBSON RESERVOIR INFLOW

SHLM8N                          MAY-SEP  393   130  517    311   301
MARIAS R NR SHELBY

HLWM8N                          MAY-SEP  104   126  145    71    82
MUSSELSHELL R AT HARLOWTON

YLOW4                           MAY-SEP  623   101  722    552   617
YELLOWSTONE R AT YELLOWSTONE LK

YLOW4N                          MAY-SEP  742   117  869    630   634
YELLOWSTONE R AT YELLOWSTONE LK

CORM8                           MAY-SEP  1549  111  1801   1333 1400
YELLOWSTONE R AT CORWIN SPRINGS

CORM8N                          MAY-SEP  1744  113  2037   1492 1539
YELLOWSTONE R AT CORWIN SPRINGS

LIVM8                           MAY-SEP  1802  112  2095   1562 1607
YELLOWSTONE R AT LIVINGSTON

LIVM8N                          MAY-SEP  2058  114  2397   1784 1805
YELLOWSTONE R AT LIVINGSTON

BILM8                           MAY-SEP  3372  120  3952   2970 2818
YELLOWSTONE R AT BILLINGS

BILM8N                          MAY-SEP  4002  109  4603   3585 3669
YELLOWSTONE R AT BILLINGS

MILM8N                          MAY-SEP  6454  102  7969   5603 6325
YELLOWSTONE R AT MILES CITY

SIDM8N                          MAY-SEP  6720  102  8341   5831 6596
YELLOWSTONE R AT SIDNEY

BTMM8                           MAY-SEP  239   97   283    209   247
BOULDER R AT BIG TIMBER

BTMM8N                          MAY-SEP  280   97   323    250   288
BOULDER R AT BIG TIMBER

SRAM8                           MAY-SEP  495   109  582    434   455
STILLWATER R NR ABSAROKEE

SRAM8N                          MAY-SEP  538   104  624    477   514
STILLWATER R NR ABSAROKEE

BFYM8                           MAY-SEP  499   108  601    440   461
CLARKS FK YELWSTONE R NR BELFRY

BFYM8N                          MAY-SEP  557   105  658    500   529
CLARKS FK YELWSTONE R NR BELFRY

STXM8N                          MAY-SEP  2115  93   2691   1696 2284
BIGHORN R NR ST XAVIER

HRDM8N                          MAY-SEP  71    85   103    62    84
LITTLE BIGHORN R NR HARDIN

DAYW4N                          MAY-SEP  66    86   98     56    76
TONGUE R NR DAYTON

DSLM8N                          MAY-SEP  160   83   238    135   194
TONGUE R NR DECKER

DKRM8N                          MAY-SEP  161   82   241    135   195
TONGUE R RESERVOIR INFLOW

MHDM8N                          MAY-SEP  153   92   217    118   167
POWDER R NR MOORHEAD

LOCM8N                          MAY-SEP  165   90   237    130   183
POWDER R NR LOCATE


LOCATIONS WITH AN `N` SUFFIX INDICATE NATURAL FLOWS EXCLUDING STREAM
AUGMENTATIONS

KAF: THOUSANDS OF ACRE-FEET

%AVG: CURRENT 50%/AVG

AVG: AVERAGE (50%) SEASONAL RUNOFF VOLUME AS SIMULATED BY THE RIVER
FORECAST MODEL CONSIDERING A CONTINUOUS SIMULATION OF THE BASIN
RESPONSE TO HISTORIC CLIMATE DATA (OBSERVED PRECIPITATION AND
TEMPERATURES) OVER THE PERIOD OF 1981-2010

THE 50%, 10% AND 90% COLUMNS INDICATE THE PROBABILITY THAT THE
ACTUAL VOLUME WILL EXCEED THE FORECAST FOR THE VALID TIME PERIOD

FOR MORE INFORMATION, PLEASE VISIT: WWW.WEATHER.GOV/MBRFC/WATER


